Fishbone Root Cause Analysis
Prepared by: [YOUR NAME]
Date: [DATE]
I. Introduction to Fishbone Root Cause Analysis
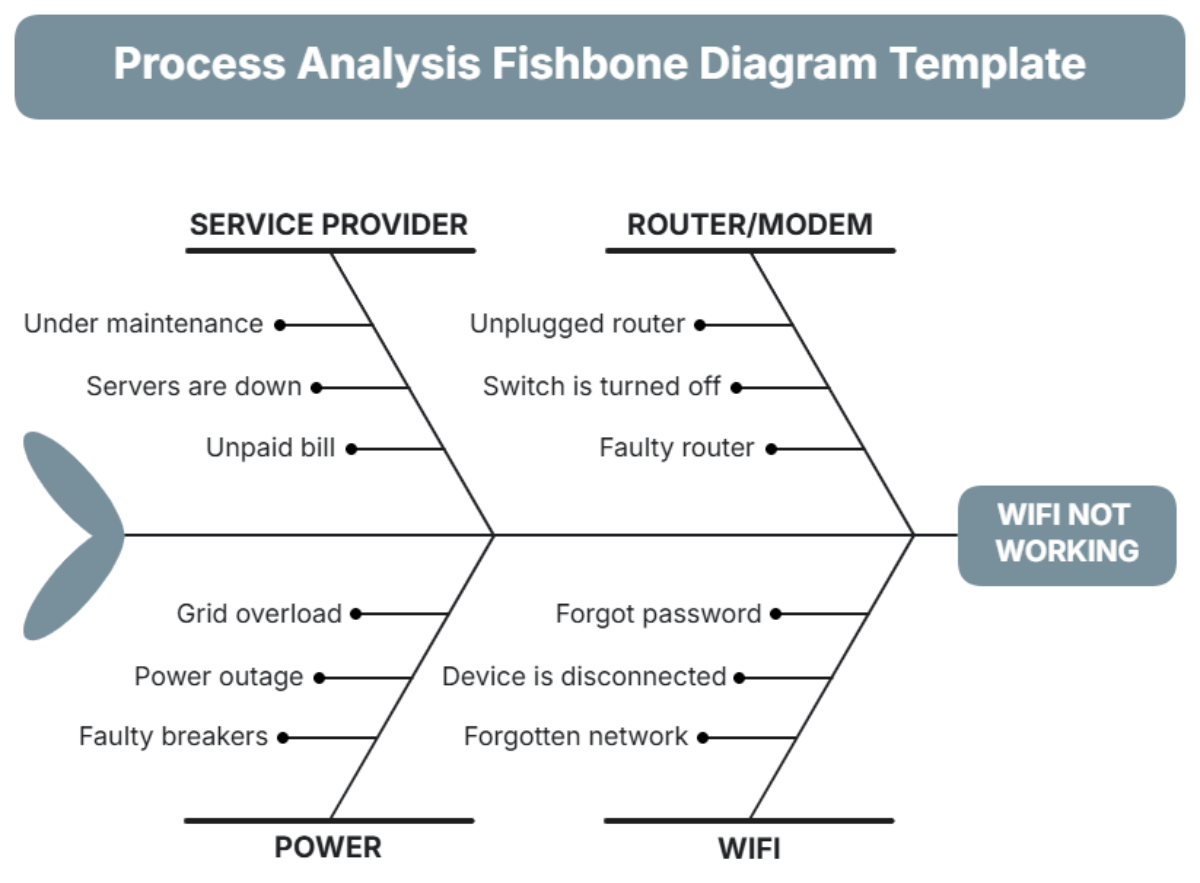
Fishbone Root Cause Analysis, also known as an Ishikawa or Cause-and-Effect Diagram, is a visual tool used to systematically identify and analyze the root causes of a problem. The diagram resembles a fishbone, with the "head" representing the problem and the "bones" representing categories of potential causes.
II. Components of the Fishbone Diagram
The Fishbone Diagram typically includes the following components:
A. Problem Statement
At the start or "head" of the fishbone diagram, you will find the problem statement, which is essential for clearly defining the issue being analyzed; it should be concise yet comprehensive, and specific to ensure clarity and precision.
B. Major Categories
Major categories representing potential causes are the "bones" that branch off from the spine of the fishbone. Common categories include:
People
Processes
Equipment
Materials
Environment
Management
C. Cause Factors
Each major category branches into subcategories that list specific cause factors. These factors help in further breaking down the major categories to pinpoint specific areas contributing to the problem.
III. Steps to Create a Fishbone Diagram
The following steps guide you through creating an effective Fishbone Diagram:
A. Step 1: Identify the Problem
When creating a fishbone diagram for analysis, it's crucial to clearly define and communicate the specific problem at the beginning, ensuring that all team members comprehend and concur with its nature to effectively concentrate the analysis on the same issue.
B. Step 2: Determine Major Categories
Identify the primary classifications or groups of possible causes that are associated with the problem at hand. These classifications serve as the principal "bones" that extend outward from the central line, or "spine," of the diagram.
C. Step 3: Brainstorm Possible Causes
Conduct detailed brainstorming sessions with the entire team to explore and identify various potential causes for each key category, then systematically add these causes as branches from the main category to show their connections.
D. Step 4: Analyze and Prioritize Causes
Analyze the complete list of possible causes to pinpoint those most likely responsible for the current problem, then prioritize these factors for in-depth investigation and action, ensuring the most critical issues are addressed first.
E. Step 5: Take Action
Create detailed action plans to tackle the root causes that have been identified. Clearly designate specific responsibilities to team members and establish precise timelines to ensure that the corrective actions are implemented effectively.
IV. Example of a Fishbone Diagram
The following table provides an example of a Fishbone Diagram applied to a problem of "Decreased Product Quality":
Major Category | Possible Causes |
|---|---|
People |
|
Processes |
|
Equipment |
|
Materials |
|
Environment |
|
Management |
|
V. Benefits of Using Fishbone Diagram
Using a Fishbone Diagram offers several benefits, including:
Helps in visually organizing potential causes of a problem.
Encourages team collaboration and brainstorming.
Facilitates identification of root causes, not just symptoms.
Provides a clear and structured approach to problem-solving.
Enhances understanding of complex issues by breaking them down into manageable categories.
VI. Limitations of Fishbone Diagram
While useful, Fishbone Diagrams have certain limitations:
May become complex and hard to manage with too many potential causes.
Requires input from knowledgeable team members to be effective.
Does not quantify the impact of different causes; relies on subjective analysis.
May not be suitable for highly complex problems with interconnected causes.
VII. Conclusion
Fishbone Root Cause Analysis is a powerful tool for systematically identifying and analyzing the root causes of a problem. Visually organizing potential causes, helps teams to brainstorm effectively, prioritize issues, and develop targeted action plans. However, it is important to understand its limitations and ensure that the analysis is complemented with other diagnostic tools and methods for a comprehensive problem-solving approach.

