Survey Methodology
Prepared by: [Your Name]
Date: [Date]
I. Introduction
This survey methodology outlines the approach for evaluating consumer preferences regarding advanced technology products, such as quantum computing applications and augmented reality devices, in the year 2050. The survey aims to collect robust, actionable data that will inform product development and marketing strategies for leading tech companies. The methodology ensures the results are reliable, valid, and reflective of the target population's evolving technological interests.
II. Survey Design
II.I Identify Objectives
The primary objectives of this survey are to:
Understand consumer attitudes towards the latest quantum computing applications.
Assess the level of satisfaction with current augmented reality (AR) devices.
Identify the key features that consumers desire in future technology products.
Explore the impact of these technologies on everyday life and work efficiency.
II.II Questionnaire Development
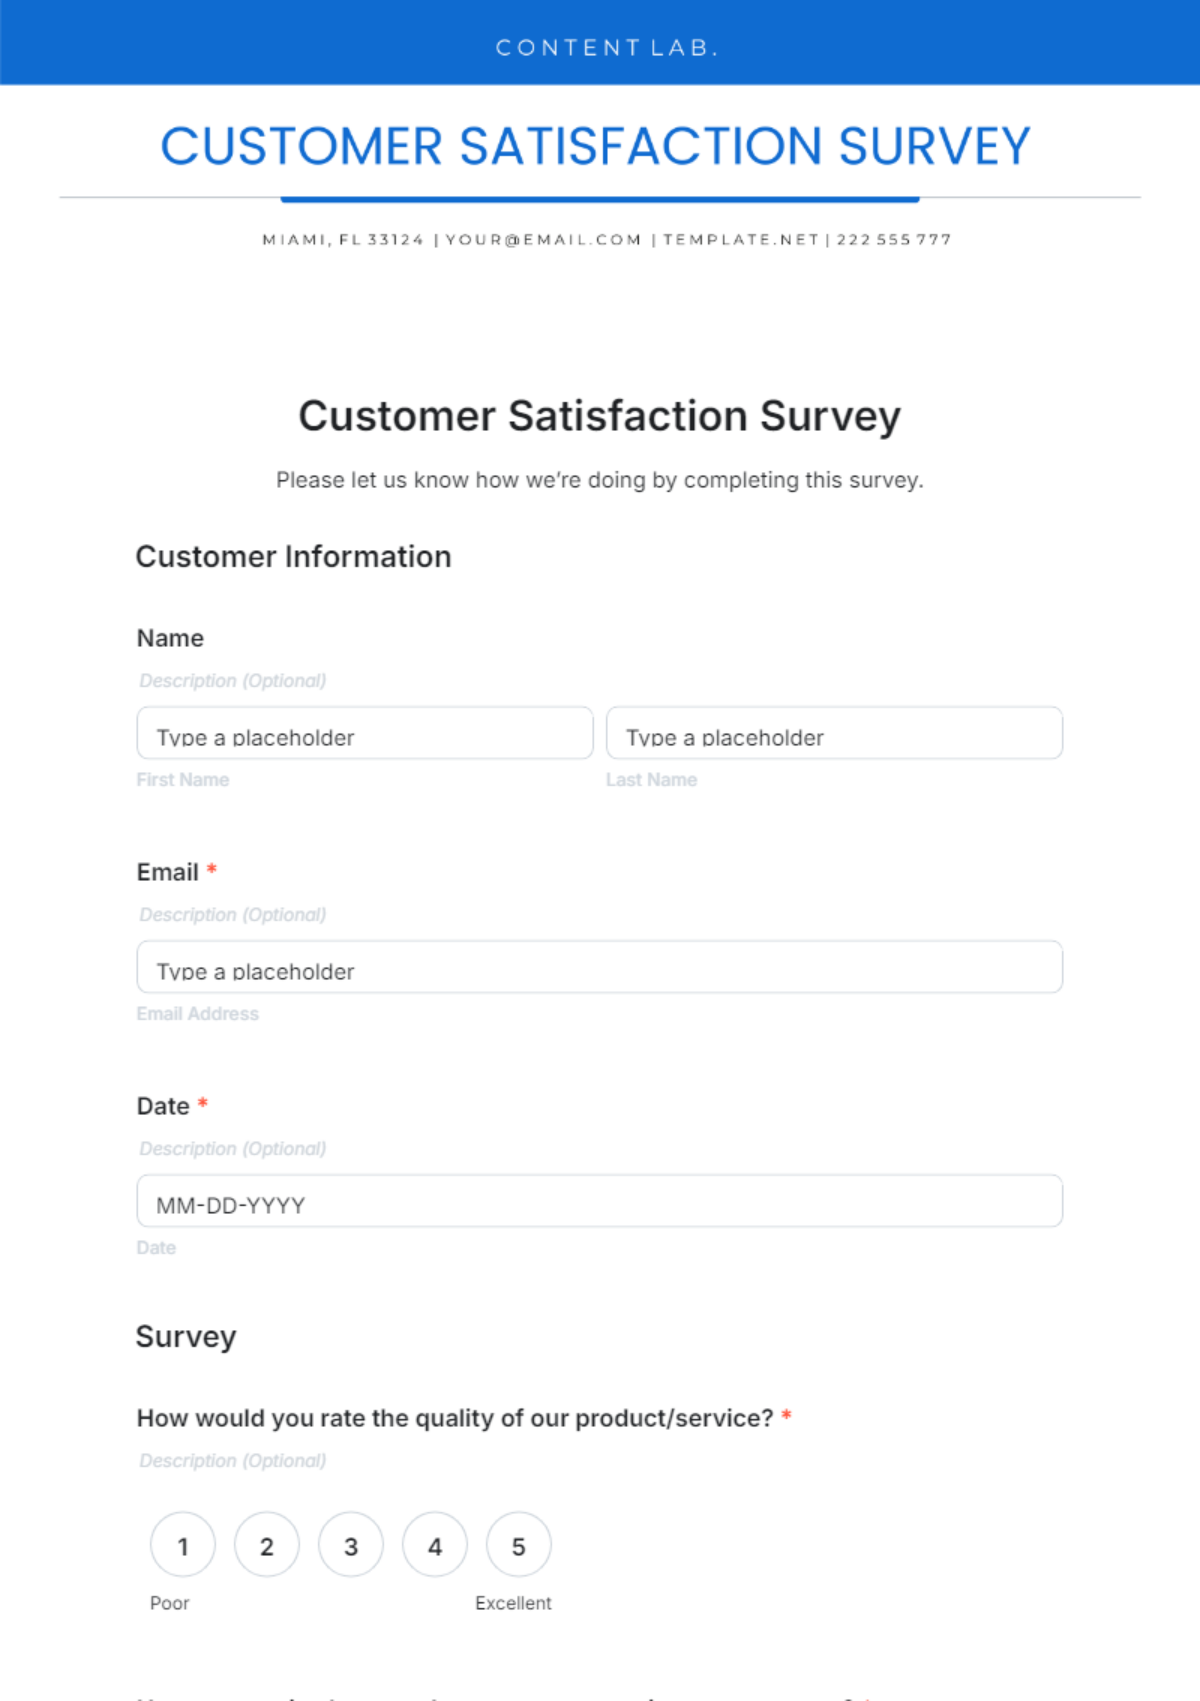
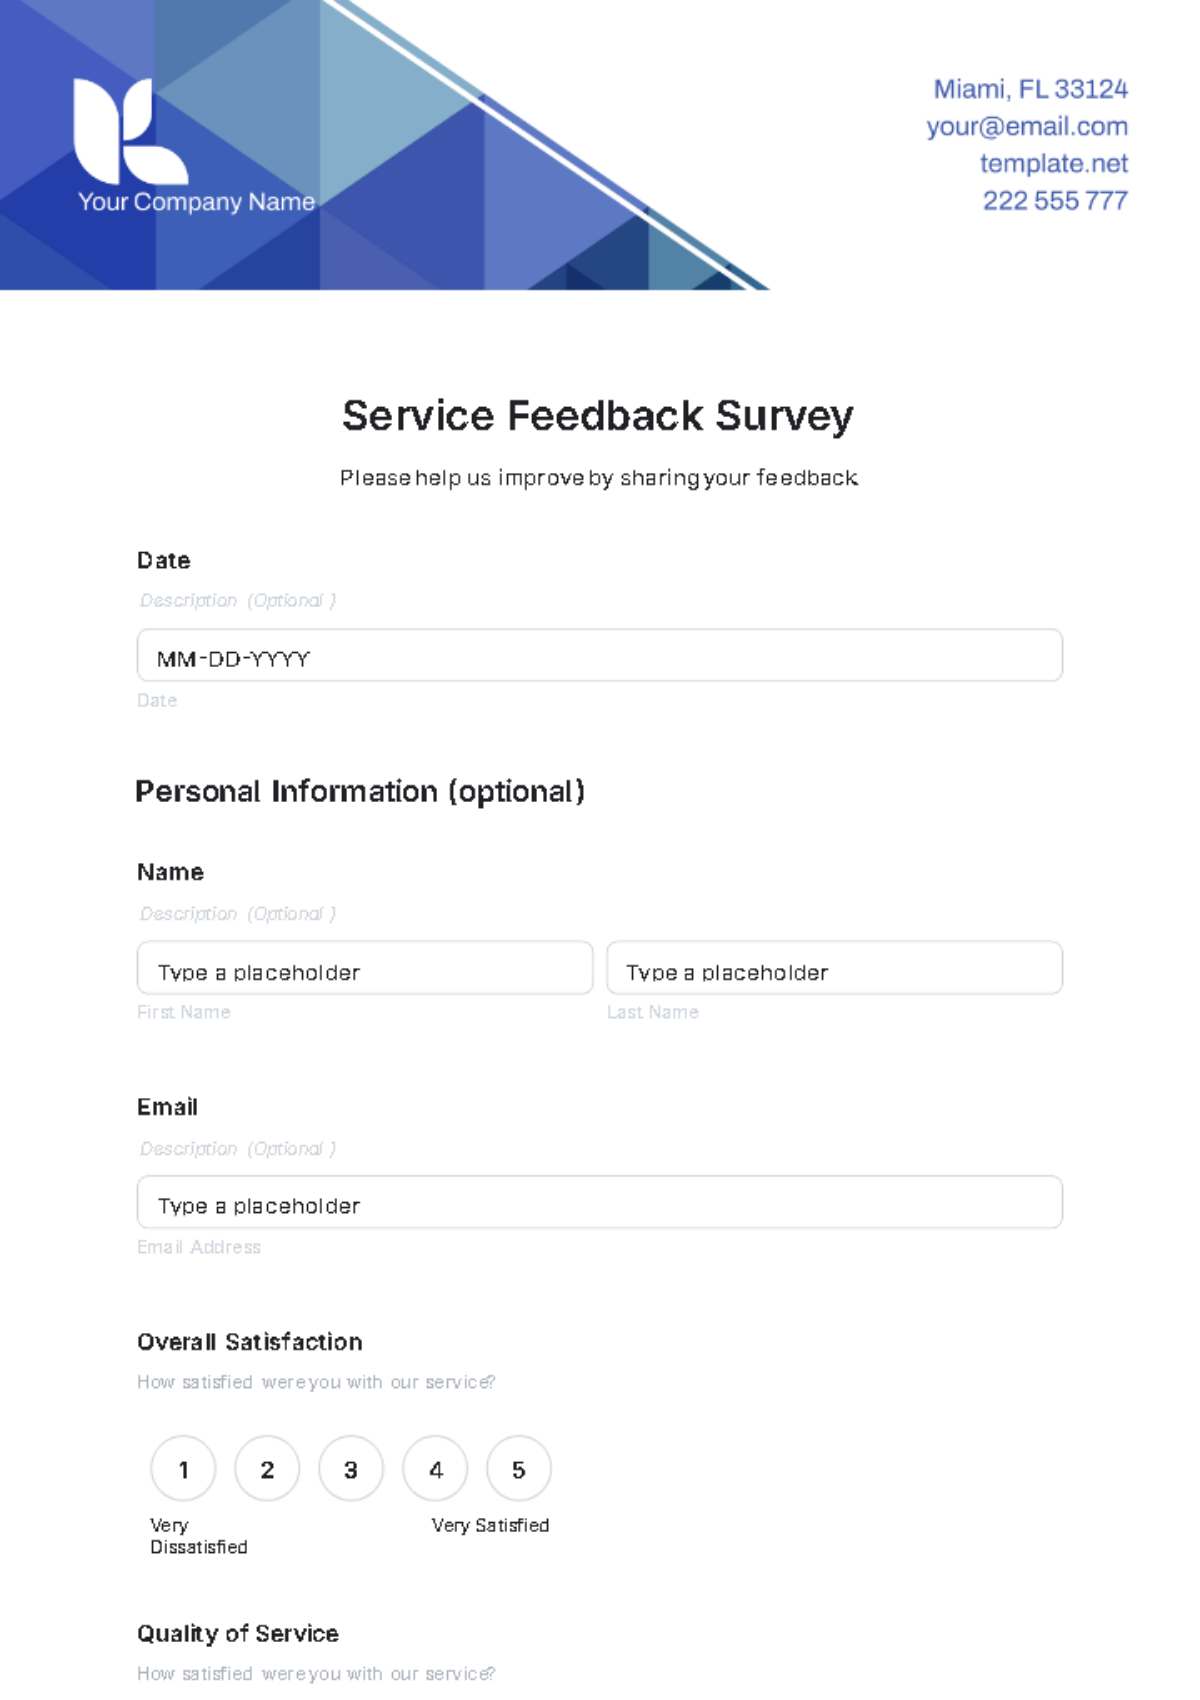
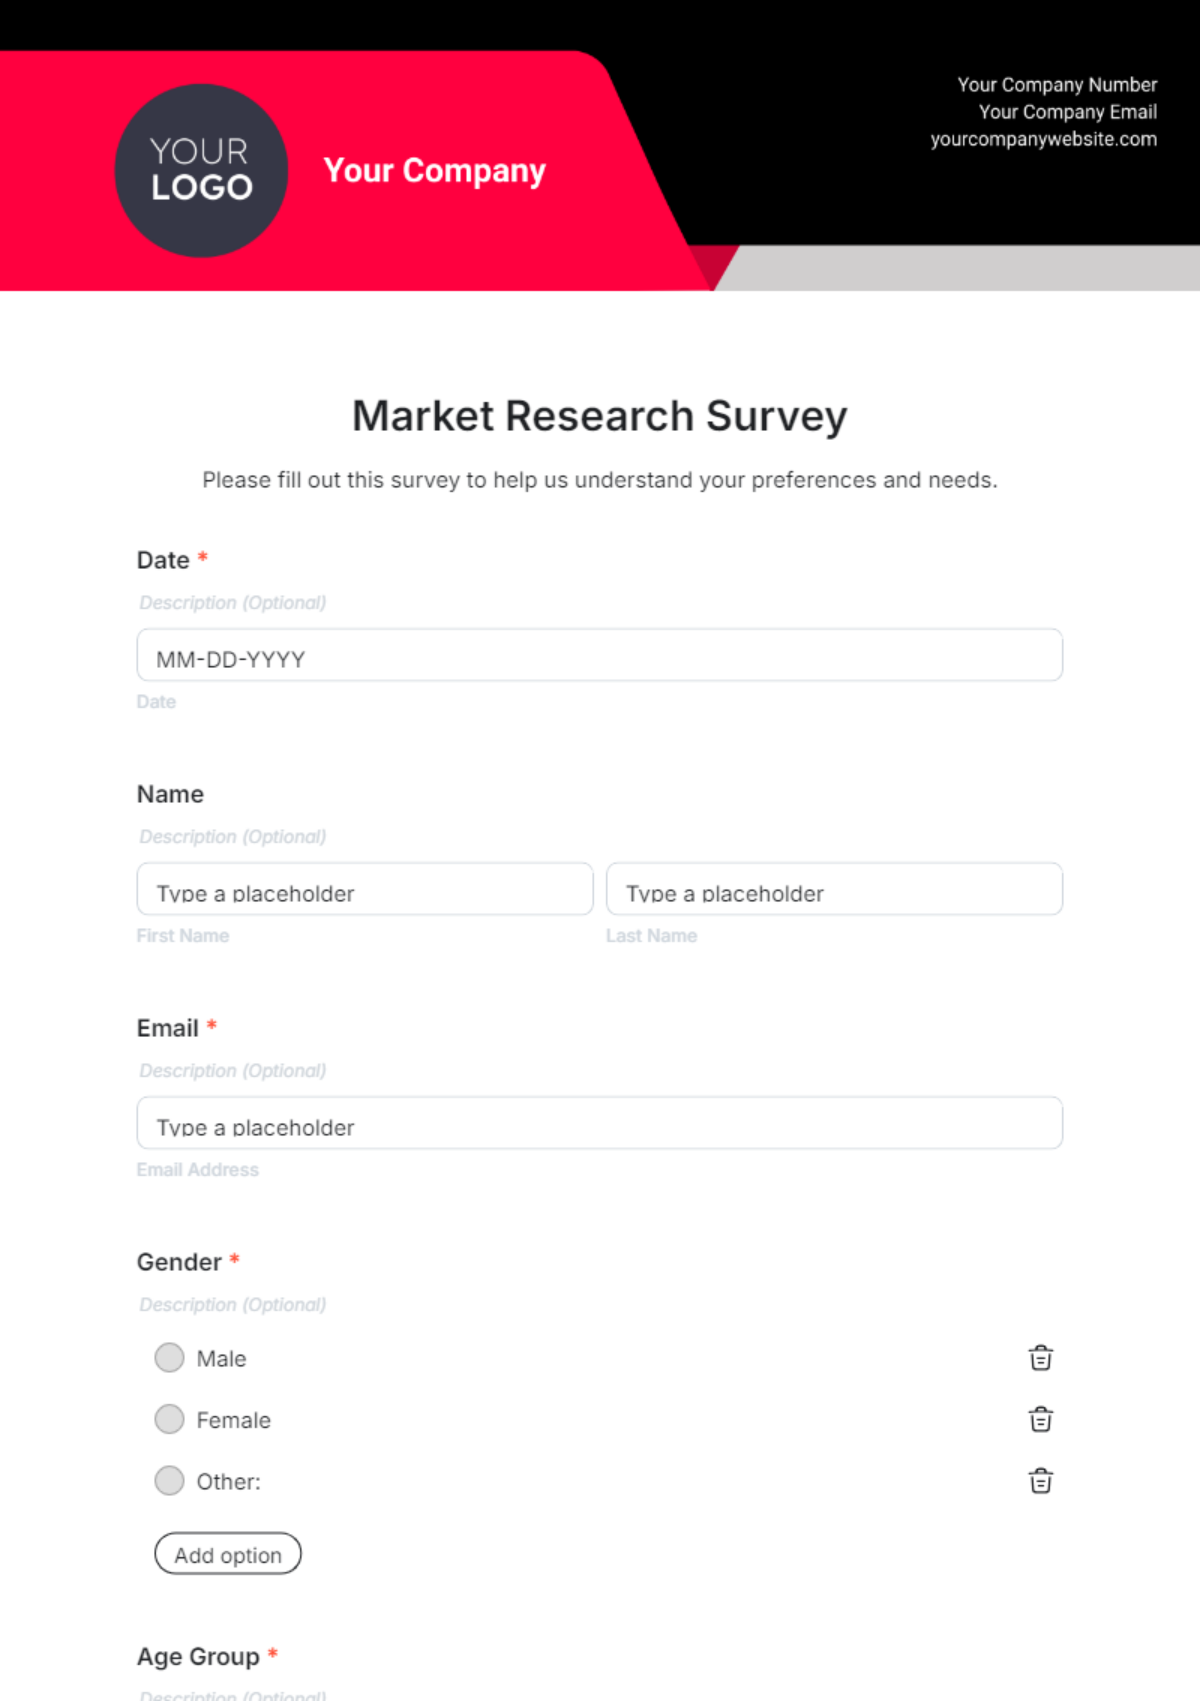
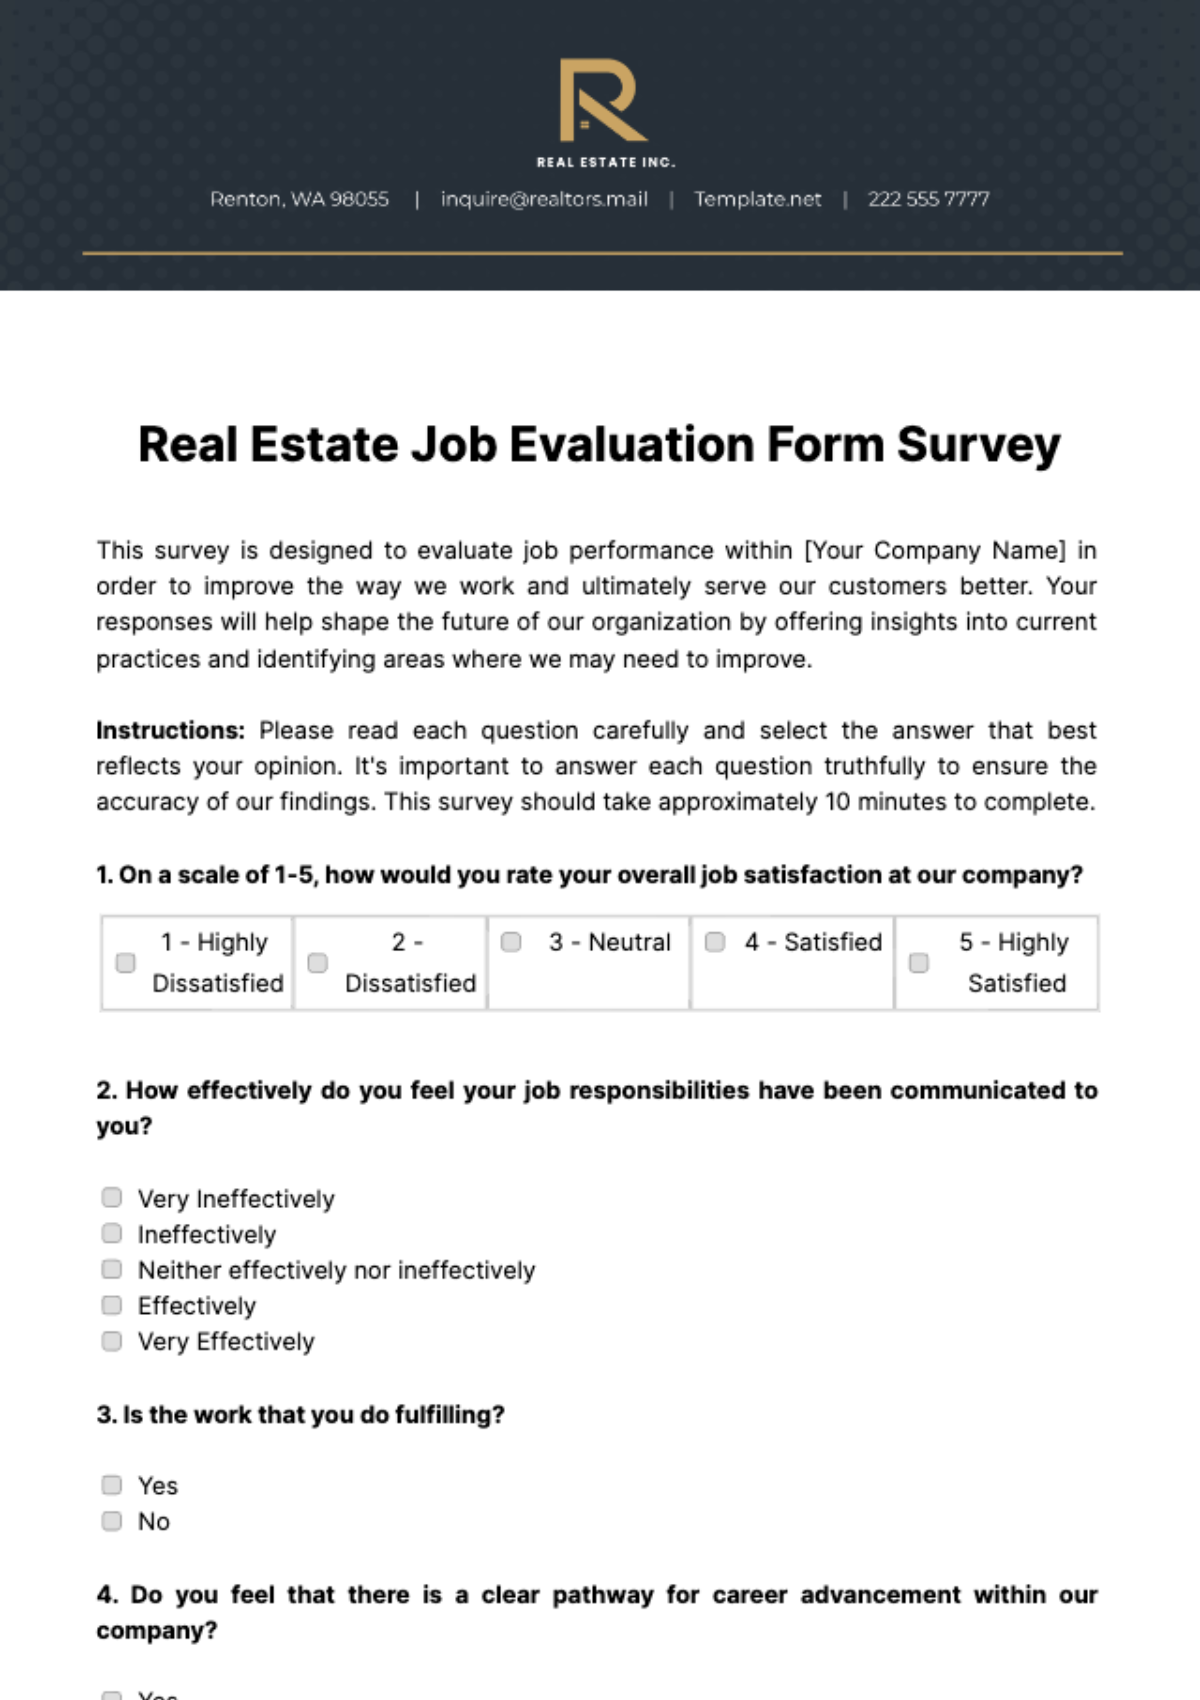
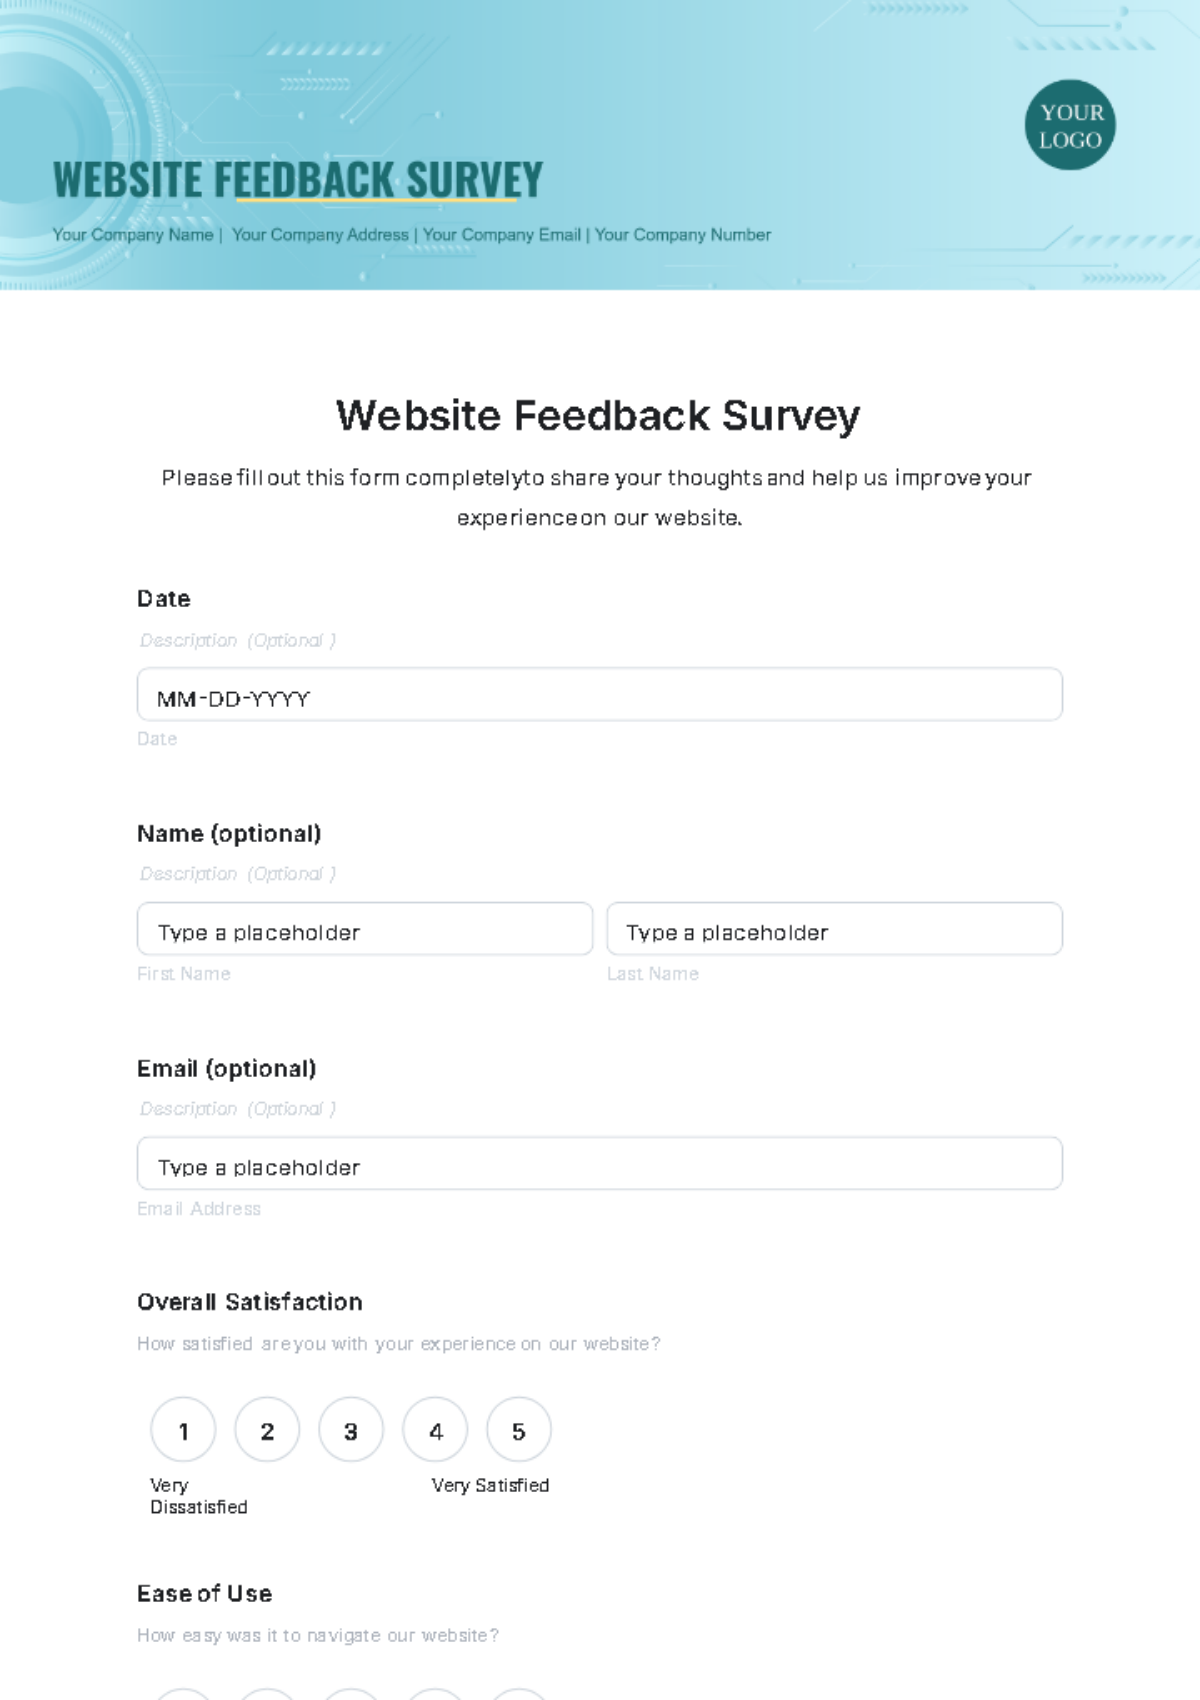
Formulating Questions: Develop questions that are clear, unbiased, and designed to elicit detailed responses. Examples include:
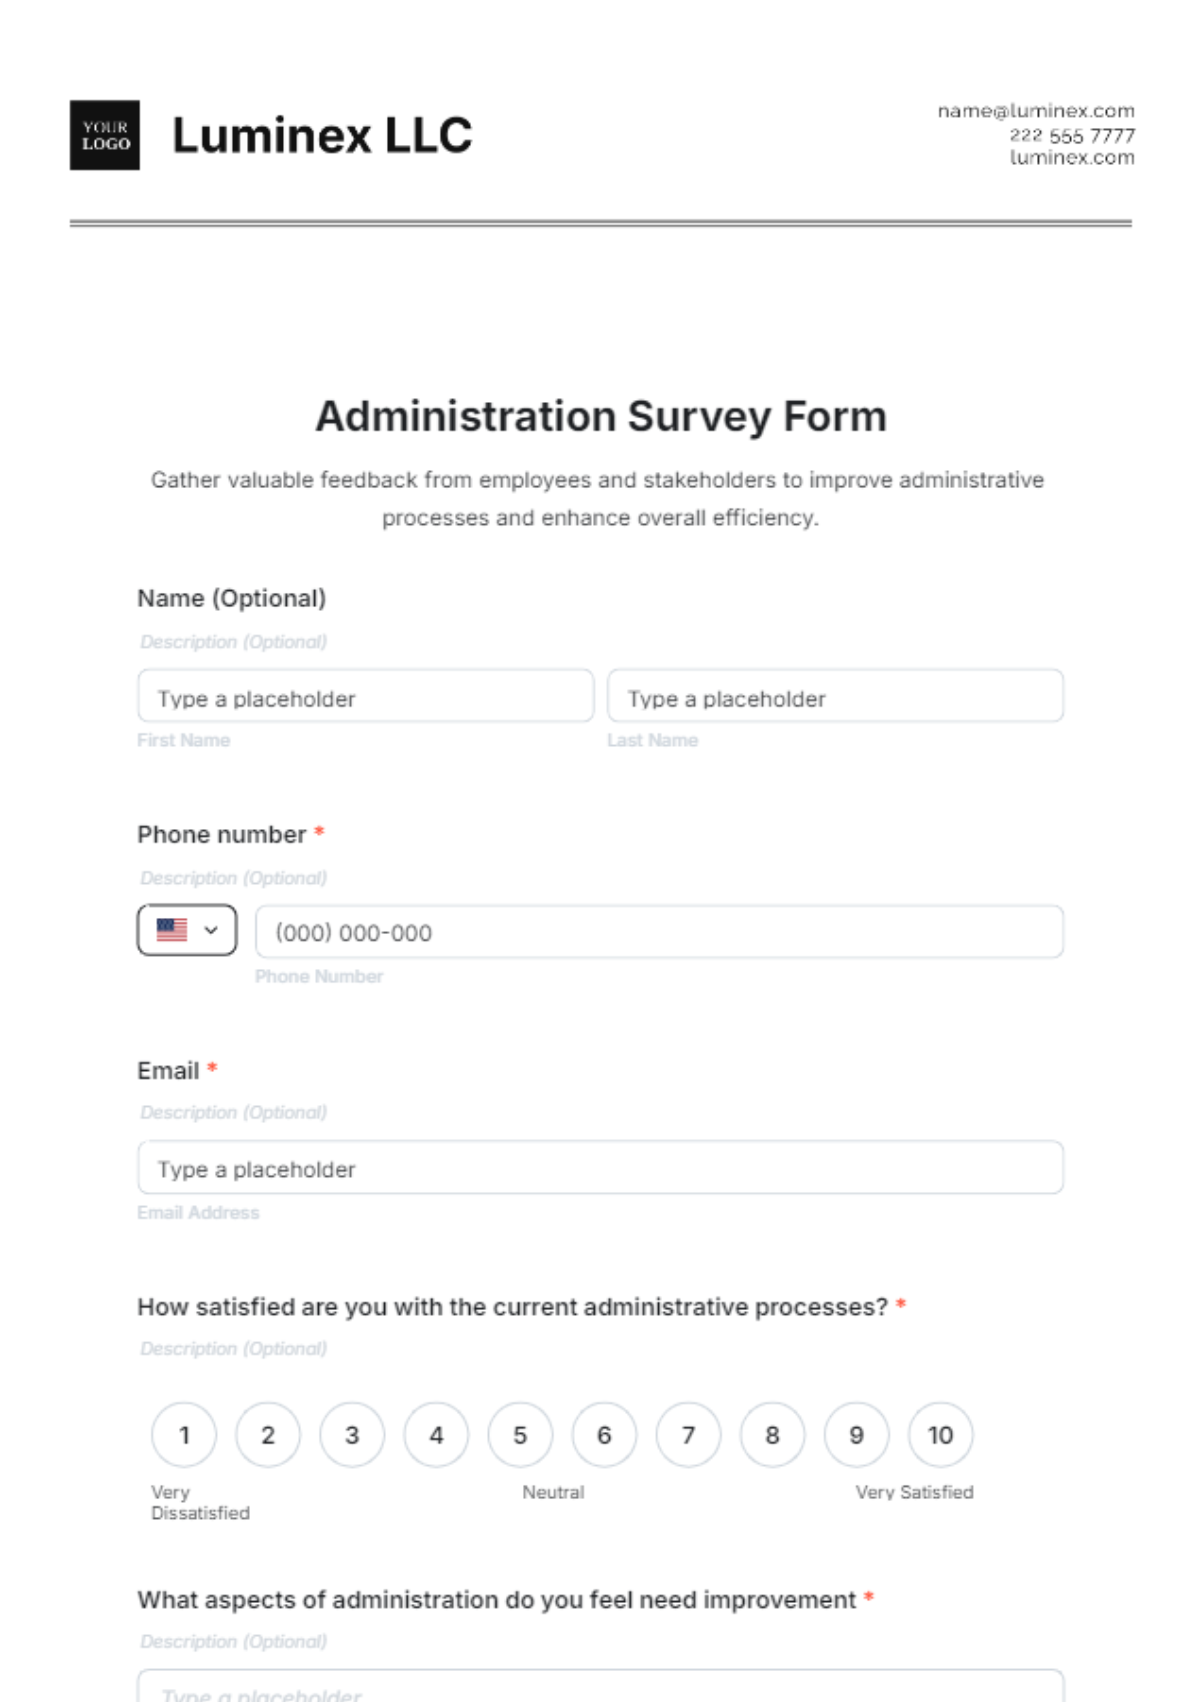
"On a scale of 1 to 10, how would you rate the usability of quantum computing applications in your daily tasks?"
"What improvements would you like to see in the next generation of augmented reality devices?"
"Describe a scenario where augmented reality has significantly enhanced your work performance."
Question Types: Use a mix of question types:
Multiple-choice: "Which feature is most important in an AR device? (e.g., immersive experience, battery life, app compatibility)"
Likert Scale: "Rate your agreement with the following statement: 'Quantum computing has made my work more efficient.' (Strongly agree, Agree, Neutral, Disagree, Strongly disagree)"
Open-ended: "What new functionalities would you like to see in quantum computing applications in the next five years?"
Survey Length: Target a completion time of 8-10 minutes to maintain engagement and minimize respondent fatigue.
II.III Pre-testing
Conduct a pre-test with a sample of 50 tech-savvy individuals to refine the questionnaire. For instance, test a sample from a tech innovation forum to identify and address any ambiguities or technical issues. Revise questions based on feedback to ensure clarity and relevance.
III. Sampling Methods
III.I Probability Sampling
Simple Random Sampling: Randomly select 1,000 participants from a global database of tech users. Example: Use an AI-driven randomization tool to select participants from regions like North America, Europe, and Asia.
Stratified Random Sampling: Segment the population by age, tech proficiency, and geographic location. Example: Sample 250 individuals from each age group (18-24, 25-34, 35-44, 45-54, 55+) and tech proficiency level (beginner, intermediate, advanced).
Cluster Sampling: Choose 10 major tech hubs (e.g., San Francisco, Tokyo, Berlin) and sample 100 respondents from each hub. Example: Use local tech community networks to recruit participants.
III.II Non-Probability Sampling
Convenience Sampling: Survey participants at the Global Tech Expo 2050. Example: Use virtual reality booths to conduct surveys with attendees exploring new tech gadgets.
Judgmental Sampling: Include industry leaders and influencers. Example: Survey tech industry executives and thought leaders for expert insights.
Quota Sampling: Ensure representation from different demographic and tech usage segments. Example: Achieve quotas for varying levels of tech adoption and user demographics.
IV. Data Collection
IV.I Methods
Online Surveys: Deploy through a cutting-edge AI-powered platform capable of handling interactive and adaptive question types. Example: Use a platform like TechSurvey 2050 that integrates with AI to provide real-time feedback and adaptive questioning.
Telephone Surveys: Use advanced AI voice assistants to conduct interviews, providing real-time clarifications and capturing nuanced responses. Example: Deploy AI-driven voice bots to conduct structured interviews.
Face-to-Face Surveys: Implement at tech expos using holographic interfaces to engage participants. Example: Set up holographic kiosks at TechWorld Expo 2050 for immersive survey experiences.
Mail Surveys: Distribute digital surveys through secured virtual mailboxes tailored for tech enthusiasts. Example: Send surveys to users via encrypted channels for enhanced security and engagement.
IV.II Data Quality Assurance
Training Interviewers: Utilize virtual reality training simulations to prepare interviewers for effective data collection. Example: Conduct VR-based training sessions to familiarize interviewers with survey protocols.
Validated Questions: Regularly update questions to reflect the latest tech trends and ensure relevance. Example: Revise questions annually to incorporate emerging tech topics.
Monitoring: Employ AI systems to continuously monitor data collection processes and flag potential issues. Example: Use real-time analytics to track survey response rates and data quality.
V. Data Analysis
V.I Preprocessing
Handling Missing Data: Use AI algorithms to impute missing values and address outliers. Example: Apply machine learning models to estimate and correct missing or inconsistent responses.
Data Cleaning: Conduct thorough cleaning to remove erroneous entries and ensure data integrity.
V.II Descriptive Statistics
Mean, Median, Mode: Calculate central tendencies to summarize the data. Example: Determine the average rating of quantum computing applications and the most common feature desired in AR devices.
Standard Deviation: Assess variability in responses. Example: Measure the variability in user satisfaction ratings for AR devices.
Frequency Distributions: Create visual representations of data distributions. Example: Use interactive graphs to show the distribution of responses for tech product features.
V.III Inferential Statistics
Hypothesis Testing: Apply AI-driven hypothesis tests to evaluate significant differences and relationships. Example: Test whether satisfaction with AR devices differs significantly between age groups.
Regression Analysis: Analyze the impact of various factors on consumer preferences. Example: Use regression models to assess how quantum computing adoption influences work efficiency.
ANOVA: Evaluate differences across multiple groups. Example: Perform ANOVA to compare preferences for AR devices among different geographic regions.
VI. Results
VI.I Visualization
Charts, Graphs, and Tables: Present findings using 3D interactive charts and augmented reality displays. Example: Create an AR visualization showing how different tech features are rated by respondents.
Summary of Key Findings: Highlight significant results, such as "70% of respondents rated quantum computing applications as highly beneficial for productivity."
VII. Discussion
Implications: Discuss how findings can inform tech product development and marketing strategies. Example: Emphasize the need for enhanced AR features based on consumer preferences.
Limitations: Acknowledge limitations such as sample bias or technological constraints. Example: Note that convenience sampling may not fully represent global tech users.
VIII. Conclusion
VIII.I Overarching Findings
Summarize the main insights, such as the high demand for advanced AI features in tech products and the positive impact of quantum computing on user productivity.
VIII.II Future Research
Suggest areas for further study, such as exploring user experiences with emerging tech innovations and their potential future impacts.
