Free Social Media Observational Study
1. Objective or Purpose
To evaluate the effectiveness of new product launch campaign on [Platform Name], analyzing user engagement, sentiment, and reach over a 30-day period. The study aims to identify which types of content generate the highest engagement and how user sentiment changes based on content themes.
2. Platform Details
Platform Name: [e.g., Instagram, Facebook, Twitter]
Profile/Account Observed: [e.g., @BrandNameOfficial]
Content Types Studied:
Images: Promotional images, product photos, user-generated content (UGC).
Videos: Product demos, influencer collaborations, behind-the-scenes clips.
Stories: Daily updates, limited-time offers, polls, Q&A sessions.
Live Sessions: Weekly live streams showcasing product features and engaging with the audience.
3. Audience
Demographics:
Age: 18-35 years
Gender: 65% female, 35% male
Location: Primarily U.S.-based with secondary markets in Canada and the U.K.
Interests: Fitness, health, beauty, fashion.
Behavior:
Peak Activity Times: 6:00 PM to 10:00 PM on weekdays; weekends show consistent engagement throughout the day.
Engagement Preferences: Higher interaction with video content, especially influencer-led promotions, followed by stories with interactive polls or quizzes.
Follower Base:
Total Followers: 350,000 as of September 1, 2050.
Average Monthly Growth: 5% increase in followers during the campaign period.
4. Key Metrics
Engagement Rate:
Average engagement per post: 4.8% (likes, comments, shares).
Influencer collaborations resulted in a 7.2% engagement rate, outperforming non-collaborative posts.
Content Reach:
Image-based posts: Average reach of 25,000 users.
Video content: Average reach of 40,000 users.
Stories: 15,000 views per story with interactive elements.
Sentiment Analysis:
Positive feedback on new product line: 80% positive, 15% neutral, 5% negative.
Promotional content: 50% positive, 30% neutral, 20% negative.
Follower Growth:
Follower count increased by 10,500 during the 30-day period (3% growth).
Response Time:
Average response time to comments: 2 hours during business days.
Live session Q&A responses: Immediate during live streams, boosting engagement.
5. Observation Timeline
Start Date: September 1, 2050
End Date: September 30, 2050
Observation Frequency:
Daily observations at key times: 10:00 AM, 2:00 PM, and 7:00 PM to capture peak and off-peak behavior.
Weekly summary of high-performing posts to track trends.
6. Findings
Post Engagement:
Post 1 (September 5, 2050): 3,500 likes, 500 comments (80% positive feedback), 200 shares
.
Post 2 (September 10, 2050): 2,200 likes, 300 comments (60% positive, 30% neutral), 180 shares.
Post 3 (September 18, 2050): 5,000 likes, 700 comments (85% positive), 350 shares.
Content Performance:
Influencer video collaboration (September 12, 2050): Highest engagement, 7,000 likes, 1,000 comments, 400 shares, with 95% positive feedback.
Product launch images (September 20, 2050): Moderate engagement, 4,200 likes, 400 comments, 250 shares, but lower sentiment (70% positive, 15% neutral, 15% negative).
Audience Behavior:
Increased engagement on posts featuring behind-the-scenes content (30% more interaction than standard product photos).
Stories with polls saw a 50% higher response rate compared to stories without interactive elements.
Video content, especially influencer-led, consistently outperformed image-based posts by 40%.
Sentiment Analysis:
Positive sentiment: 75% overall for posts featuring user-generated content and testimonials.
Neutral or negative sentiment: Primarily on posts perceived as overly promotional or lacking authenticity (20% of comments).
7. Analysis
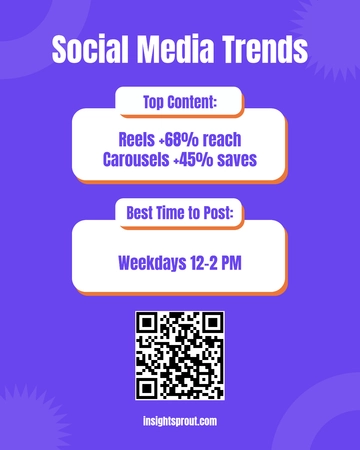
Video content significantly outperformed image posts, with an average reach of 40,000 compared to 25,000 for images. Influencer collaborations were the most successful, drawing a 7.2% engagement rate.
Engagement peaks between 6:00 PM and 8:00 PM, making this the ideal time for content release.
Audience responds more favorably to authentic content, such as behind-the-scenes footage or user-generated content, as opposed to direct promotional posts.
8. Conclusion
Conclusion:
The product launch campaign was largely successful in increasing both engagement and follower growth. Video content, particularly when featuring influencers, was the top-performing format. However, purely promotional posts saw lower engagement and sentiment.Recommendations:
Increase the use of video, especially in collaboration with influencers, to boost engagement.
Post content during peak hours (6:00 PM to 8:00 PM) for maximum reach.
Incorporate more behind-the-scenes content and interactive stories (e.g., polls, quizzes) to encourage user interaction.
Limit direct promotional posts or integrate them with storytelling to enhance authenticity and positive sentiment.
- 100% Customizable, free editor
- Access 1 Million+ Templates, photo’s & graphics
- Download or share as a template
- Click and replace photos, graphics, text, backgrounds
- Resize, crop, AI write & more
- Access advanced editor
Monitor online trends effectively with Template.net’s Social Media Observational Study Template. Customizable and editable, this template supports social media data collection. Easily editable in our Ai Editor Tool, it can be tailored to fit your social media analysis projects.
You may also like
- Instagram Ad
- Instagram Banner
- Instagram Frame
- Instagram Post
- Instagram Profile Picture
- Instagram Story
- Instagram Story Highlights
- Twitter Ad
- Twitter Header
- Twitter Post
- LinkedIn Photo
- Linkedin Post
- YouTube
- Youtube Ad
- Youtube Banner
- YouTube Channel Art
- YouTube End Screen
- Youtube Profile Photo
- YouTube Thumbnail
- Facebook Ad
- Facebook Cover
- Facebook Post
- Facebook Profile Frame
- Facebook Profile Photo
- Twitch Offline Banner
- Linkedin Banner
- Twitch Overlay
- Whatsapp Status
- Reddit Banner
- Social Media Banner
- Social Media Clipart
- Social Media Plan
- Social Media Contract
- Social Media Planner
- Social Media Report
- Social Media Agreement
- Social Media Business Card
- Social Media Proposal
- Social Media Presentation
