Brief Report
I. Introduction
This report provides a comprehensive overview of [YOUR COMPANY NAME]'s sales performance for the third quarter of 2073. The analysis includes a detailed examination of sales figures, key performance indicators (KPIs), and strategic recommendations for the upcoming quarter.
II. Sales Figures
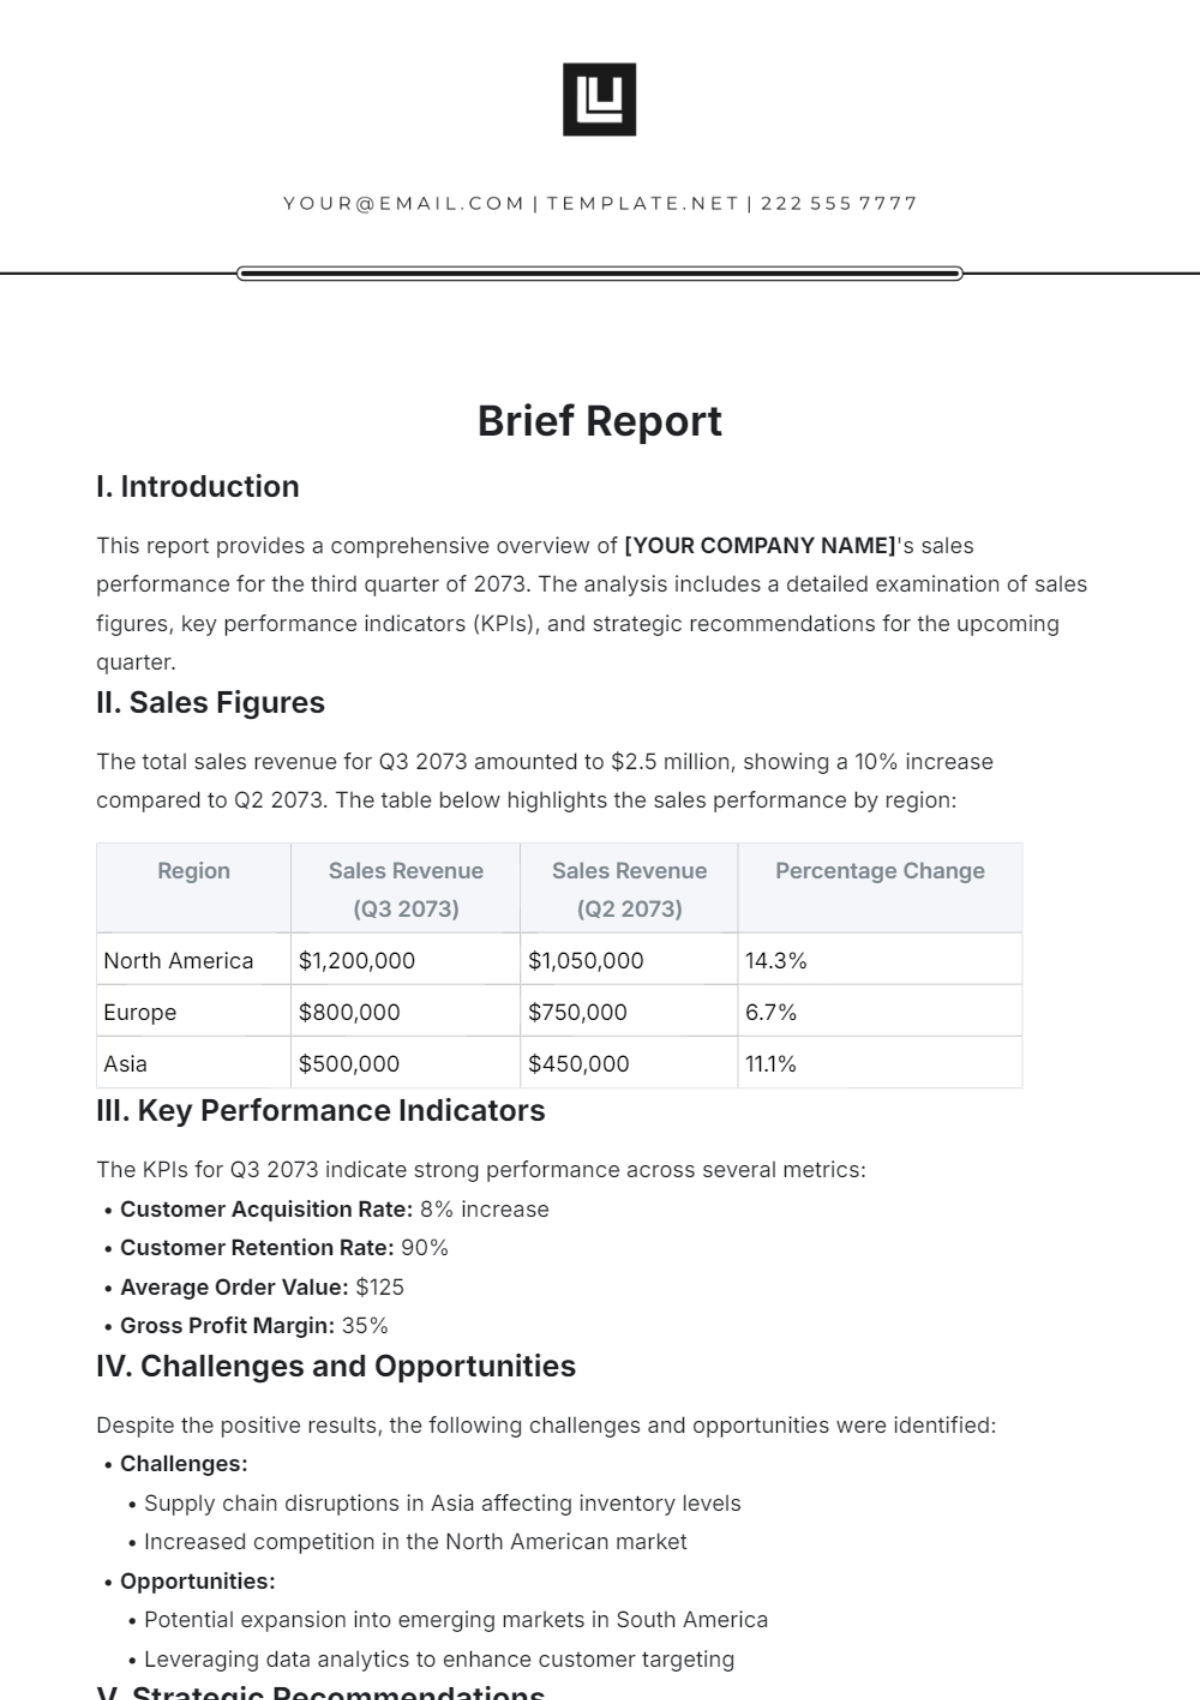
The total sales revenue for Q3 2073 amounted to $2.5 million, showing a 10% increase compared to Q2 2073. The table below highlights the sales performance by region:
Region | Sales Revenue (Q3 2073) | Sales Revenue (Q2 2073) | Percentage Change |
|---|
North America | $1,200,000 | $1,050,000 | 14.3% |
Europe | $800,000 | $750,000 | 6.7% |
Asia | $500,000 | $450,000 | 11.1% |
III. Key Performance Indicators
The KPIs for Q3 2073 indicate strong performance across several metrics:
Customer Acquisition Rate: 8% increase
Customer Retention Rate: 90%
Average Order Value: $125
Gross Profit Margin: 35%
IV. Challenges and Opportunities
Despite the positive results, the following challenges and opportunities were identified:
V. Strategic Recommendations
Based on the analysis, the following strategic recommendations are proposed:
Enhance supply chain resilience by diversifying supplier base.
Increase marketing spend in competitive regions to secure market share.
Explore partnerships in South America for market entry.
Invest in advanced data analytics tools to improve customer insights.
VI. Conclusion
Q3 2073 has been a successful quarter with notable improvements in sales performance and KPIs. By addressing the challenges and capitalizing on the identified opportunities, the company is well-positioned for continued growth in the upcoming quarter.
Brief Templates @ Template.net
