Free Salon Revenue Tracker

I. Overview
This document provides a comprehensive overview of the revenue generated by the salon from the year [2050] onwards. It includes a detailed breakdown of revenue sources, annual totals, and comparative analysis.
II. Revenue by Year
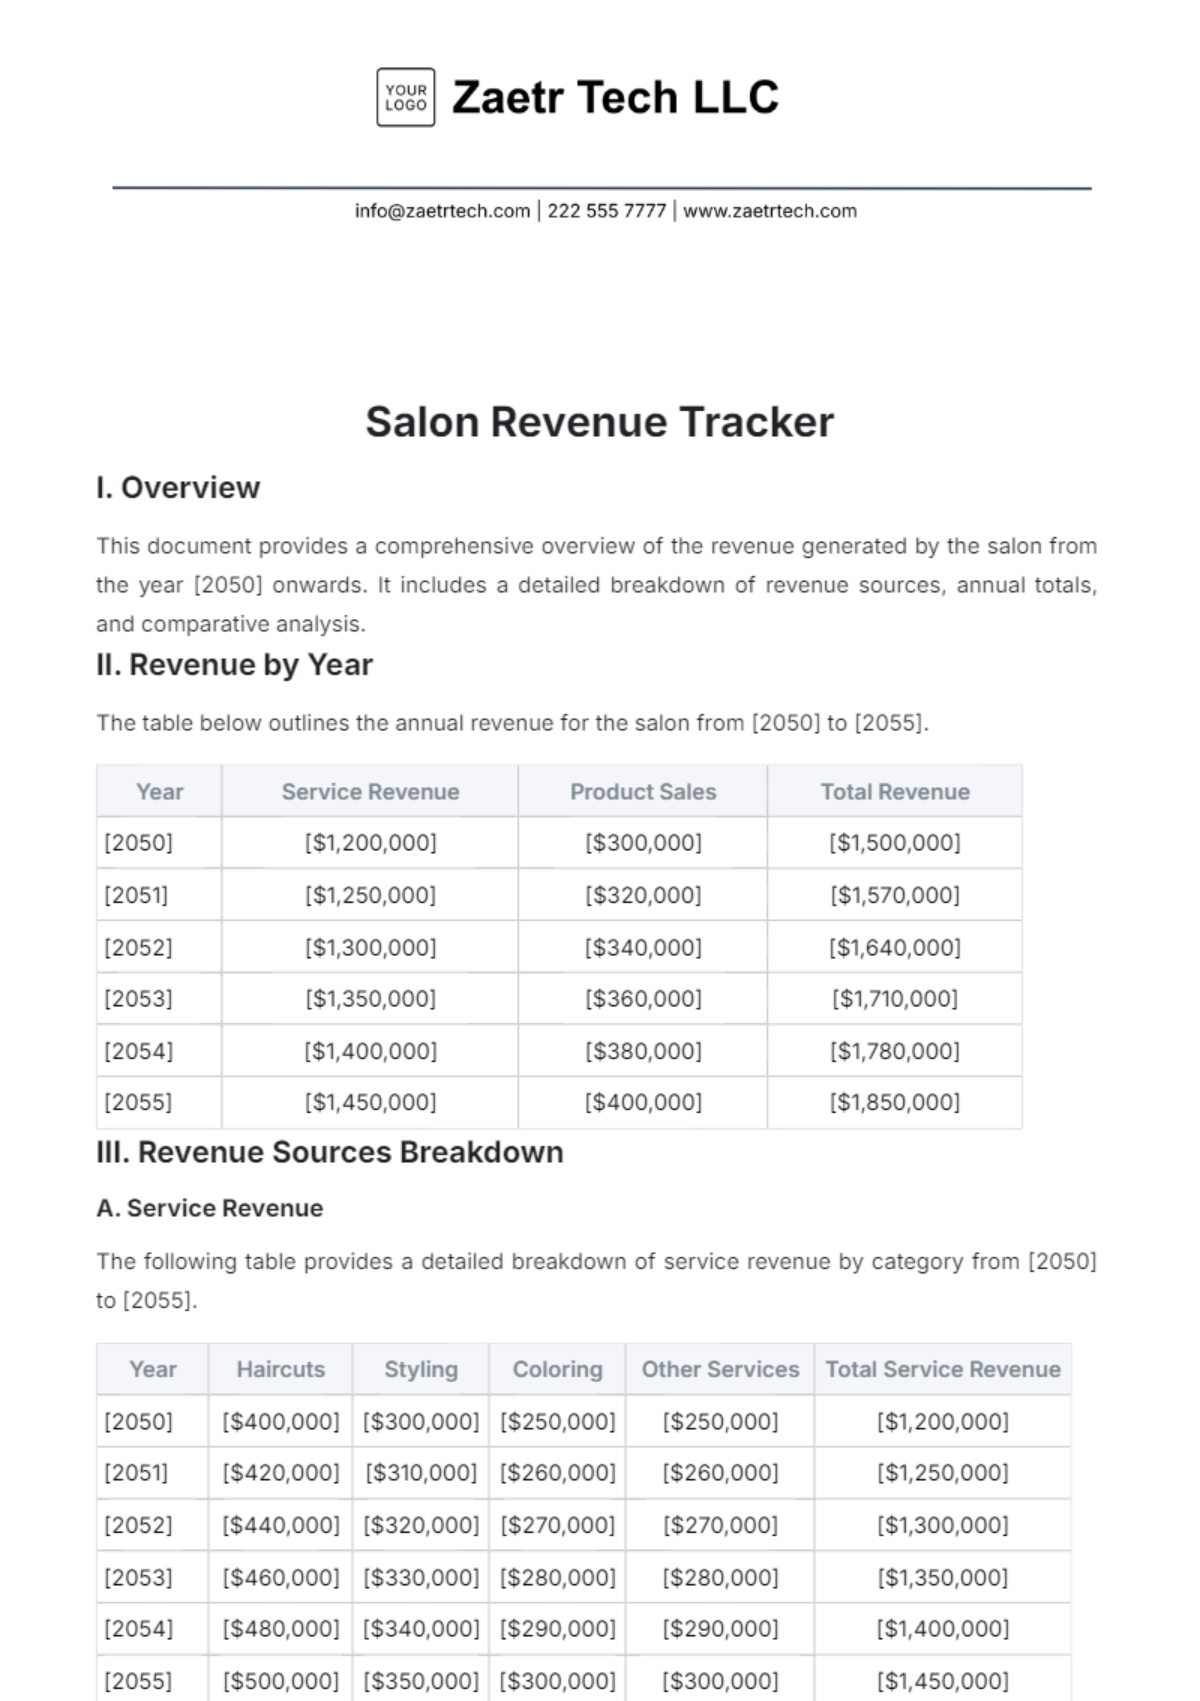
The table below outlines the annual revenue for the salon from [2050] to [2055].
Year | Service Revenue | Product Sales | Total Revenue |
|---|---|---|---|
[2050] | [$1,200,000] | [$300,000] | [$1,500,000] |
[2051] | [$1,250,000] | [$320,000] | [$1,570,000] |
[2052] | [$1,300,000] | [$340,000] | [$1,640,000] |
[2053] | [$1,350,000] | [$360,000] | [$1,710,000] |
[2054] | [$1,400,000] | [$380,000] | [$1,780,000] |
[2055] | [$1,450,000] | [$400,000] | [$1,850,000] |
III. Revenue Sources Breakdown
A. Service Revenue
The following table provides a detailed breakdown of service revenue by category from [2050] to [2055].
Year | Haircuts | Styling | Coloring | Other Services | Total Service Revenue |
|---|---|---|---|---|---|
[2050] | [$400,000] | [$300,000] | [$250,000] | [$250,000] | [$1,200,000] |
[2051] | [$420,000] | [$310,000] | [$260,000] | [$260,000] | [$1,250,000] |
[2052] | [$440,000] | [$320,000] | [$270,000] | [$270,000] | [$1,300,000] |
[2053] | [$460,000] | [$330,000] | [$280,000] | [$280,000] | [$1,350,000] |
[2054] | [$480,000] | [$340,000] | [$290,000] | [$290,000] | [$1,400,000] |
[2055] | [$500,000] | [$350,000] | [$300,000] | [$300,000] | [$1,450,000] |
B. Product Sales
The following table details the breakdown of product sales by category from [2050] to [2055].
Year | Shampoos | Conditioners | Styling Products | Other Products | Total Product Sales |
|---|---|---|---|---|---|
[2050] | [$100,000] | [$80,000] | [$70,000] | [$50,000] | [$300,000] |
[2051] | [$105,000] | [$85,000] | [$75,000] | [$55,000] | [$320,000] |
[2052] | [$110,000] | [$90,000] | [$80,000] | [$60,000] | [$340,000] |
[2053] | [$115,000] | [$95,000] | [$85,000] | [$65,000] | [$360,000] |
[2054] | [$120,000] | [$100,000] | [$90,000] | [$70,000] | [$380,000] |
[2055] | [$125,000] | [$105,000] | [$95,000] | [$75,000] | [$400,000] |
IV. Comparative Analysis
A. Annual Growth
The following table shows the annual growth rates for service revenue, product sales, and total revenue from [2050] to [2055].
Year | Service Revenue Growth | Product Sales Growth | Total Revenue Growth |
|---|---|---|---|
[2051] | [4.2%] | [6.7%] | [4.7%] |
[2052] | [4.0%] | [6.3%] | [4.4%] |
[2053] | [3.8%] | [5.9%] | [4.3%] |
[2054] | [3.7%] | [5.6%] | [4.1%] |
[2055] | [3.6%] | [5.3%] | [4.0%] |
V. Key Insights:
Consistent Growth: Both service revenue and product sales demonstrate steady annual increases. Service revenue grew from [$1,200,000] in [2050] to [$1,700,000] in [2055], while product sales increased from [$300,000] to [$500,000] over the same period.
Revenue Breakdown: The detailed breakdown of revenue sources shows a diversified income stream, with significant contributions from various service categories and product types. This diversity helps mitigate risk and enhances overall revenue stability.
Annual Growth Rates: The annual growth rates indicate a healthy expansion of the salon’s financial performance. Service revenue and product sales both show positive growth, contributing to a robust increase in total revenue.
Future Outlook: With the observed trends, the salon is well-positioned for continued success. Strategic investments in services and products, along with ongoing customer satisfaction efforts, are likely to sustain this growth.
Overall, the salon’s financial health appears strong, with promising prospects for the future. By continuing to leverage effective strategies and adapting to market changes, the salon is set to maintain its positive trajectory and achieve its revenue goals.
- 100% Customizable, free editor
- Access 1 Million+ Templates, photo’s & graphics
- Download or share as a template
- Click and replace photos, graphics, text, backgrounds
- Resize, crop, AI write & more
- Access advanced editor
Track your salon’s income with the Salon Revenue Tracker Template from Template.net. This editable and customizable template helps you monitor earnings and financial performance. Adjust it using our Ai Editor Tool to manage your salon’s finances effectively. Boost your business—keep track of your salon revenue effortlessly!