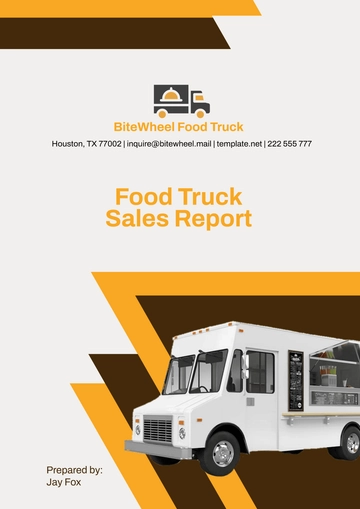
Free Food Truck Sales Report
I. Summary of Sales
The food truck industry has exhibited significant growth in recent years, reflecting changing consumer preferences and a shift towards mobile dining experiences. [Your Company Name] has experienced a steady increase in sales, driven by various factors such as menu innovation, strategic location choices, and effective marketing campaigns. This report provides a detailed overview of the comprehensive sales data collected over the past quarter, highlighting key performance indicators that illustrate our growth trajectory and operational successes. The following sections will delve into our quarterly performance and year-to-date comparisons, offering insights into our ongoing success in the competitive food truck market.
A. Quarterly Performance
The quarterly performance showcases the total revenue, average daily sales, and the number of items sold:
Month | Total Revenue ($) | Average Daily Sales ($) | Items Sold |
|---|---|---|---|
January | 15,000 | 500 | 3,000 |
February | 18,000 | 600 | 3,500 |
March | 20,000 | 700 | 4,000 |
B. Year-to-Date Summary
Comparing the year-to-date (YTD) performance with the previous year reveals an upward trend in sales.
Total Revenue increase by 15%
Average Daily Sales increase by 10%
Total Items Sold increase by 12%
II. Product Performance
A. Top-Selling Items
Analyzing the sales data, we identify the top-selling items of the quarter. These items contributed significantly to the overall revenue:
Item | Quantity Sold | Total Revenue ($) |
|---|---|---|
Burger | 1,500 | 7,500 |
Taco | 2,000 | 6,000 |
Pizza | 1,200 | 4,800 |
B. Seasonal Items Performance
Seasonal items showed considerable performance during their respective periods. Their success is attributed to targeted marketing and seasonal promotions.
Winter Special Soup: Increased sales by 20% during January
Valentine's Day Cupcakes: High demand in February with sales tripling
III. Customer Demographics
Understanding our customer demographics helps in tailoring our marketing strategies and menu offerings. Here is a detailed breakdown of the customer base for the quarter:
A. Age Groups
The majority of our customers fall within the following age groups:
Age Group | Percentage (%) |
|---|---|
18-25 | 40% |
26-35 | 35% |
36-50 | 20% |
50+ | 5% |
B. Location-Based Customer Analysis
The food truck operates in multiple locations. The customer turnout varies based on the location as indicated below:
Downtown: Highest customer turnout with 50%
Suburbs: Moderate turnout with 30%
Events and Festivals: 20% increase in customer base
IV. Recommendations
Based on the sales report, several recommendations have been made to further enhance performance:
A. Menu Optimization
Focus on high-selling items and introduce new items based on customer preferences.
Continue promoting top-selling items
Introduce seasonal items frequently
B. Marketing Strategies
Implement targeted marketing strategies to attract more customers from identified demographics.
Utilize social media platforms to reach younger age groups
Offer loyalty programs to retain existing customers
C. Location-Based Expansion
Consider expanding to new high-traffic locations to increase customer base.
Identify potential high-traffic areas
Evaluate the feasibility of operating in new locations
[Your Company Name] has demonstrated remarkable growth over the past quarter, positioning itself strongly within the competitive food truck market. The positive trends in revenue, average daily sales, and total items sold reflect our commitment to quality service and customer satisfaction. Moving forward, we aim to capitalize on these successes by enhancing our menu offerings and expanding our outreach efforts, ensuring continued growth and engagement with our valued customers. Thank you for your support and partnership.
- 100% Customizable, free editor
- Access 1 Million+ Templates, photo’s & graphics
- Download or share as a template
- Click and replace photos, graphics, text, backgrounds
- Resize, crop, AI write & more
- Access advanced editor
Track sales performance with the Food Truck Sales Report Template from Template.net. This editable and customizable document offers a structured format for recording daily or weekly sales, revenue, and trends. Fully editable in our Ai Editor Tool, it helps you analyze your food truck’s financial performance.
You may also like
- Sales Report
- Daily Report
- Project Report
- Business Report
- Weekly Report
- Incident Report
- Annual Report
- Report Layout
- Report Design
- Progress Report
- Marketing Report
- Company Report
- Monthly Report
- Audit Report
- Status Report
- School Report
- Reports Hr
- Management Report
- Project Status Report
- Handover Report
- Health And Safety Report
- Restaurant Report
- Construction Report
- Research Report
- Evaluation Report
- Investigation Report
- Employee Report
- Advertising Report
- Weekly Status Report
- Project Management Report
- Finance Report
- Service Report
- Technical Report
- Meeting Report
- Quarterly Report
- Inspection Report
- Medical Report
- Test Report
- Summary Report
- Inventory Report
- Valuation Report
- Operations Report
- Payroll Report
- Training Report
- Job Report
- Case Report
- Performance Report
- Board Report
- Internal Audit Report
- Student Report
- Monthly Management Report
- Small Business Report
- Accident Report
- Call Center Report
- Activity Report
- IT and Software Report
- Internship Report
- Visit Report
- Product Report
- Book Report
- Property Report
- Recruitment Report
- University Report
- Event Report
- SEO Report
- Conference Report
- Narrative Report
- Nursing Home Report
- Preschool Report
- Call Report
- Customer Report
- Employee Incident Report
- Accomplishment Report
- Social Media Report
- Work From Home Report
- Security Report
- Damage Report
- Quality Report
- Internal Report
- Nurse Report
- Real Estate Report
- Hotel Report
- Equipment Report
- Credit Report
- Field Report
- Non Profit Report
- Maintenance Report
- News Report
- Survey Report
- Executive Report
- Law Firm Report
- Advertising Agency Report
- Interior Design Report
- Travel Agency Report
- Stock Report
- Salon Report
- Bug Report
- Workplace Report
- Action Report
- Investor Report
- Cleaning Services Report
- Consulting Report
- Freelancer Report
- Site Visit Report
- Trip Report
- Classroom Observation Report
- Vehicle Report
- Final Report
- Software Report


