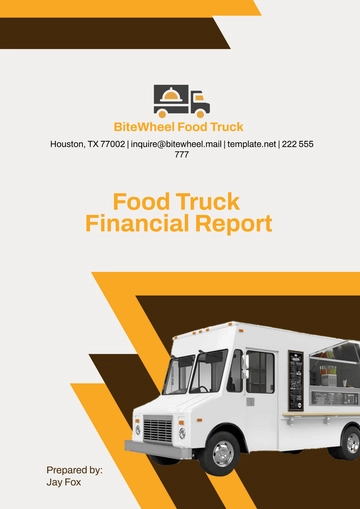
Free Food Truck Financial Report
I. Executive Summary
A. Overview
The purpose of this Food Truck Financial Report is to provide a detailed financial analysis of the operations of [Your Company Name] Food Truck for the year 2050. This report covers key financial data including revenues, expenses, profit margins, cash flows, and a year-over-year comparison with 2049. It also includes projections for 2051 and suggestions for financial improvements for the future.
In 2050, [Your Company Name] Food Truck operated across [5] key urban locations, offering a variety of gourmet meals that catered to diverse tastes. With the increasing demand for convenient and quality food options, our food truck has seen a significant rise in both customer volume and sales revenue. This growth reflects not only our culinary offerings but also the effectiveness of our marketing strategies and operational efficiencies.
B. Key Financial Highlights
Total Revenue: The food truck generated a total revenue of $[1,250,000], representing a robust [10%] increase from the previous year, 2049. This growth signifies not just an increase in sales but also the successful implementation of our business strategies.
Net Profit: The net profit for 20510 stood at $[300,000], reflecting a commendable [15%] improvement from 2050. This increase in profitability can be attributed to better cost management and increased operational efficiency.
Cost of Goods Sold (COGS): COGS for the year amounted to $[600,000], accounting for [48%] of the total revenue. This percentage indicates our commitment to maintaining a healthy balance between product quality and cost efficiency.
Operating Expenses: Operating expenses were $[350,000], comprising [28%] of the total revenue. This ratio shows our diligence in controlling overhead costs while investing in the necessary resources to improve service delivery.
Cash Flow: Cash flow from operations stood at $[450,000], representing a [12%] year-over-year improvement, which demonstrates our ability to generate positive cash flows through our operational activities.
These figures collectively demonstrate our positive financial performance and sound operational management during the fiscal year. It is essential to analyze these numbers further to identify strengths and areas for improvement.
II. Revenue Analysis
A. Total Revenue Breakdown
In 2050, [Your Company Name] Food Truck achieved total revenues of $[1,250,000]. This section provides a detailed breakdown of revenue sources and an analysis of their contributions to the overall financial performance.
Daily Sales Revenue
The food truck operated [300] days out of the year, generating an average daily sales revenue of $[4,167]. This average reflects the strong demand for our products, particularly during peak hours and events. The primary sales came from gourmet meals, desserts, and beverages. Below is a detailed breakdown:Gourmet Meals: $[750,000] (60% of total revenue). The success of this category was largely due to our commitment to high-quality ingredients and innovative recipes that appealed to a wide customer base.
Desserts: $[250,000] (20% of total revenue). Our desserts have become a favorite, particularly among families and individuals looking for a sweet treat, driving significant sales throughout the year.
Beverages: $[200,000] (16% of total revenue). The beverage menu, which includes both alcoholic and non-alcoholic options, has contributed substantially to overall sales, particularly during hot summer months.
Other: $[50,000] (4% of total revenue). This category includes miscellaneous items and promotional offers that have resonated well with our customers.
The most popular product category was gourmet meals, which saw a [12%] increase from 2049, driven by the launch of new menu items and a successful marketing campaign that showcased our offerings.
Catering and Special Events
Catering services for corporate events and private parties contributed an additional $[150,000] (12% of total revenue). The food truck participated in [25] catered events in 2050, compared to [20] events in 2050. This [25%] increase is attributed to expanded partnerships with local businesses and event organizers, reflecting our growing reputation in the catering space. We have also noticed a trend towards more large-scale events, which further boosts our catering sales.
B. Revenue Growth Trends
The food truck experienced a [10%] year-over-year increase in revenue, rising from $[1,136,364] in 2049 to $[1,250,000] in 2050. This growth is primarily due to:
Expanded Operating Locations: The addition of [2] new high-traffic locations, strategically chosen based on customer demographics and foot traffic data, boosted customer footfall significantly.
Improved Marketing Strategies: Targeted social media campaigns, loyalty programs, and collaborations with local influencers and food bloggers helped increase brand visibility and attract new customers. Our marketing budget was effectively utilized to engage with our audience across multiple platforms, ensuring that our brand remained top-of-mind.
Menu Innovation: The introduction of plant-based gourmet options catered to the growing demand for sustainable and healthy meals, attracting new customers who prioritize health and environmental sustainability in their dining choices. Feedback from our customers indicated a strong desire for more diverse and healthy options, which we were able to fulfill.
III. Cost Analysis
A. Cost of Goods Sold (COGS)
COGS represents the direct costs incurred in producing the food truck's offerings. For 2050, the COGS amounted to $[600,000], making up [48%] of the total revenue. This section provides a breakdown of the main cost components, allowing for a deeper understanding of our spending habits.
Raw Ingredients
The cost of raw ingredients was $[500,000], accounting for [83.3%] of the COGS. This includes expenses for:Protein sources (e.g., meat, plant-based alternatives): $[200,000]. The sourcing of high-quality protein was essential, and we established relationships with local farms to ensure fresh delivery.
Vegetables and fruits: $[150,000]. Seasonal purchasing strategies helped reduce costs and ensure quality, while organic certifications attracted health-conscious consumers.
Grains and starches: $[100,000]. This category includes specialty breads and grains that are crucial for our menu diversity.
Spices, oils, and other ingredients: $[50,000]. The quality of these ingredients is vital for maintaining our flavor profile and culinary reputation.
Packaging Materials
Packaging costs amounted to $[50,000], a [5%] increase from 2050 due to the switch to eco-friendly and biodegradable packaging materials. While these materials are more expensive, this decision aligns with the company’s sustainability goals and has been positively received by our environmentally conscious customers.Labor Costs (Preparation)
Labor costs directly related to food preparation accounted for $[50,000], covering wages for kitchen staff and temporary event workers. The recruitment of skilled chefs has allowed us to maintain high standards in food quality and preparation.
B. Operating Expenses
Operating expenses include the costs necessary to run the food truck's day-to-day operations, excluding direct costs like COGS. The total operating expenses for 2050 were $[350,000], detailed below:
Staff Salaries and Wages
In 2050, staff salaries and wages totaled $[200,000], which represents a [7%] increase from the previous year. The rise in wages is due to the hiring of additional staff for catering events and extended operating hours. We also implemented employee training programs to improve service quality.Vehicle Maintenance and Fuel
The food truck required regular maintenance and fuel, with costs totaling $[50,000]. There was a [10%] decrease in fuel costs due to the integration of hybrid electric technology in the food truck. This not only lowered expenses but also appealed to eco-friendly consumers, enhancing our brand image.Marketing and Advertising
Marketing expenses, including social media promotions, printed materials, and event sponsorships, amounted to $[40,000]. This is a [15%] increase from 2050, reflecting the company's strategic focus on expanding brand visibility. Enhanced digital marketing efforts have proven effective in reaching new audiences.Licenses and Permits
Licensing fees, health permits, and location permits amounted to $[30,000] for the year, an expected and consistent cost. These expenses are vital for compliance and ensure that we maintain our operational legitimacy.Insurance
Insurance expenses for vehicle, employee, and business liability amounted to $[30,000], a [3%] increase from 2050 due to rising premiums in the sector. Securing comprehensive insurance coverage is critical to mitigating risks associated with running a mobile food business.
IV. Profitability Analysis
A. Gross Profit
Gross profit is calculated as total revenue minus COGS. For 2050, the gross profit was $[650,000], with a gross profit margin of [52%]. The margin shows a [2%] increase compared to the previous year, driven by higher revenues and cost-efficient sourcing strategies. This improvement indicates that the company is managing its production costs effectively while maximizing revenue.
Gross Profit Margin Improvement
The gross profit margin improved primarily due to optimized supply chain management. A bulk purchasing strategy for high-demand ingredients resulted in lower per-unit costs, allowing us to enhance our profit margins.
B. Operating Profit
Operating profit is derived from gross profit minus operating expenses. In 2050, the operating profit was $[300,000], translating to an operating profit margin of [24%]. This reflects the overall efficiency of our operations and highlights our ability to control costs while expanding revenues.
Efficiency Metrics
The operating profit margin indicates a healthy operational efficiency. Continuous staff training, process optimization, and effective marketing strategies have led to streamlined operations and reduced unnecessary expenses.
C. Net Profit
Net profit is calculated as total revenue minus all expenses, including both COGS and operating expenses. The net profit for [Your Company Name] Food Truck in 2050 was $[300,000], resulting in a net profit margin of [24%]. This increase reflects better financial health compared to the previous year, where the net profit margin was [20%].
Year-over-Year Comparison
Compared to 2049, where the net profit was $[260,000], the improvement in net profit is indicative of successful strategic initiatives and careful financial planning.
V. Cash Flow Analysis
A. Cash Flow from Operations
Cash flow from operations is a key indicator of the food truck's financial health. For 2050, cash flow from operations was $[450,000]. This reflects strong operational performance and the ability to generate cash from core business activities.
Cash Inflows
Cash inflows were driven primarily by sales revenue, catering contracts, and a reduction in accounts receivable due to improved payment terms with customers. This healthy inflow positions [Your Company Name] to invest in growth opportunities.Cash Outflows
Cash outflows included costs for raw materials, operating expenses, and payroll. Strategic cash management ensured that all operational costs were met without compromising cash reserves.
B. Cash Flow Forecast for 2051
Looking ahead, cash flow for 2051 is projected to increase based on expected revenue growth and operational efficiencies. We anticipate cash flow from operations to reach approximately $[550,000] due to:
Increased Revenue: With plans for additional marketing and catering efforts, an increase in daily sales is expected.
Improved Cost Control: Ongoing efforts to streamline expenses and reduce COGS will enhance overall cash flow.
VI. Financial Projections for 2051
A. Revenue Projections
For 2051, [Your Company Name] aims to achieve total revenues of approximately $[1,500,000]. This projection is based on several key factors:
Increased Catering Bookings: With a targeted marketing push, catering revenues are projected to rise by [20%], contributing an estimated $[180,000] in additional revenue.
New Food Truck: The introduction of a second food truck is expected to contribute an additional $[150,000] in sales, capitalizing on the growing demand in nearby urban areas.
B. Cost Projections
COGS is expected to rise by [5%], totaling $[630,000] in 2051, primarily due to inflation and increased ingredient costs. The anticipated costs for raw materials will need careful monitoring to ensure that profit margins remain healthy. However, operating expenses are anticipated to decrease by [3%], resulting in a projected total of $[340,000]. This reduction can be attributed to efficiency improvements in vehicle technology and operational practices.
C. Profit Projections
The projected net profit for 2051 is $[350,000], with a net profit margin of [25%]. This projection reflects continued cost management and revenue growth. By implementing sustainable practices and optimizing our supply chain, we expect to see significant enhancements in our profitability.
VII. Recommendations
A. Cost Control
To further enhance profitability, [Your Company Name] should focus on the following cost control measures:
Explore Sustainable Ingredients: Investigate sustainable ingredient suppliers to lock in lower prices and reduce COGS by [3%]. This move not only supports environmental initiatives but can also attract customers who prioritize sustainability.
Invest in Solar-Powered Vehicles: Transitioning to solar-powered food trucks could reduce fuel costs by up to [20%]. Although the initial investment is higher, the long-term savings on fuel and maintenance make this an attractive option for the future.
B. Revenue Growth Strategies
To maintain a competitive edge and drive revenue, [Your Company Name] should consider:
Expand to Additional Locations: Adding [3] more food trucks in high-traffic areas could increase revenue by [25%]. Identifying areas with limited food options could present new opportunities for customer acquisition.
Loyalty Programs: Implementing a digital loyalty program can boost customer retention and encourage repeat purchases. This program can offer rewards for frequent buyers and promote special deals for loyal customers.
C. Technology Adoption
Investing in technology can significantly enhance operational efficiency and customer experience. Recommended initiatives include:
Mobile Ordering and Payment Systems: Integrating mobile apps for ordering and payments can streamline customer interactions, reduce wait times, and improve order accuracy.
Inventory Management Software: Utilizing software to manage inventory can optimize ingredient usage, reduce waste, and ensure that popular items are always in stock.
VIII. Conclusion
The 2050 financial year was highly successful for [Your Company Name] Food Truck, with notable growth in revenue, profitability, and cash flow. The strategies implemented throughout the year have laid a solid foundation for future expansion. Looking forward, the business is well-positioned for continued growth in 2051 through strategic investments in additional food trucks and marketing initiatives. By focusing on cost control, leveraging technology, and exploring new revenue streams, the food truck is set to achieve sustainable growth while maintaining high profitability.
In summary, the financial performance of [Your Company Name] Food Truck in 2050 showcases our resilience and adaptability in a competitive market. The ongoing commitment to quality, customer service, and operational efficiency will undoubtedly lead to a prosperous 2051 and beyond.
- 100% Customizable, free editor
- Access 1 Million+ Templates, photo’s & graphics
- Download or share as a template
- Click and replace photos, graphics, text, backgrounds
- Resize, crop, AI write & more
- Access advanced editor
Analyze your financial performance with the Food Truck Financial Report Template from Template.net. This editable and customizable template allows you to summarize income, expenses, and profits effectively. Personalize it using our Ai Editor Tool to provide insightful financial overviews for your food truck business.
You may also like
- Sales Report
- Daily Report
- Project Report
- Business Report
- Weekly Report
- Incident Report
- Annual Report
- Report Layout
- Report Design
- Progress Report
- Marketing Report
- Company Report
- Monthly Report
- Audit Report
- Status Report
- School Report
- Reports Hr
- Management Report
- Project Status Report
- Handover Report
- Health And Safety Report
- Restaurant Report
- Construction Report
- Research Report
- Evaluation Report
- Investigation Report
- Employee Report
- Advertising Report
- Weekly Status Report
- Project Management Report
- Finance Report
- Service Report
- Technical Report
- Meeting Report
- Quarterly Report
- Inspection Report
- Medical Report
- Test Report
- Summary Report
- Inventory Report
- Valuation Report
- Operations Report
- Payroll Report
- Training Report
- Job Report
- Case Report
- Performance Report
- Board Report
- Internal Audit Report
- Student Report
- Monthly Management Report
- Small Business Report
- Accident Report
- Call Center Report
- Activity Report
- IT and Software Report
- Internship Report
- Visit Report
- Product Report
- Book Report
- Property Report
- Recruitment Report
- University Report
- Event Report
- SEO Report
- Conference Report
- Narrative Report
- Nursing Home Report
- Preschool Report
- Call Report
- Customer Report
- Employee Incident Report
- Accomplishment Report
- Social Media Report
- Work From Home Report
- Security Report
- Damage Report
- Quality Report
- Internal Report
- Nurse Report
- Real Estate Report
- Hotel Report
- Equipment Report
- Credit Report
- Field Report
- Non Profit Report
- Maintenance Report
- News Report
- Survey Report
- Executive Report
- Law Firm Report
- Advertising Agency Report
- Interior Design Report
- Travel Agency Report
- Stock Report
- Salon Report
- Bug Report
- Workplace Report
- Action Report
- Investor Report
- Cleaning Services Report
- Consulting Report
- Freelancer Report
- Site Visit Report
- Trip Report
- Classroom Observation Report
- Vehicle Report
- Final Report
- Software Report
