Free Blank Customer Profile Report
Prepared by: [Your Name]
Company: [Your Company Name]
Date: [Date]
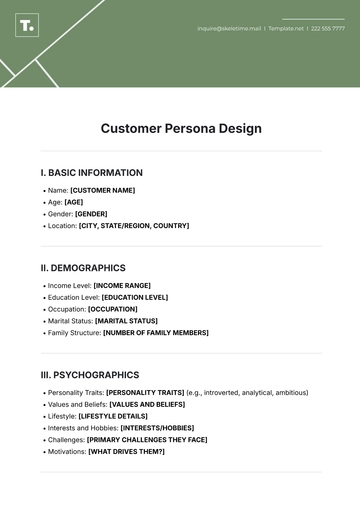
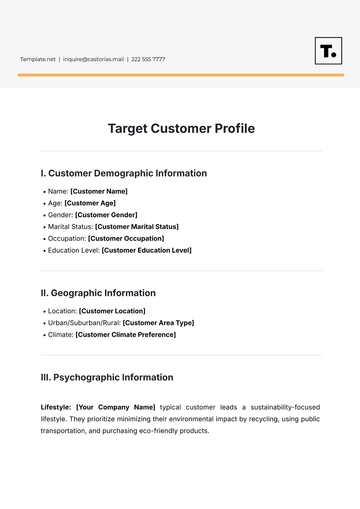
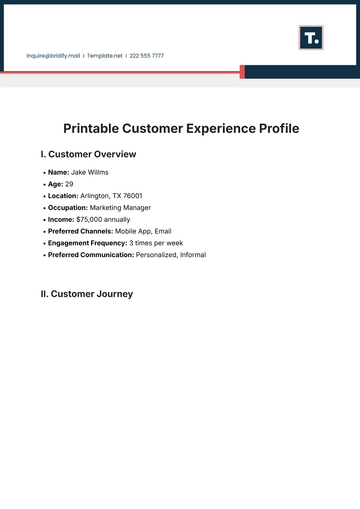
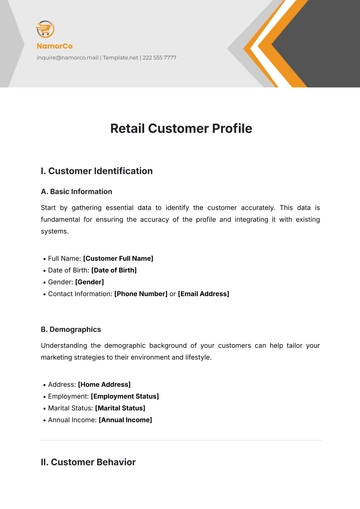
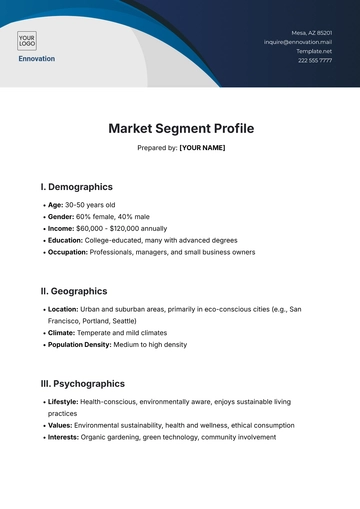
I. Demographic Information
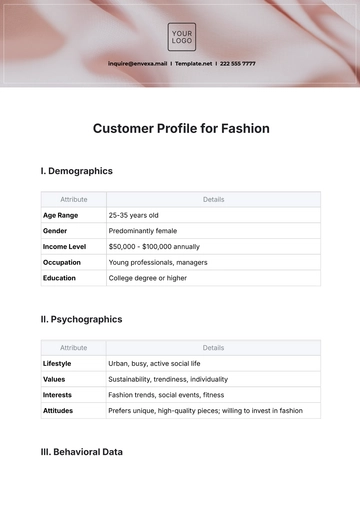
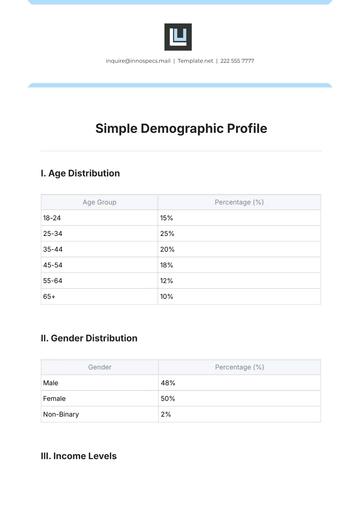
A. Age
Identifies the age group of customers (e.g., 25-34 years old).
This age group often values tech-savvy products and sustainability.
They may prefer brands that promote environmental responsibility.
B. Gender
Specifies male, female, or other (e.g., 60% female, 35% male, 5% non-binary).
This understanding helps tailor marketing messages that resonate with gender-specific preferences.
C. Location
City, state, and country (e.g., New York, NY, USA).
Customers in urban areas may have different needs than those in rural settings (e.g., preferences for convenience products and services).
D. Income Level
Categories include Low ($20,000 - $35,000), Medium ($36,000 - $75,000), High ($76,000 and above).
Higher-income brackets may be more inclined to purchase premium products, influencing pricing strategies.
E. Education Level
Highest degree achieved (e.g., 30% hold a bachelor’s degree, 25% have a master’s degree).
Higher education levels often correlate with product knowledge and brand loyalty, suggesting a need for informative marketing materials.
II. Behavioral Data
A. Purchase History
Highlights previous purchases (e.g., regular purchases include fitness gear; occasional purchases are premium yoga mats during seasonal sales).
This information can guide inventory management and promotional timing.
B. Frequency of Purchases
Customers buy 3-5 times per month, indicating strong brand loyalty.
High-frequency purchasers can be targeted with loyalty programs or subscription offers to increase retention.
C. Average Spend
The average spend per transaction is $45.
Regular buyers tend to purchase more affordable products; occasional buyers spend $100+ on premium items.
Tailored promotions could encourage higher spending from frequent buyers.
D. Regular Purchases
Details frequency and types of products (e.g., monthly subscriptions for wellness products show commitment to health).
E. Occasional Big Purchases
Specific times of the year or product types (e.g., increased purchases during the New Year for fitness resolutions).
Targeted marketing during these times can boost sales.
III. Preferences
A. Product Preferences
Customers prefer eco-friendly products (e.g., 70% express a strong preference for sustainable brands).
Personalized marketing that highlights these features can enhance engagement.
B. Brand Affiliation
40% show loyalty to Brand A; 30% to Brand B.
Analysis of brand preferences can inform partnership opportunities and competitive positioning.
C. Communication Preferences
50% prefer email updates; 30% prefer SMS notifications.
This information helps optimize engagement strategies by targeting preferred channels.
IV. Customer Journey
A. Discovery
45% discovered the brand via social media ads; and 30% through word-of-mouth referrals.
Understanding discovery channels helps allocate marketing budgets effectively.
B. Decision Making
Customers consider product reviews and peer recommendations critical before purchasing.
This insight can inform the focus on user-generated content and testimonials.
C. Purchase and Delivery
90% report satisfaction with the ease of online checkout; 80% are happy with delivery times.
Continuous monitoring of delivery services can further enhance the customer experience.
D. Post-Purchase Experience
70% express satisfaction with customer service interactions.
Regular surveys can capture feedback and identify areas for improvement in the post-purchase journey.
V. Additional Notes
Unique Circumstances: Customers in the New York area have expressed specific interests in urban gardening products due to space constraints. Tailoring product offerings and marketing towards this niche can boost sales.
Customer Feedback: Feedback collected through surveys indicates a demand for more eco-friendly packaging options. Implementing this can improve customer satisfaction and loyalty.
VI. Conclusion
The comprehensive overview indicates that customers aged 25-34, particularly females, show a strong preference for eco-friendly products and have demonstrated loyalty through regular purchases. Growth areas include enhancing product offerings that align with sustainability trends and optimizing communication strategies through preferred channels. Recommendations for future engagement strategies include:
Targeted Marketing Campaigns: Utilize social media and email marketing to reach the identified demographic effectively, highlighting eco-friendly product features.
Loyalty Programs: Introduce incentives for frequent purchasers to encourage repeat business and increase average spending.
Feedback Implementation: Regularly solicit and incorporate customer feedback to enhance the overall experience and product offerings.
By aligning business strategies with customer expectations and preferences, the company can foster deeper relationships and drive sustainable growth.
- 100% Customizable, free editor
- Access 1 Million+ Templates, photo’s & graphics
- Download or share as a template
- Click and replace photos, graphics, text, backgrounds
- Resize, crop, AI write & more
- Access advanced editor
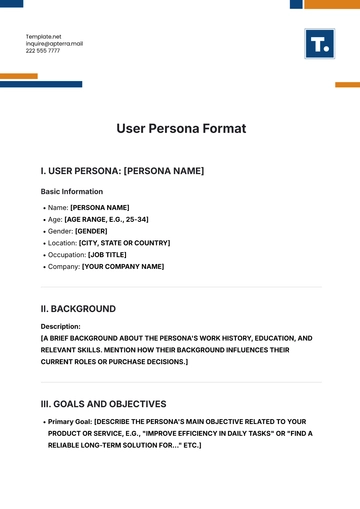
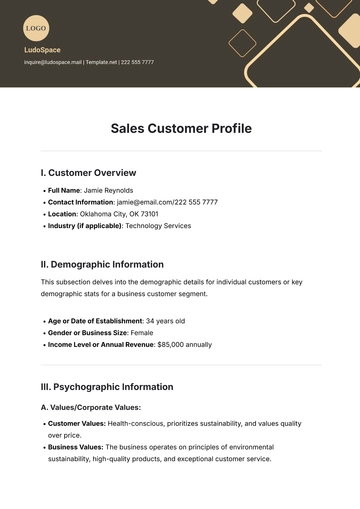
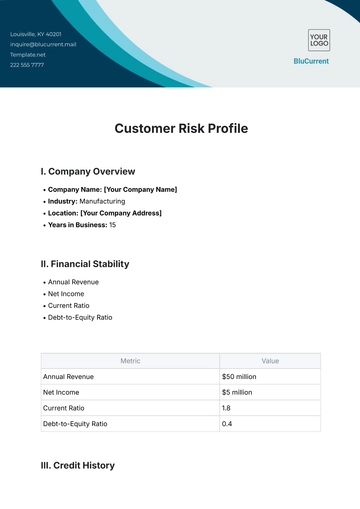
Get organized with the Blank Customer Profile Report Template from Template.net! This fully editable and customizable template helps you create detailed profiles for your customers, ensuring all key information is at your fingertips. Editable in our Ai Editor Tool, it’s designed to save you time while maintaining a professional layout. Perfect for businesses seeking a streamlined way to manage customer data.
