Free Business Financial Outline Forecasting 5-Year Plan
1. Executive Summary
Business Overview: Briefly describe the business, including industry, target market, and key products or services.
Objectives: Outline high-level financial objectives for the 5 years, such as revenue growth, profitability targets, or expansion goals.
2. Assumptions
Economic Factors: Describe macroeconomic trends that could impact the business (e.g., inflation rates, interest rates, market growth rates).
Industry Trends: Include relevant industry forecasts, regulatory factors, or technological trends.
Pricing and Cost Assumptions: Specify pricing models, expected changes in cost of goods, and any anticipated pricing adjustments.
Customer Growth Assumptions: Detail customer acquisition and retention assumptions, growth rates, and seasonality.
3. Revenue Forecast
Yearly Revenue Projections: Break down revenue sources (e.g., product sales, services, licensing) for each year.
Customer Segments: Define expected revenue by customer segment if applicable.
Sales Volume: Include projected sales volume, average sale value, and any forecasted growth rate per product or service.
Example Table:
Year | Revenue Source | Projected Sales Volume | Average Sale Value | Total Revenue |
|---|---|---|---|---|
1 | Product A | X Units | $X.XX | $XX, XXX |
2 | Product B | X Units | $X.XX | $XX , XXX |
etc. |
4. Cost Forecast
Direct Costs (COGS): Include direct material and labor costs associated with each product or service.
Operating Expenses:
Fixed Costs: Rent, utilities, salaries, insurance.
Variable Costs: Marketing, research and development, travel.
Other Costs: Any additional expenses (e.g., professional fees, IT, maintenance).
Example Table:
Year | Cost Category | Fixed Costs | Variable Costs | Total Costs |
|---|---|---|---|---|
1 | Direct Costs | $X.XX | $X.XX | $XX, XXX |
etc. | Operating Costs |
5. Profit and Loss Projection
Gross Profit: Projected revenue minus direct costs (COGS).
Operating Income: Gross profit minus operating expenses.
Net Profit: Operating income minus taxes and interest.
Example Table:
Year | Revenue | COGS | Gross Profit | Operating Expenses | Net Profit |
|---|---|---|---|---|---|
1 | $XX, XXX | $X.XX | $XX, XXX | $XX, XXX | $XX, XXX |
6. Cash Flow Forecast
Cash Inflows: Sources of cash, such as sales, loans, or investments.
Cash Outflows: Expenses, loan payments, taxes, and other outflows.
Net Cash Flow: Cash inflows minus cash outflows for each year.
Ending Cash Balance: Cumulative cash flow over the forecast period.
Example Table:
Year | Cash Inflows | Cash Outflows | Net Cash Flow | Ending Cash Balance |
|---|---|---|---|---|
1 | $XX, XXX | $XX, XXX | $XX, XXX | $XX, XXX |
7. Balance Sheet Forecast
Assets: Include current assets (cash, accounts receivable) and non-current assets (property, equipment).
Liabilities: Short-term liabilities (accounts payable, short-term loans) and long-term liabilities (long-term loans).
Equity: Retained earnings, owner’s equity, or shareholder’s equity.
Example Table:
Year | Assets | Liabilities | Equity | Total Liabilities & Equity |
|---|---|---|---|---|
1 | $XX, XXX | $XX, XXX | $XX, XXX | $XX, XXX |
8. Break-Even Analysis
Break-Even Point: Determine the sales volume or revenue needed to cover all costs.
The margin of Safety: Forecast the buffer between actual and break-even sales.
9. Key Financial Ratios
Profitability Ratios: Gross profit margin, net profit margin.
Liquidity Ratios: Current ratio, quick ratio.
Efficiency Ratios: Inventory turnover, asset turnover.
Solvency Ratios: Debt-to-equity ratio, interest coverage ratio.
10. Contingency Plans and Risk Analysis
Risk Factors: List potential risks and their financial implications (e.g., supply chain disruptions, market changes).
Mitigation Strategies: Include plans to minimize these risks, such as diversifying suppliers or setting aside a cash reserve.
- 100% Customizable, free editor
- Access 1 Million+ Templates, photo’s & graphics
- Download or share as a template
- Click and replace photos, graphics, text, backgrounds
- Resize, crop, AI write & more
- Access advanced editor
Plan for a financially secure future with this Business Financial Outline Forecasting Template. Editable and customizable in Template.net’s Ai Editor Tool, it’s an excellent tool for financial projections, budgeting, and profit forecasting over the next five years.
You may also like
- One Page Business Plan
- Coffee Shop Business Plan
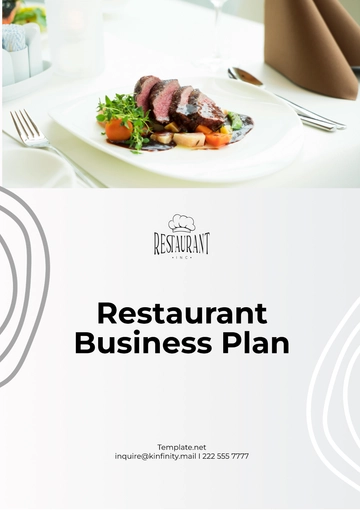
- Restaurant Business Plan
- Food Business Plan
- Real Estate Business Plan
- Executive Summary Business Plan
- Cover Page Business Plan
- Nonprofit Business Plan
- Daycare Business Plan
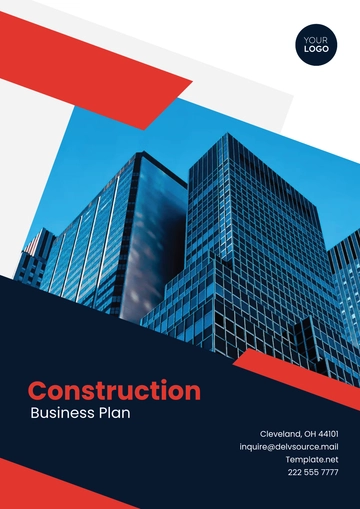
- Construction Business Plan
- Startup Business Plan
- Medical Business Plan
- Bakery Business Plan
- Service Plan
- Hotel Business Plan
- Catering Business Plan
- School Business Plan
- Healthcare Business Plan
- Transportation Plan
- Sports Plan
- Car Wash Business Plan
- Salon Business Plan
- Clothing Business Plan
- Farming Business Plan
- Boutique Plan
