Sample Strategic Gap Analysis
Company Name: [YOUR COMPANY NAME]
Analysis Date: January 1, 2050
Prepared By: Strategic Planning Team
I. Executive Summary
This Strategic Gap Analysis evaluates [YOUR COMPANY NAME]'s current performance against its long-term goal of becoming the industry leader in AI-driven solutions by 2060. The analysis highlights critical gaps in revenue generation, market share, customer satisfaction, and innovation. Detailed root cause assessments and a clear, actionable roadmap are provided to bridge these gaps and accelerate the organization’s progress toward its objectives. Continuous progress tracking and adaptability are recommended to ensure sustainable growth.
II. Current State Analysis
[YOUR COMPANY NAME] is positioned as a key player in the AI solutions industry but faces challenges in scaling operations to meet future demands.
While the current state demonstrates a strong foundation, significant enhancements are required to achieve long-term goals.
III. Desired State
By 2060, [YOUR COMPANY NAME] aims to establish itself as the undisputed leader in AI solutions with the following targets:
Achieving this desired state requires robust strategic initiatives across all organizational dimensions.
IV. Gap Identification
Metric | Current State (2050) | Desired State (2060) | Identified Gap |
|---|
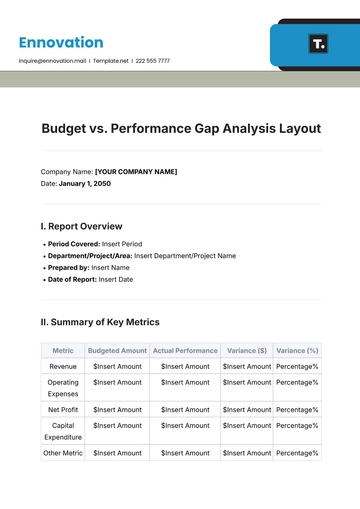
Revenue | $500M | $1B | $500M shortfall |
Market Share | 15% | 30% | 15% increase needed |
Customer Satisfaction | 80% | 95% | 15% improvement needed |
Innovation | 3 patents/year | 10 patents/year | 7 patents/year shortfall |
These gaps reflect challenges in scalability, market penetration, and operational efficiency.
V. Root Cause Analysis
A deep dive into underlying factors reveals:
VI. Action Plan
Objective | Action Steps | Responsible Party | Timeline |
|---|
Increase Revenue | Expand into emerging markets; establish strategic partnerships; optimize pricing models. | Sales & Strategy Teams | 2050-2055 |
Boost Market Share | Launch global branding campaigns; develop localized marketing strategies; invest in competitive intelligence tools. | Marketing Team | 2051-2056 |
Improve CSAT | Implement AI-enhanced customer support; design tailored customer feedback loops; introduce proactive engagement programs. | Customer Success Team | 2050-2054 |
Drive Innovation | Allocate 30% more budget to R&D; establish innovation hubs; recruit top-tier AI researchers and engineers. | R&D and Talent Acquisition Teams | 2050-2057 |
These initiatives are designed to address each gap strategically, ensuring measurable improvements over the next decade.
VII. Metrics and KPIs
Revenue: Achieve quarterly growth of 5% starting Q1 2050.
Market Share: Gain an additional 2% annually through 2056.
Customer Satisfaction: Improve average CSAT score by 1.5% each quarter.
Innovation: File at least 2 additional patents annually, increasing output consistently.
Regular progress reviews will help refine strategies and ensure alignment with overarching objectives.
VIII. Timeline and Milestones
Milestone | Deadline |
|---|
Launch operations in 3 emerging markets | December 2051 |
Deploy AI-driven customer support system | June 2052 |
Reach $750M annual revenue milestone | December 2055 |
Achieve 10 patents filed in a single year | December 2057 |
Each milestone aligns with the strategic roadmap, ensuring steady progress toward the 2060 vision.
IX. Conclusion
[YOUR COMPANY NAME] is well-positioned to leverage its strengths and address current challenges through the proposed strategies. By rigorously monitoring KPIs and maintaining organizational agility, the company can achieve its ambitious 2060 goals and establish itself as a global leader in AI-driven solutions.
Analysis Templates @ Template.net
