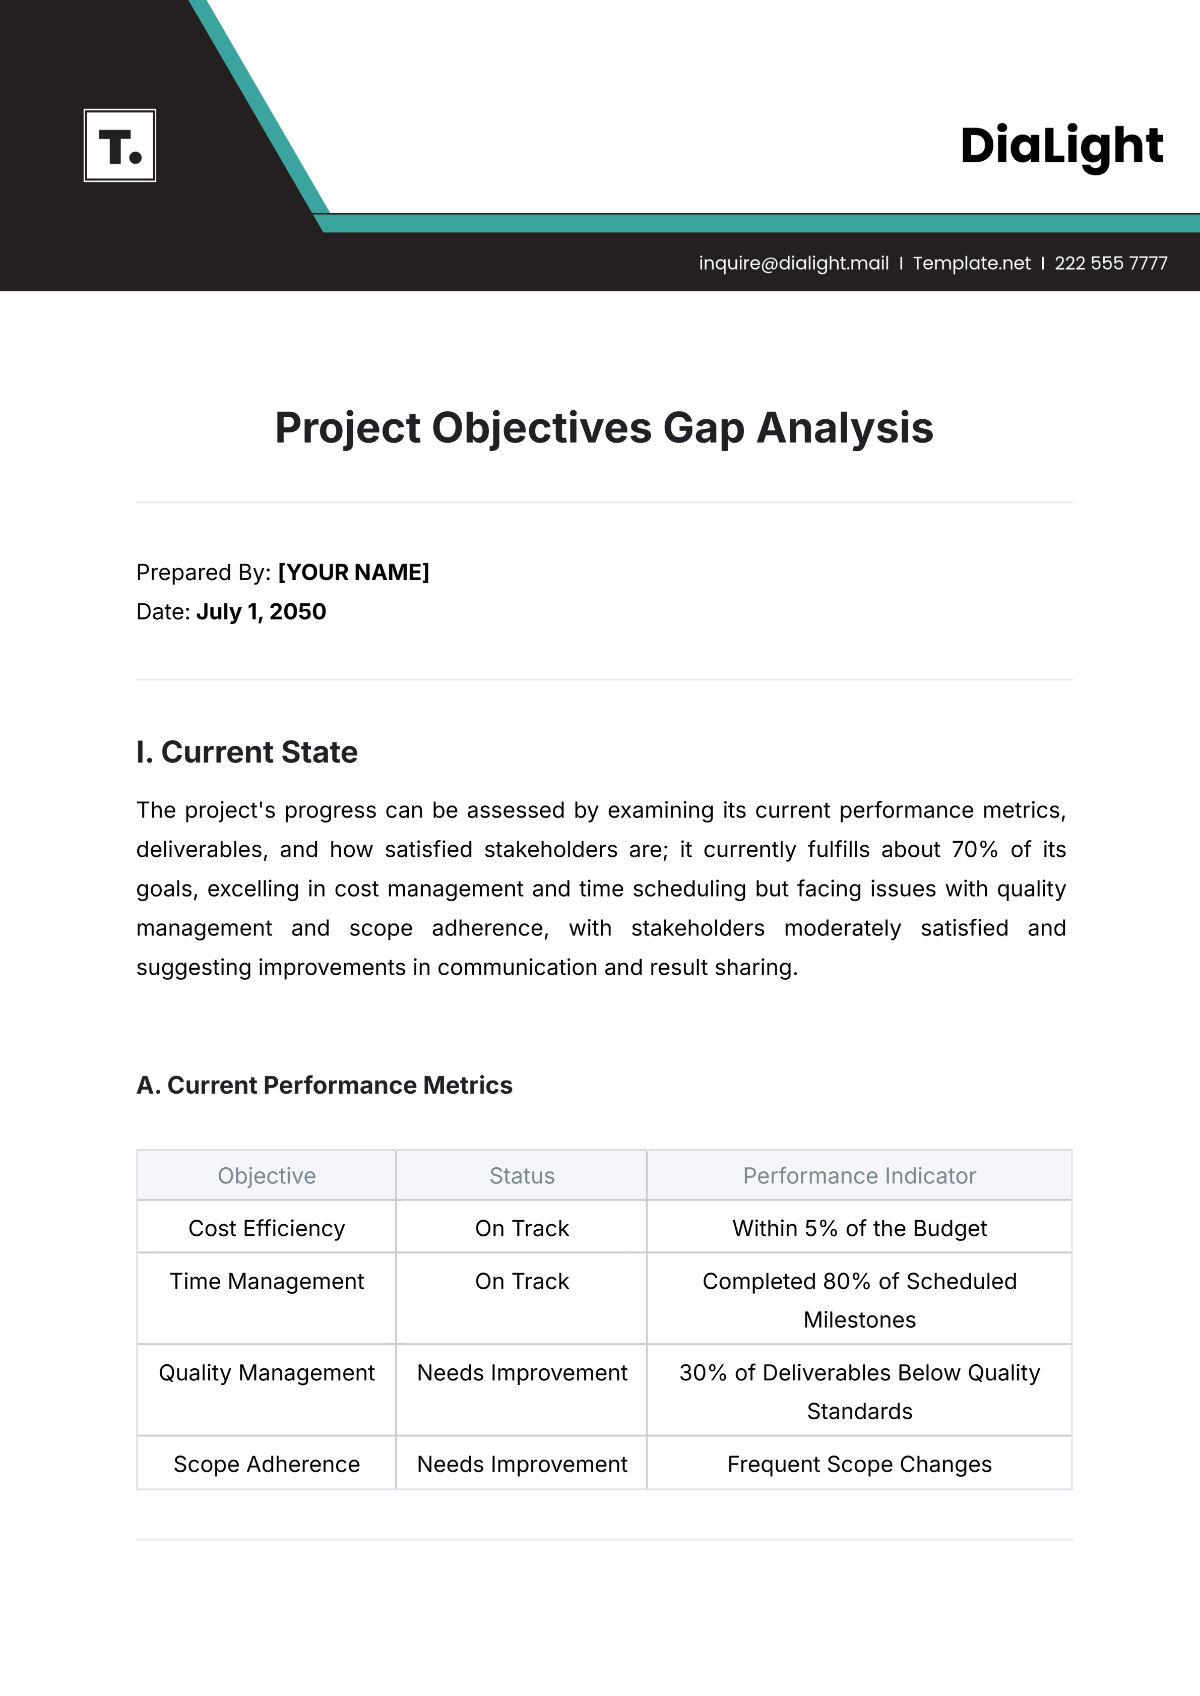
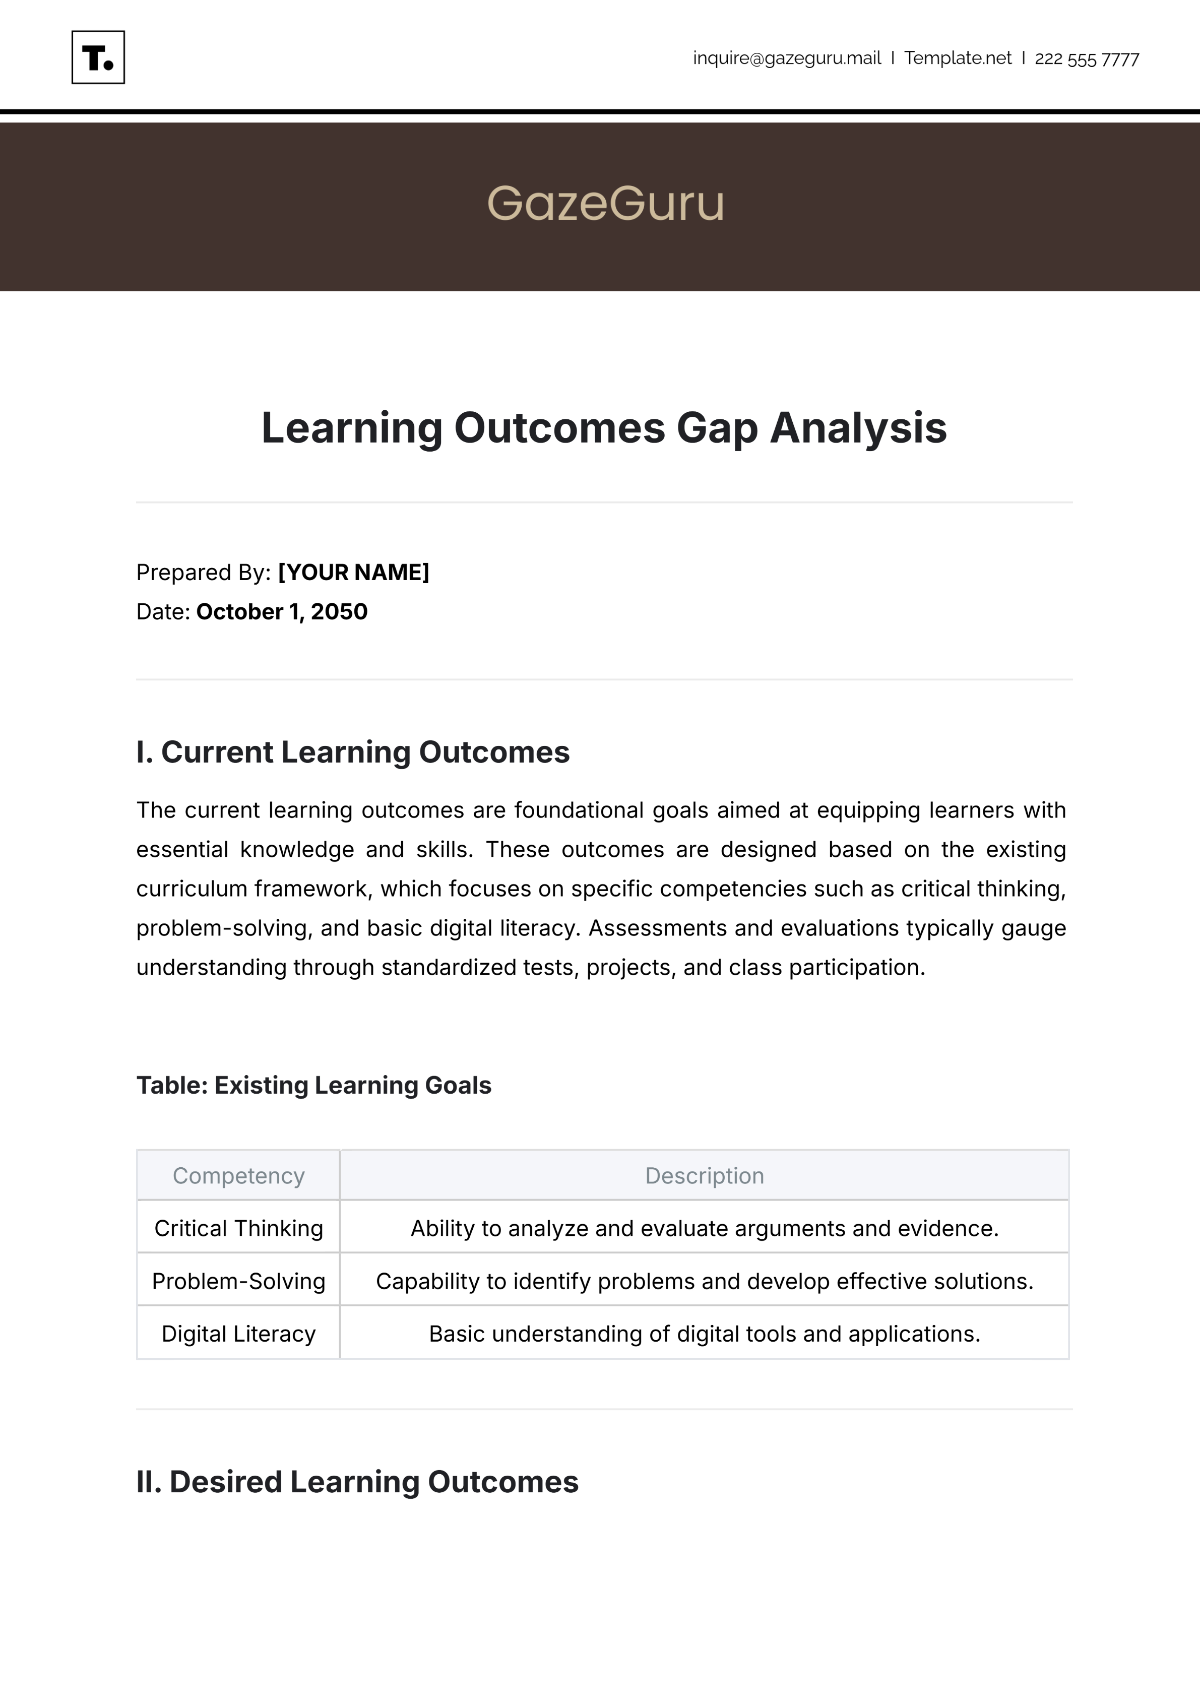
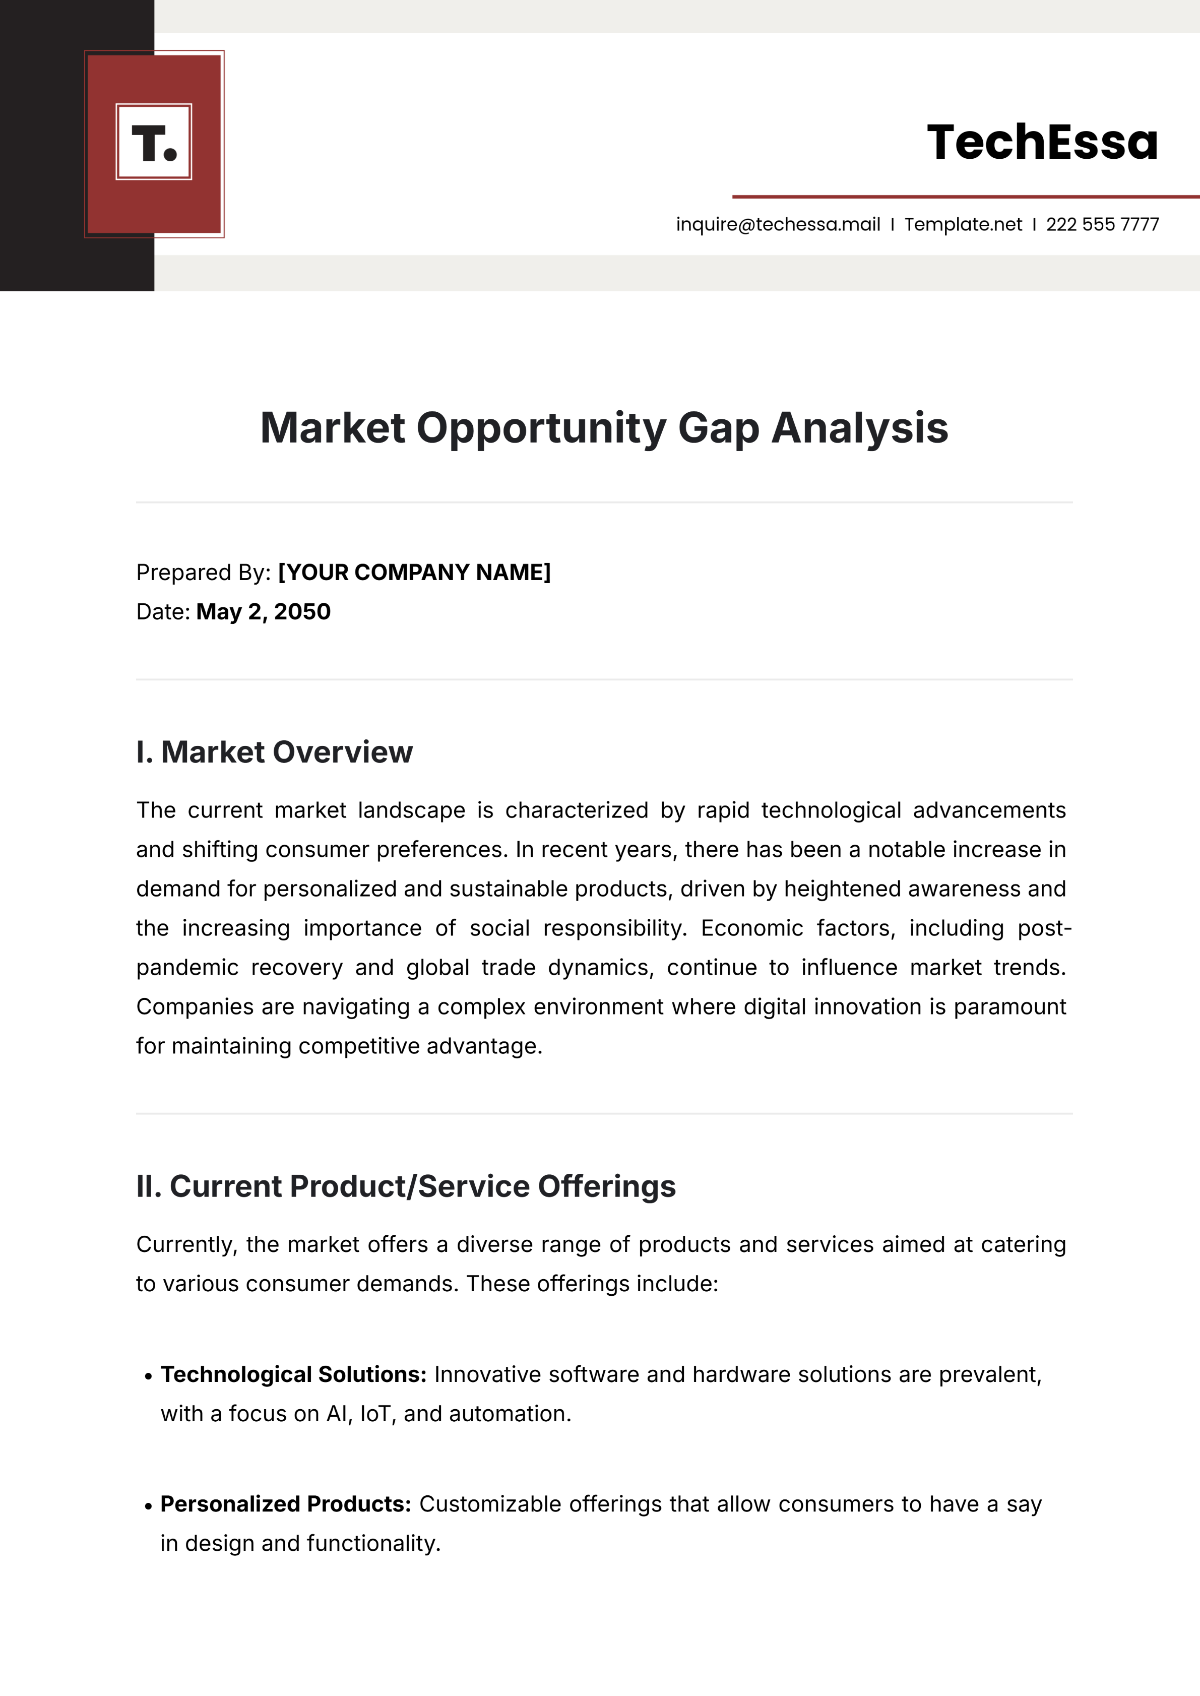
Resource Allocation Gap Analysis
Prepared By: [YOUR NAME]
Date: August 1, 2050
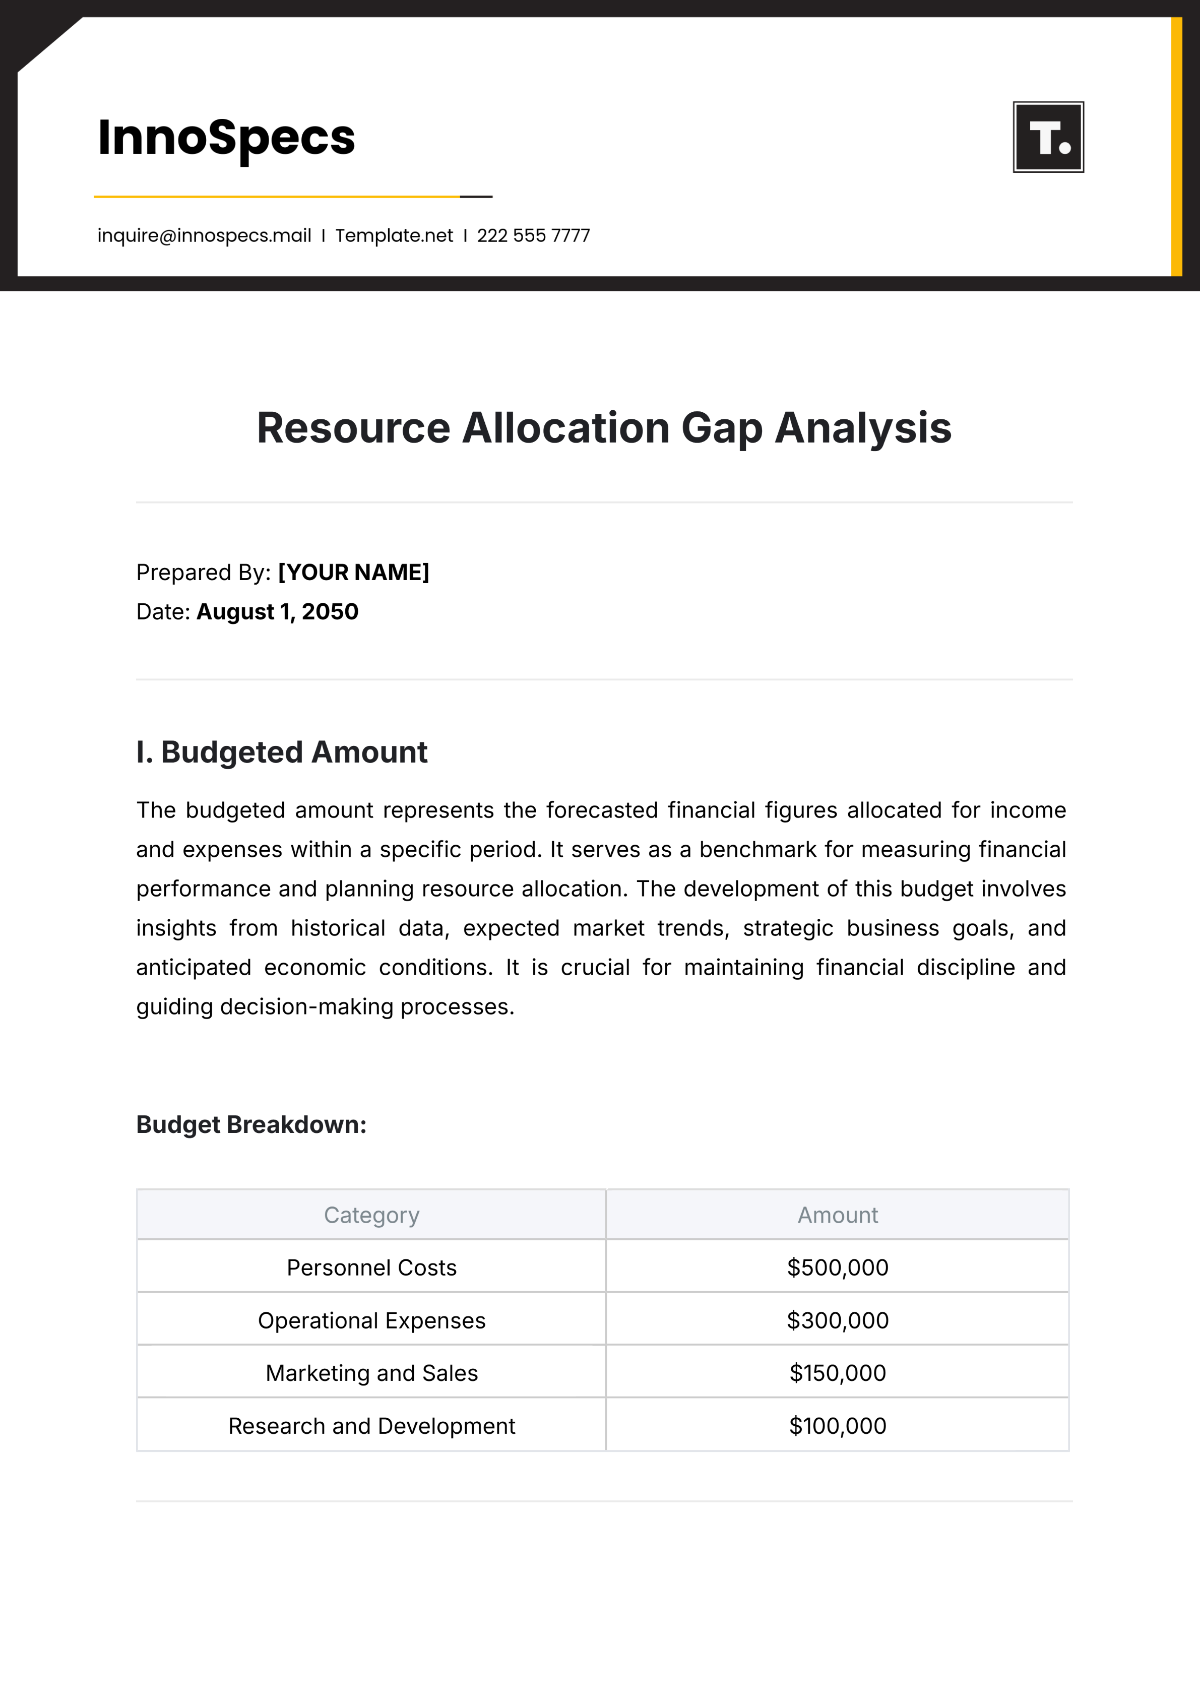
I. Budgeted Amount
The budgeted amount represents the forecasted financial figures allocated for income and expenses within a specific period. It serves as a benchmark for measuring financial performance and planning resource allocation. The development of this budget involves insights from historical data, expected market trends, strategic business goals, and anticipated economic conditions. It is crucial for maintaining financial discipline and guiding decision-making processes.
Budget Breakdown:
Category | Amount |
|---|---|
Personnel Costs | $500,000 |
Operational Expenses | $300,000 |
Marketing and Sales | $150,000 |
Research and Development | $100,000 |
II. Actual Performance
The actual performance refers to the real financial figures achieved during the evaluation period. It provides an accurate reflection of financial activities and is fundamental in assessing the effectiveness of financial planning and the operational efficiency of the organization. Actual performance results guide the recalibration of budgets and future strategic planning.
Performance Results:
Category | Amount |
|---|---|
Personnel Costs | $520,000 |
Operational Expenses | $310,000 |
Marketing and Sales | $120,000 |
Research and Development | $110,000 |
III. Variance
Variance is defined as the difference between the budgeted amount and the actual performance. This metric serves as an essential tool for understanding discrepancies and misalignments in financial planning. Identifying variances helps businesses adjust their strategies and optimize future resource allocations.
Variance Calculation:
Category | Budgeted | Actual | Variance |
|---|---|---|---|
Personnel Costs | $500,000 | $520,000 | -$20,000 |
Operational Expenses | $300,000 | $310,000 | -$10,000 |
Marketing and Sales | $150,000 | $120,000 | $30,000 |
Research and Development | $100,000 | $110,000 | -$10,000 |
IV. Variance Analysis
A detailed variance analysis clarifies why variances occurred, offering insights into organizational processes and environmental influences. This section includes explanations or notes that address unexpected expenses, external factors like market volatility, and strategic adaptations made during the financial period.
Personnel Costs: Increase due to mandatory overtime and unanticipated recruitment needs.
Operational Expenses: Rise attributed to unexpected maintenance costs and utility rate increases.
Marketing and Sales: Decrease due to a strategic shift towards digital marketing channels, cutting traditional marketing expenses.
Research and Development: Increase linked to accelerated project timelines and additional testing requirements.
V. Percentage Variance
The percentage variance quantifies the variance as a percentage of the budgeted amount, providing a relative measure of financial performance efficiency. It allows for quick assessment and comparison across different financial categories.
Percentage Variance:
Category | Percentage Variance |
|---|---|
Personnel Costs | -4% |
Operational Expenses | -3.33% |
Marketing and Sales | 20% |
Research and Development | -10% |
VI. Recommendations or Action Plans
Based on the identified gaps and their underlying causes, the following recommendations and action plans are suggested to address the variances and optimize future financial performance:
Enhance budgeting accuracy: Utilize more granular data and trend analysis to refine budget forecasts and improve accuracy.
Implement cost-control measures: Establish stricter oversight on labor costs and operational expenditures through automated monitoring systems.
Optimize marketing strategies: Continue leveraging cost-effective digital channels while investing in data analytics for better targeting.
Increase flexibility in R&D budgeting: Allocate contingency funds to accommodate project scope changes without compromising progress.
