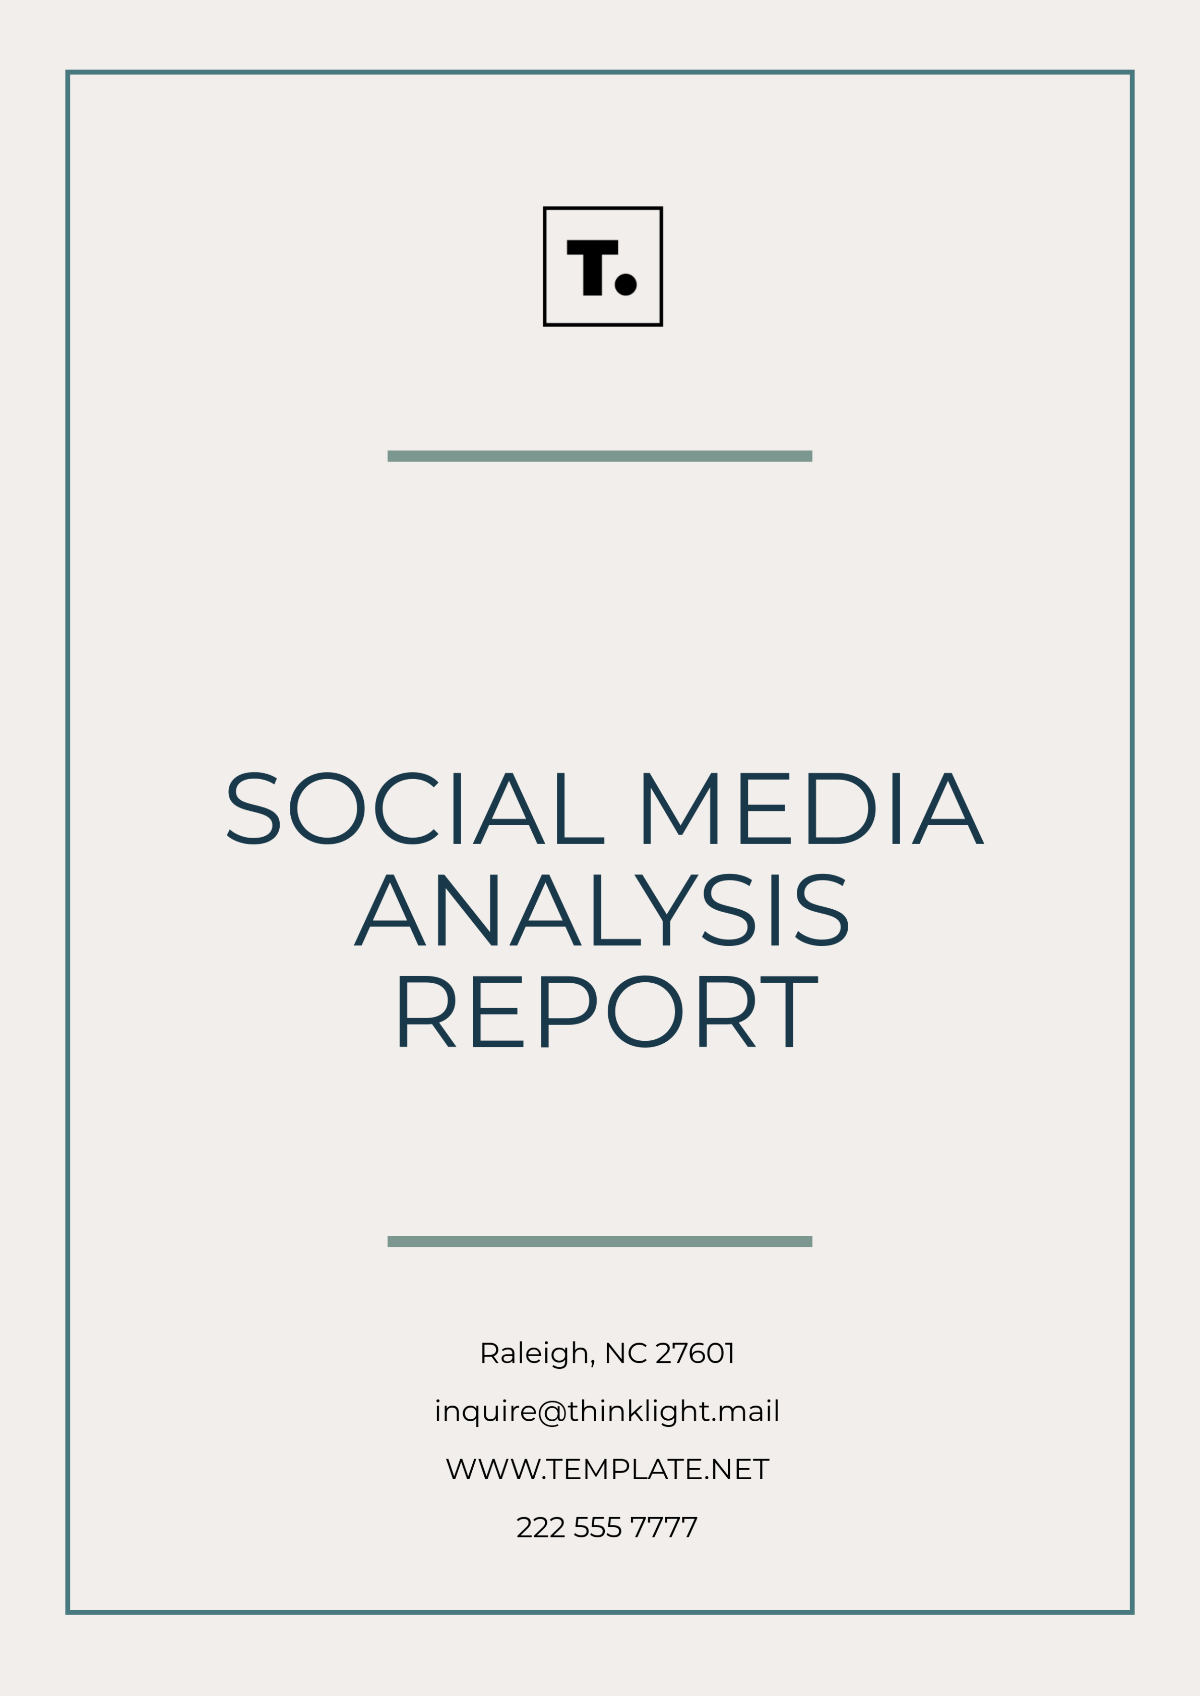
Free Social Media Analysis Report
Prepared by: [Your Name]
Company: [Your Company Name]
Date: [Date]
1. Executive Summary
This report presents the analysis of social media performance for the period from October 1, 2050, to November 30, 2050. The main objective was to evaluate content engagement, audience growth, and sentiment across key platforms (Facebook, Twitter, Instagram, LinkedIn). Overall, social media performance saw a 12% increase in engagement, with Instagram showing the highest growth in followers. Key recommendations include refining content targeting, boosting engagement through interactive posts, and expanding on platform-specific trends.
2. Objectives and Goals
Objective 1: Measure audience engagement and overall reach across social media platforms.
Objective 2: Analyze content performance and identify top-performing posts.
Objective 3: Evaluate audience sentiment to gauge public perception.
Objective 4: Compare performance with key competitors.
3. Audience Analysis
Total Audience: 150,000 followers across all platforms, with a growth rate of 10% over the last quarter.
Demographics:
Age: 18-34 years (60%)
Gender: 55% female, 45% male
Location: Predominantly North America (65%), followed by Europe (20%).
Interests: Technology, fashion, and lifestyle.
Audience Behavior: Users primarily engage during weekday afternoons, with peak engagement times around 1 PM - 3 PM EST.
4. Content Performance
Total Posts: 120 posts across all platforms.
Top Performing Posts:
Instagram: “Behind-the-scenes video of product creation” – 10,000 views, 1,200 engagements (likes/comments).
Twitter: “Poll on product preferences” – 1,000 responses, 500 retweets.
Engagement Breakdown:
Facebook: Engagement rate of 4.5% (compared to 3.8% in Q3 2050).
Instagram: Engagement rate of 7% (compared to 6.3% in Q3 2050).
Twitter: Engagement rate of 3.2% (compared to 2.5% in Q3 2050).
LinkedIn: Engagement rate of 2.9% (compared to 3.1% in Q3 2050).
5. Sentiment Analysis
Positive Sentiment: 75% of comments and interactions were positive, particularly in response to new product launches and customer support.
Neutral Sentiment: 15% of comments were neutral, with users asking for more information or clarification on product features.
Negative Sentiment: 10% of comments were negative, mainly regarding shipping delays and product availability.
6. Platform Breakdown
Facebook: Total reach: 50,000; engagement: 2,200 (up 10% from the previous period).
Instagram: Total reach: 70,000; engagement: 5,000 (up 20% from the previous period).
Twitter: Total reach: 30,000; engagement: 1,200 (up 5% from the previous period).
LinkedIn: Total reach: 10,000; engagement: 300 (down 5% from the previous period).
7. Competitor Benchmarking
Competitor A: 8% growth in engagement across platforms, with Instagram as the leading platform.
Competitor B: Strong performance on LinkedIn, with a 10% increase in engagement.
Industry Average: 5% engagement growth, primarily driven by Instagram and Twitter.
Our performance outpaces the industry average, with Instagram driving the largest share of engagement.
8. Key Metrics and KPIs
Total Reach: 150,000 users
Total Engagements: 12,000 interactions (likes, comments, shares)
Click-Through Rate (CTR): 4.3% (up from 3.5% in Q3 2050)
Follower Growth: 10% increase across platforms
Conversion Rate: 2% (down from 3% in Q3 2050)
9. Trends and Insights
Video Content: Posts featuring video content had a 25% higher engagement rate than image-only posts.
User-Generated Content: Campaigns encouraging user-generated content (e.g., photo contests) resulted in a 30% boost in engagement.
Platform-Specific Trends: Instagram's Stories feature and Twitter polls were particularly effective in driving user interaction.
10. Recommendations
Refine Content Strategy: Focus on creating more interactive content (polls, quizzes, user-generated content) to increase engagement.
Expand Instagram Presence: Leverage Stories and reels to boost visibility and engagement.
Address Negative Sentiment: Prioritize addressing customer complaints and issues related to shipping delays to improve customer satisfaction.
Target Audience Expansion: Consider diversifying content to appeal to older demographics, especially on LinkedIn, to increase engagement on the platform.
11. Conclusion
In conclusion, the social media performance for the period showed solid growth in engagement and audience size, especially on Instagram. Continued focus on interactive content and addressing customer concerns will be crucial for maintaining and growing social media influence in the upcoming quarter.
- 100% Customizable, free editor
- Access 1 Million+ Templates, photo’s & graphics
- Download or share as a template
- Click and replace photos, graphics, text, backgrounds
- Resize, crop, AI write & more
- Access advanced editor
Analyze your social media performance effortlessly with the Social Media Analysis Report Template from Template.net. This fully customizable and editable template streamlines data presentation, ensuring clarity and professionalism. Easily personalize it to suit your needs using our powerful AI Editor Tool. Perfect for marketers aiming to optimize strategy and track success with style and precision.
