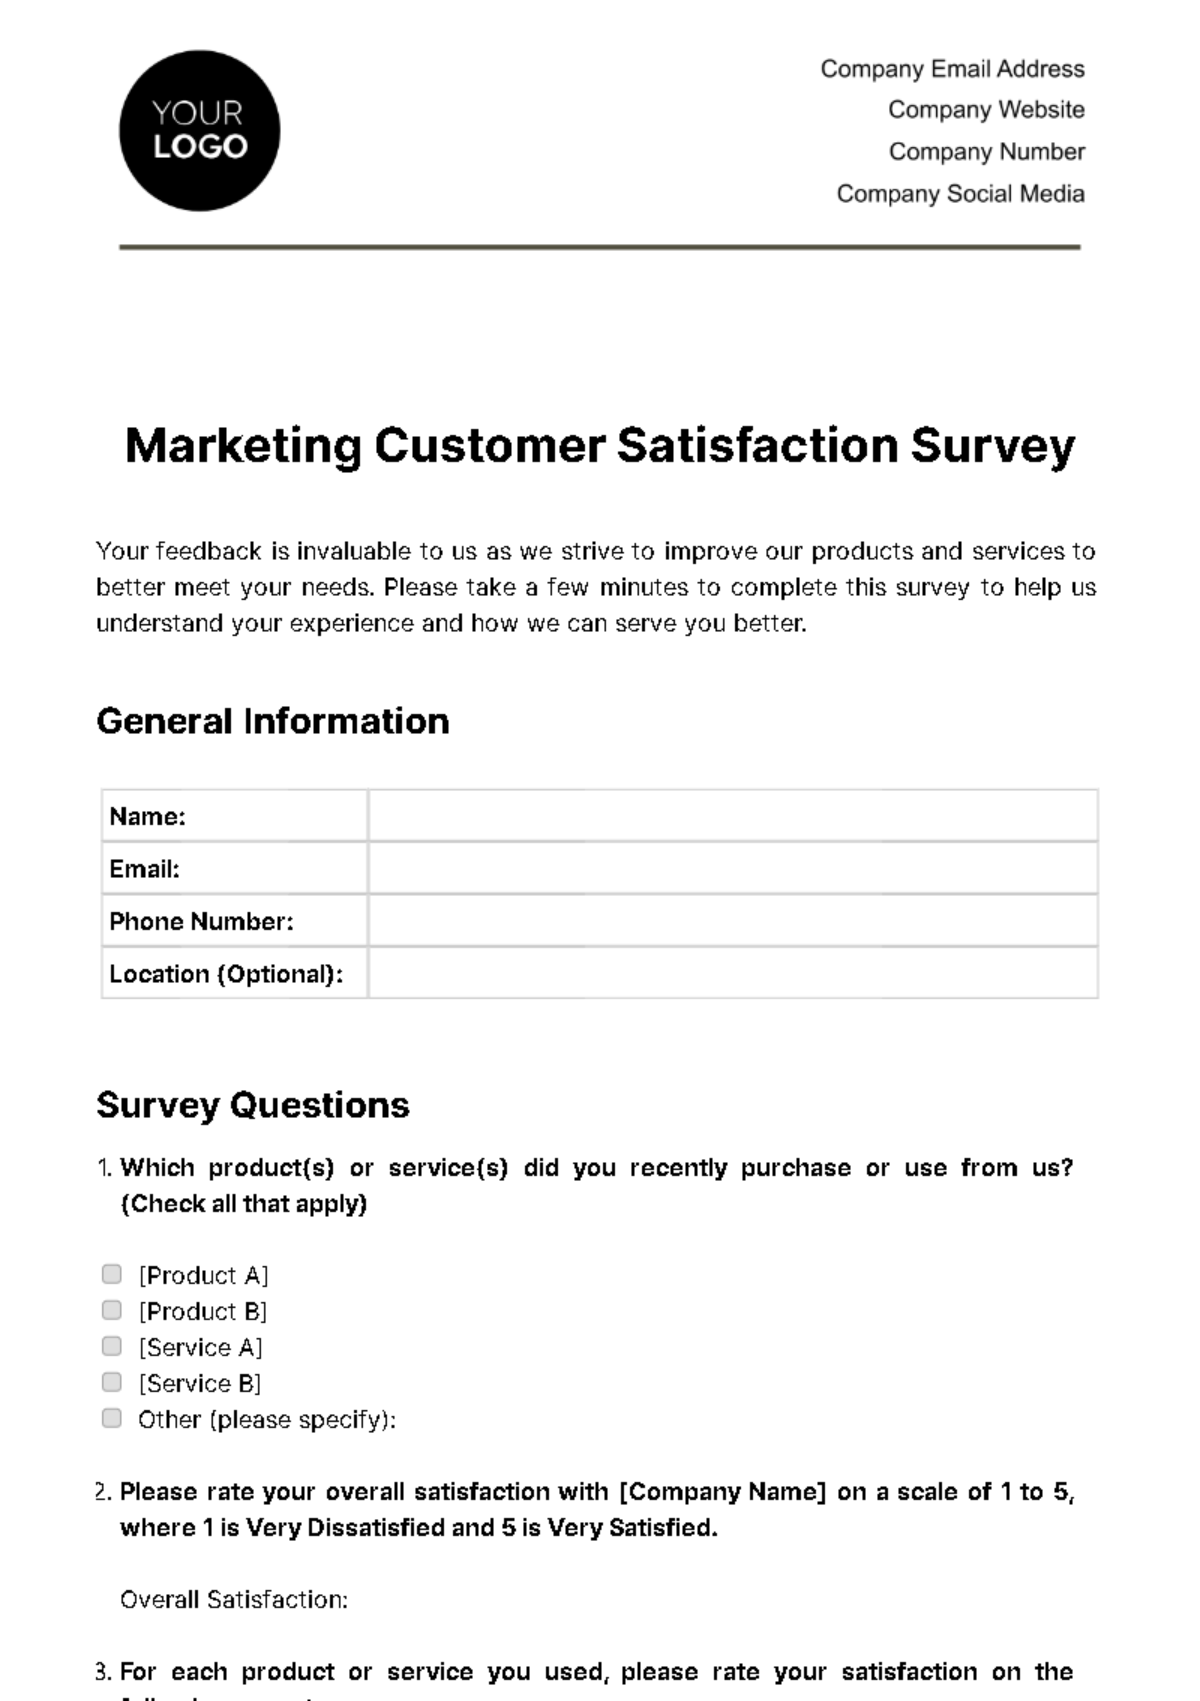
Customer Satisfaction Survey Report
Introduction
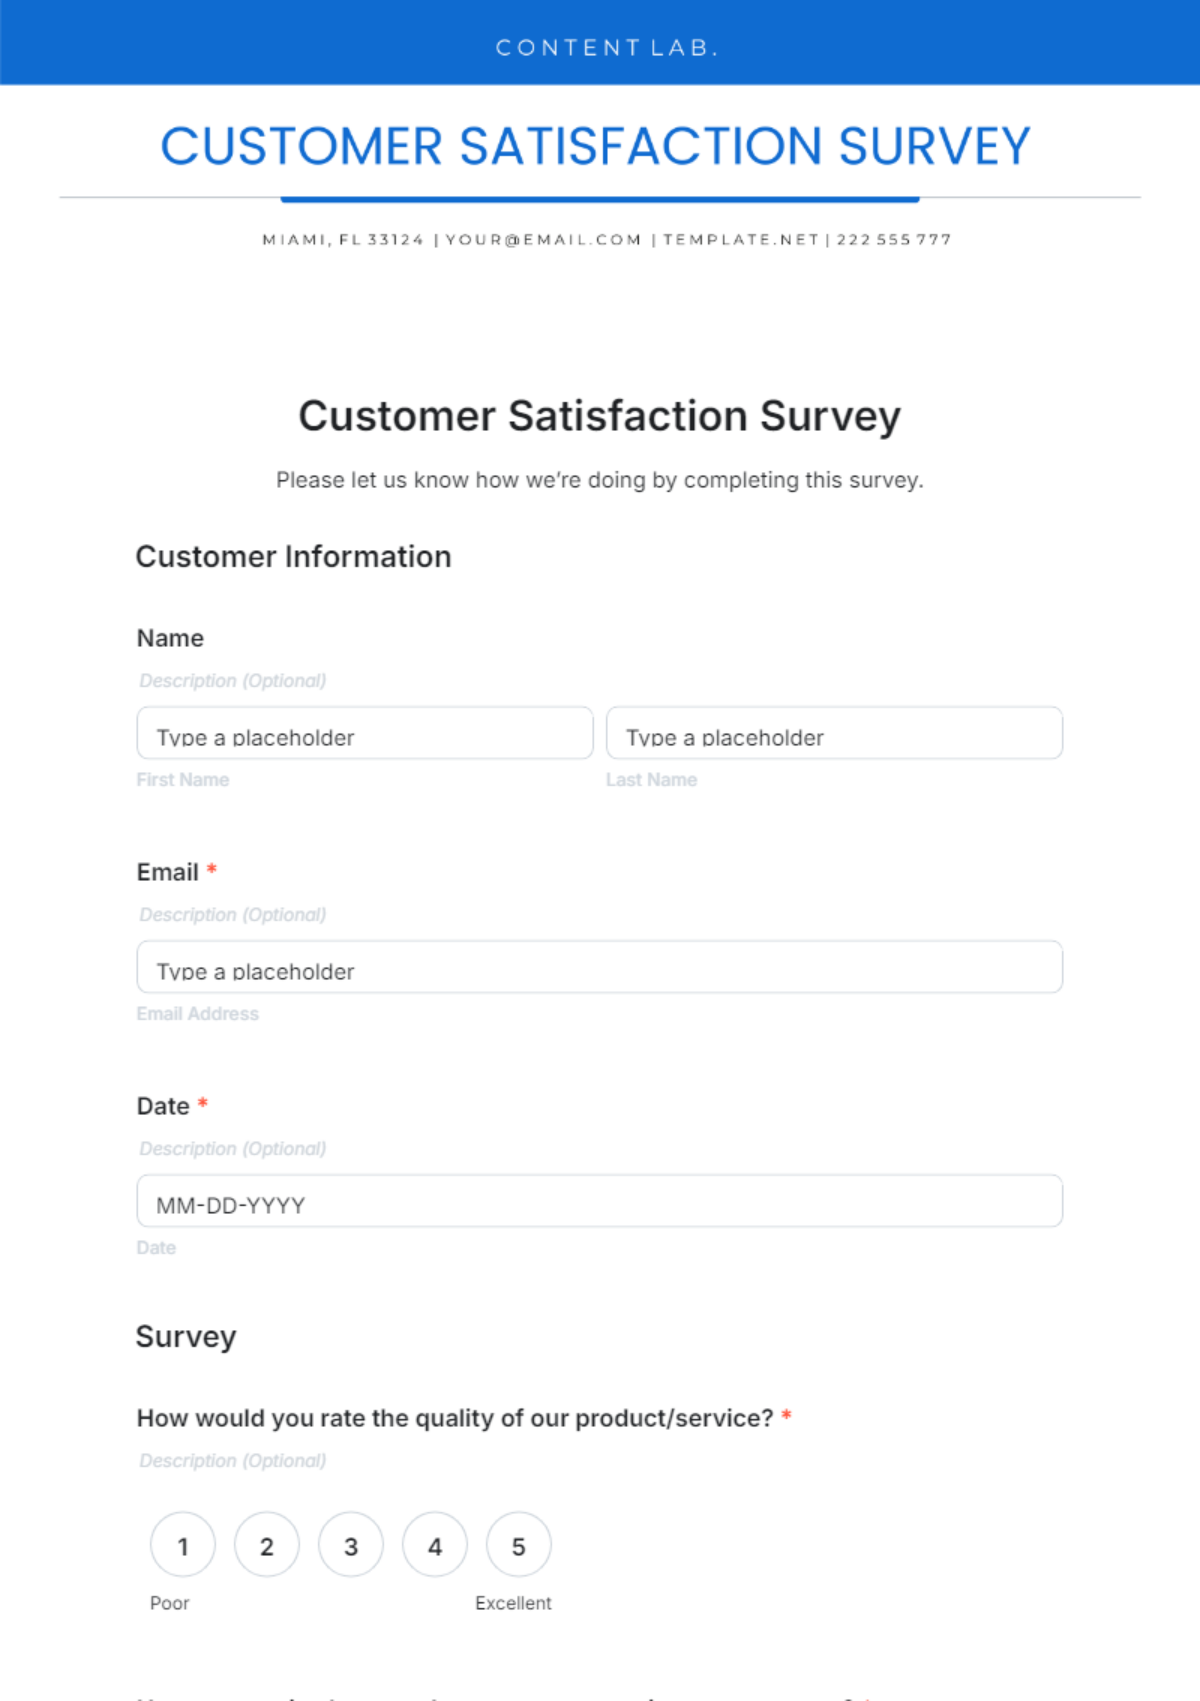
The primary objective of this report is to provide a comprehensive analysis of customer satisfaction based on the recent survey conducted across our product lines. We aim to identify areas of strength and opportunities for improvement in order to enhance overall customer experience.
Survey Methodology
Data Collection
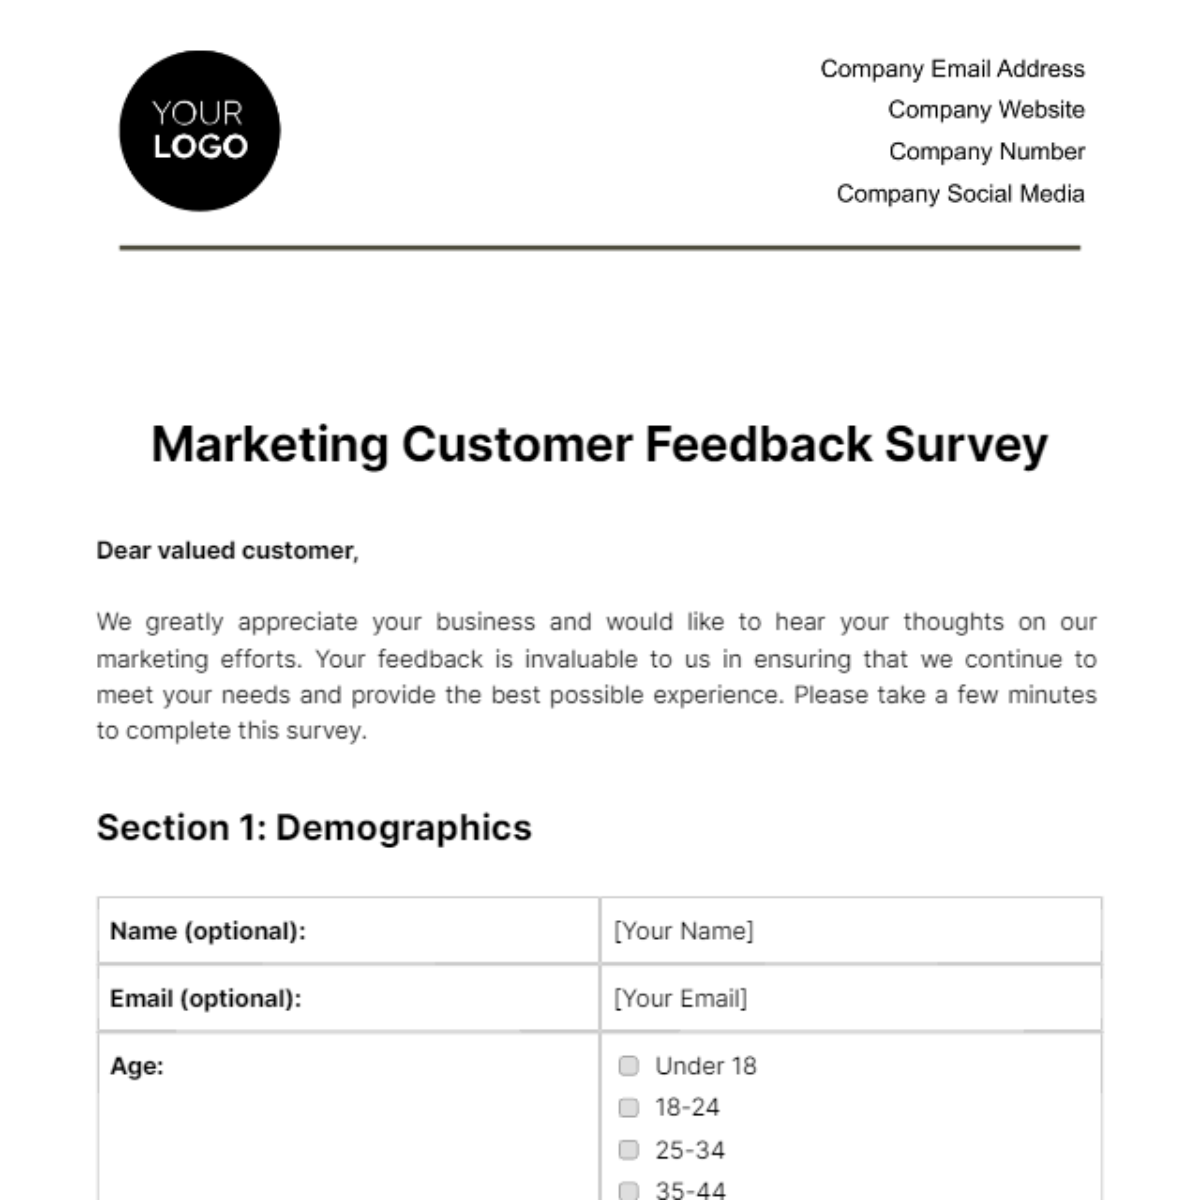
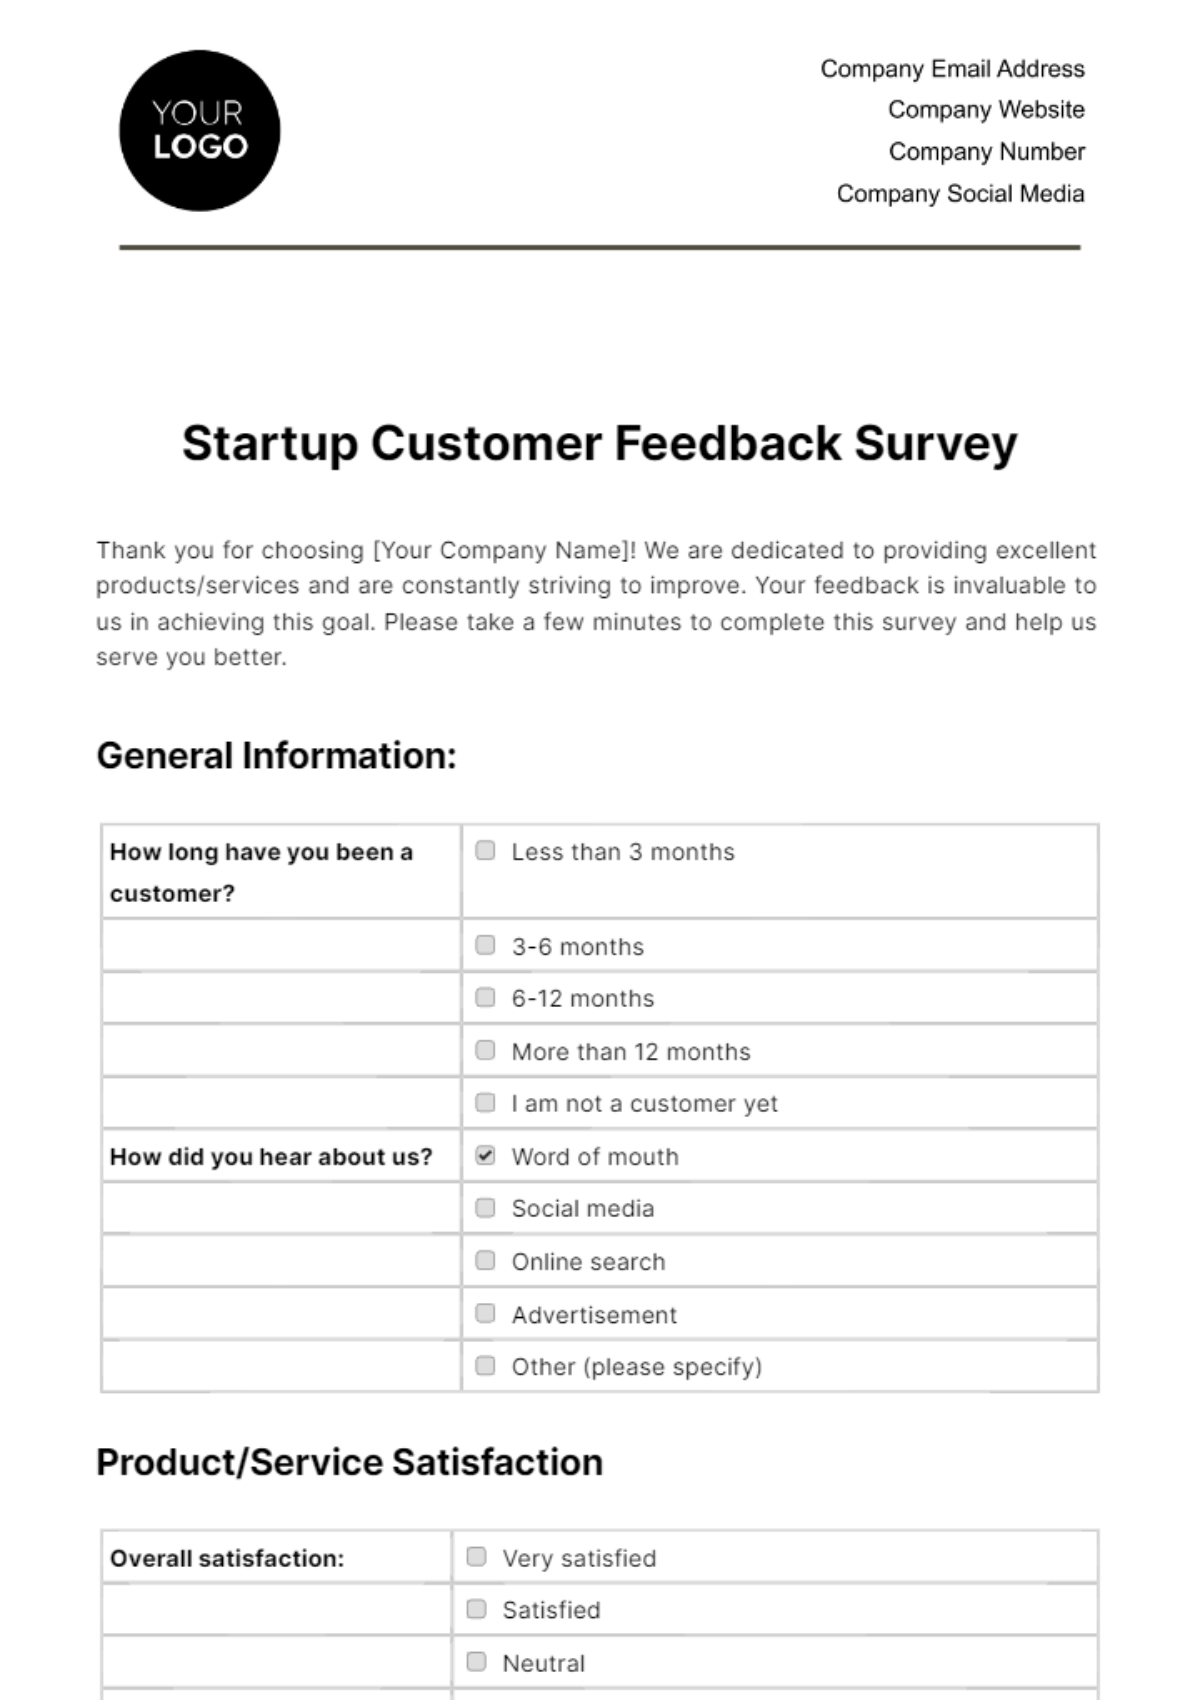
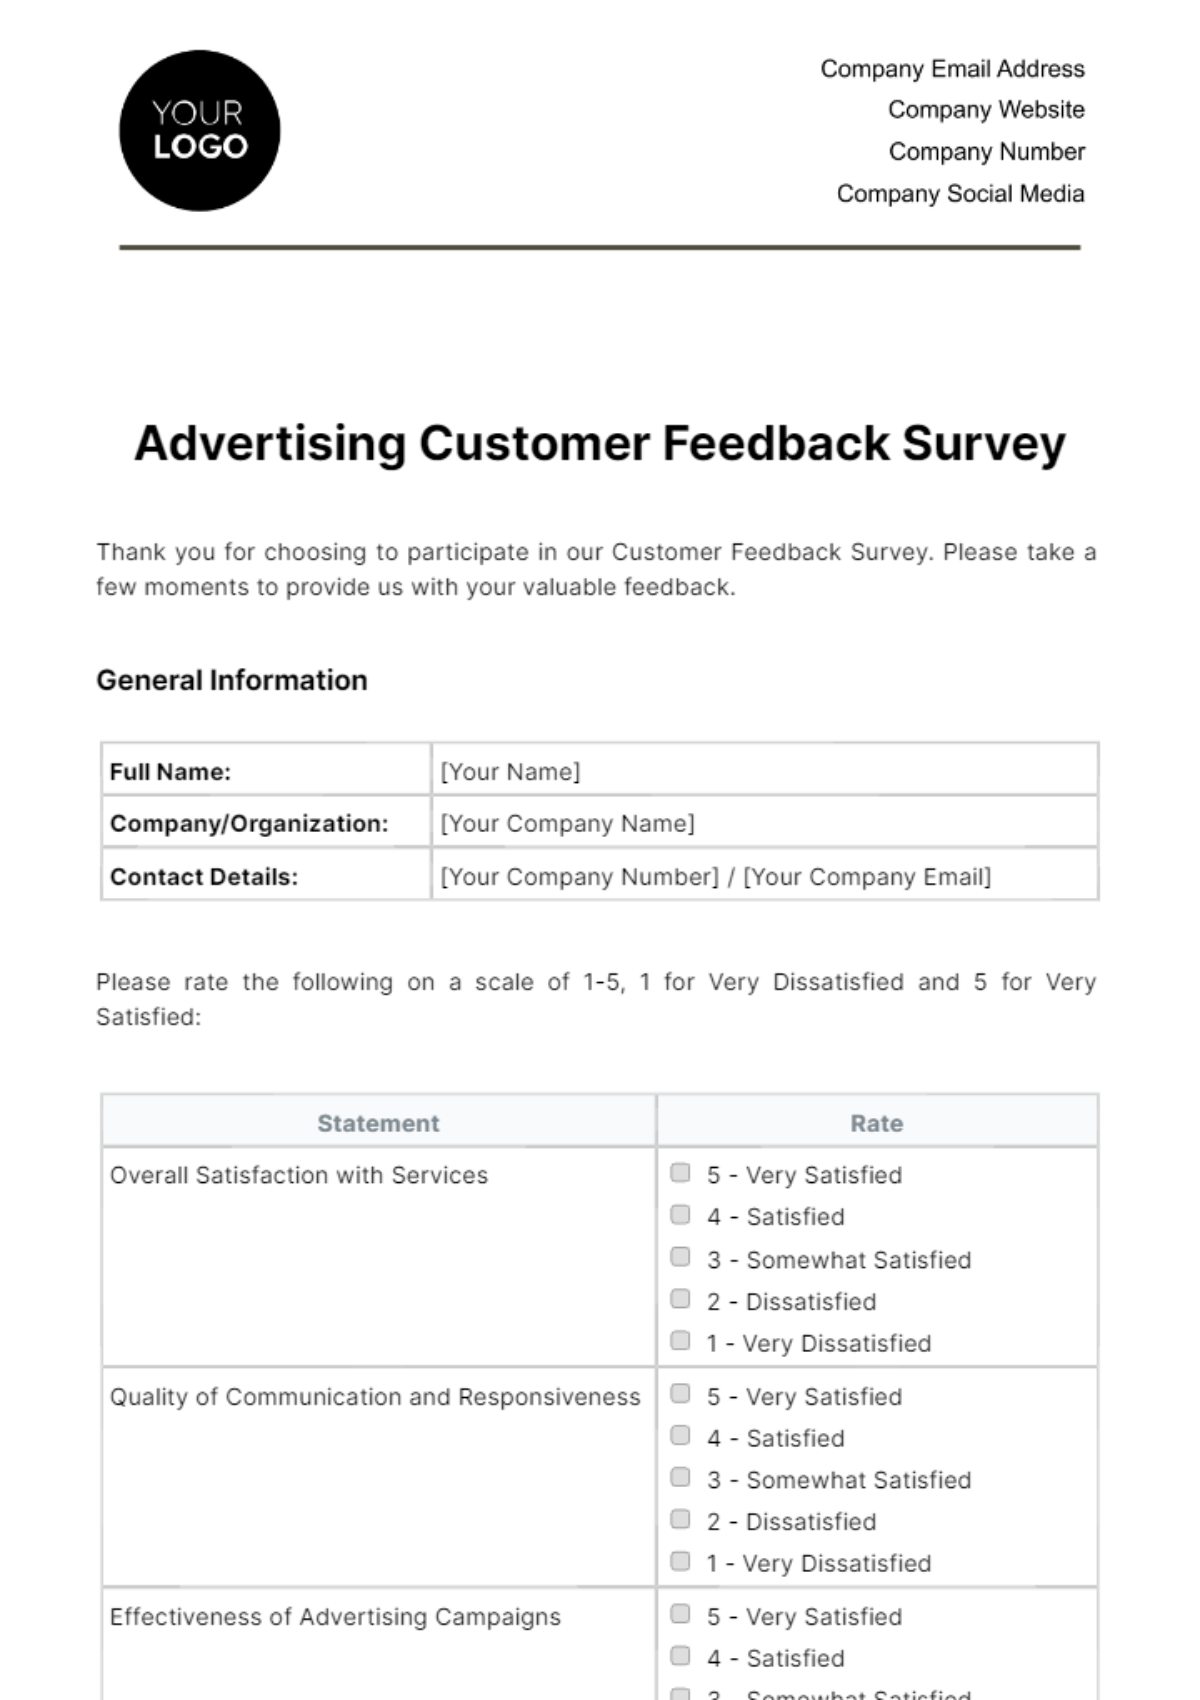
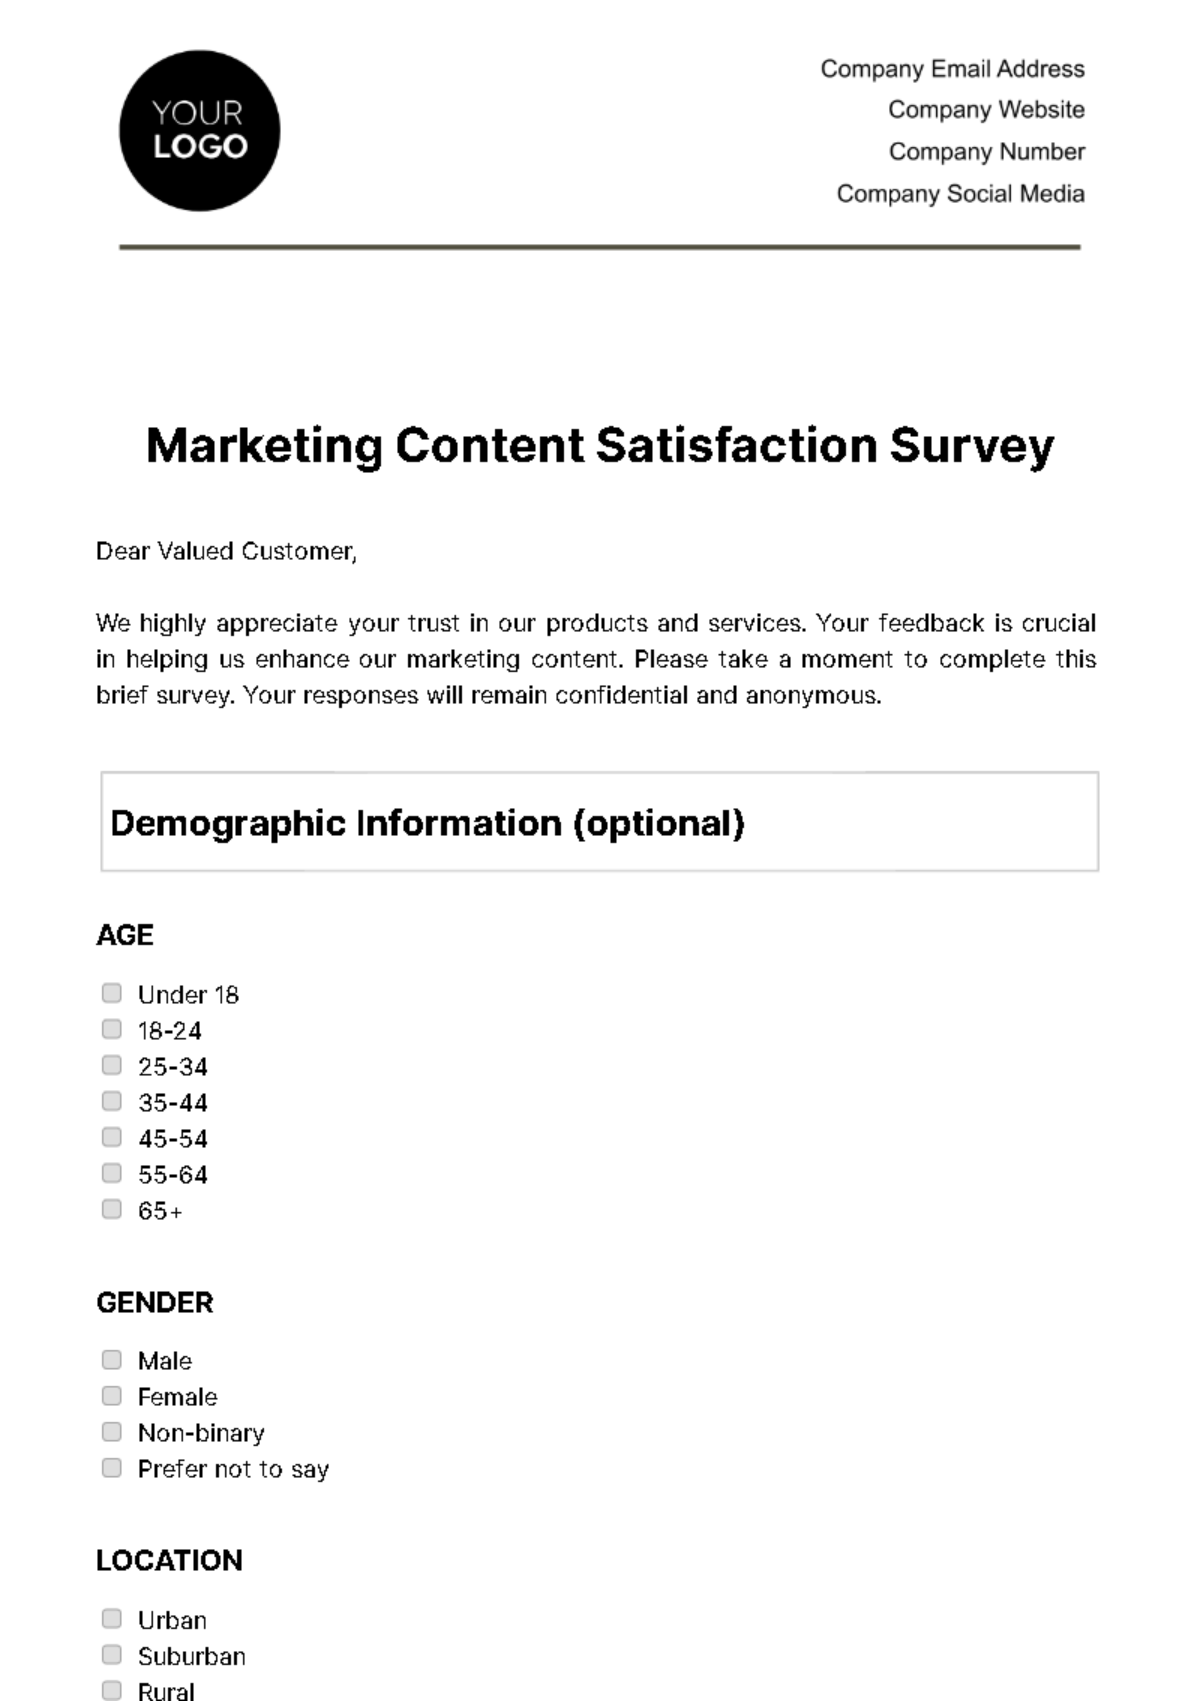
The survey was conducted over a period of four weeks, with responses collected through an online platform. Participants were randomly selected from our customer database to ensure a representative sample. A total of 1,500 responses were received, covering various demographics and spanning multiple regions.
Survey Instrument
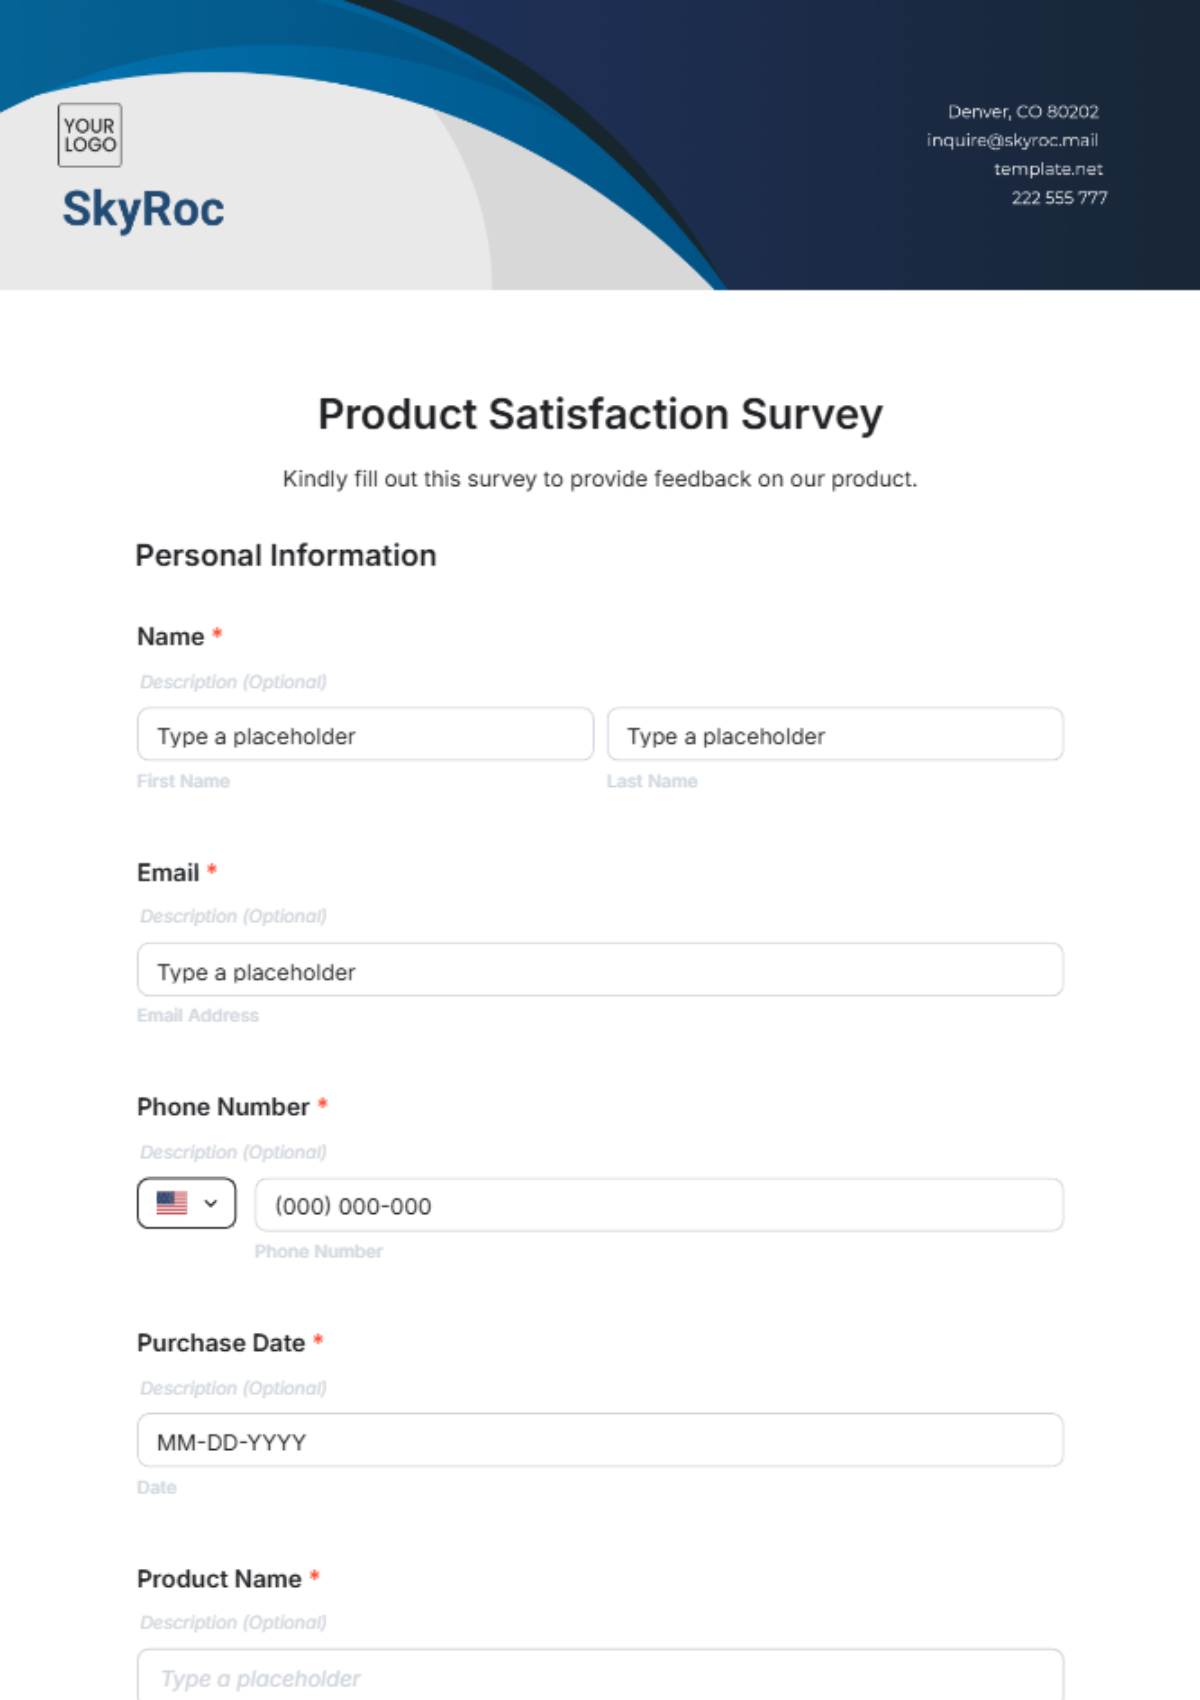
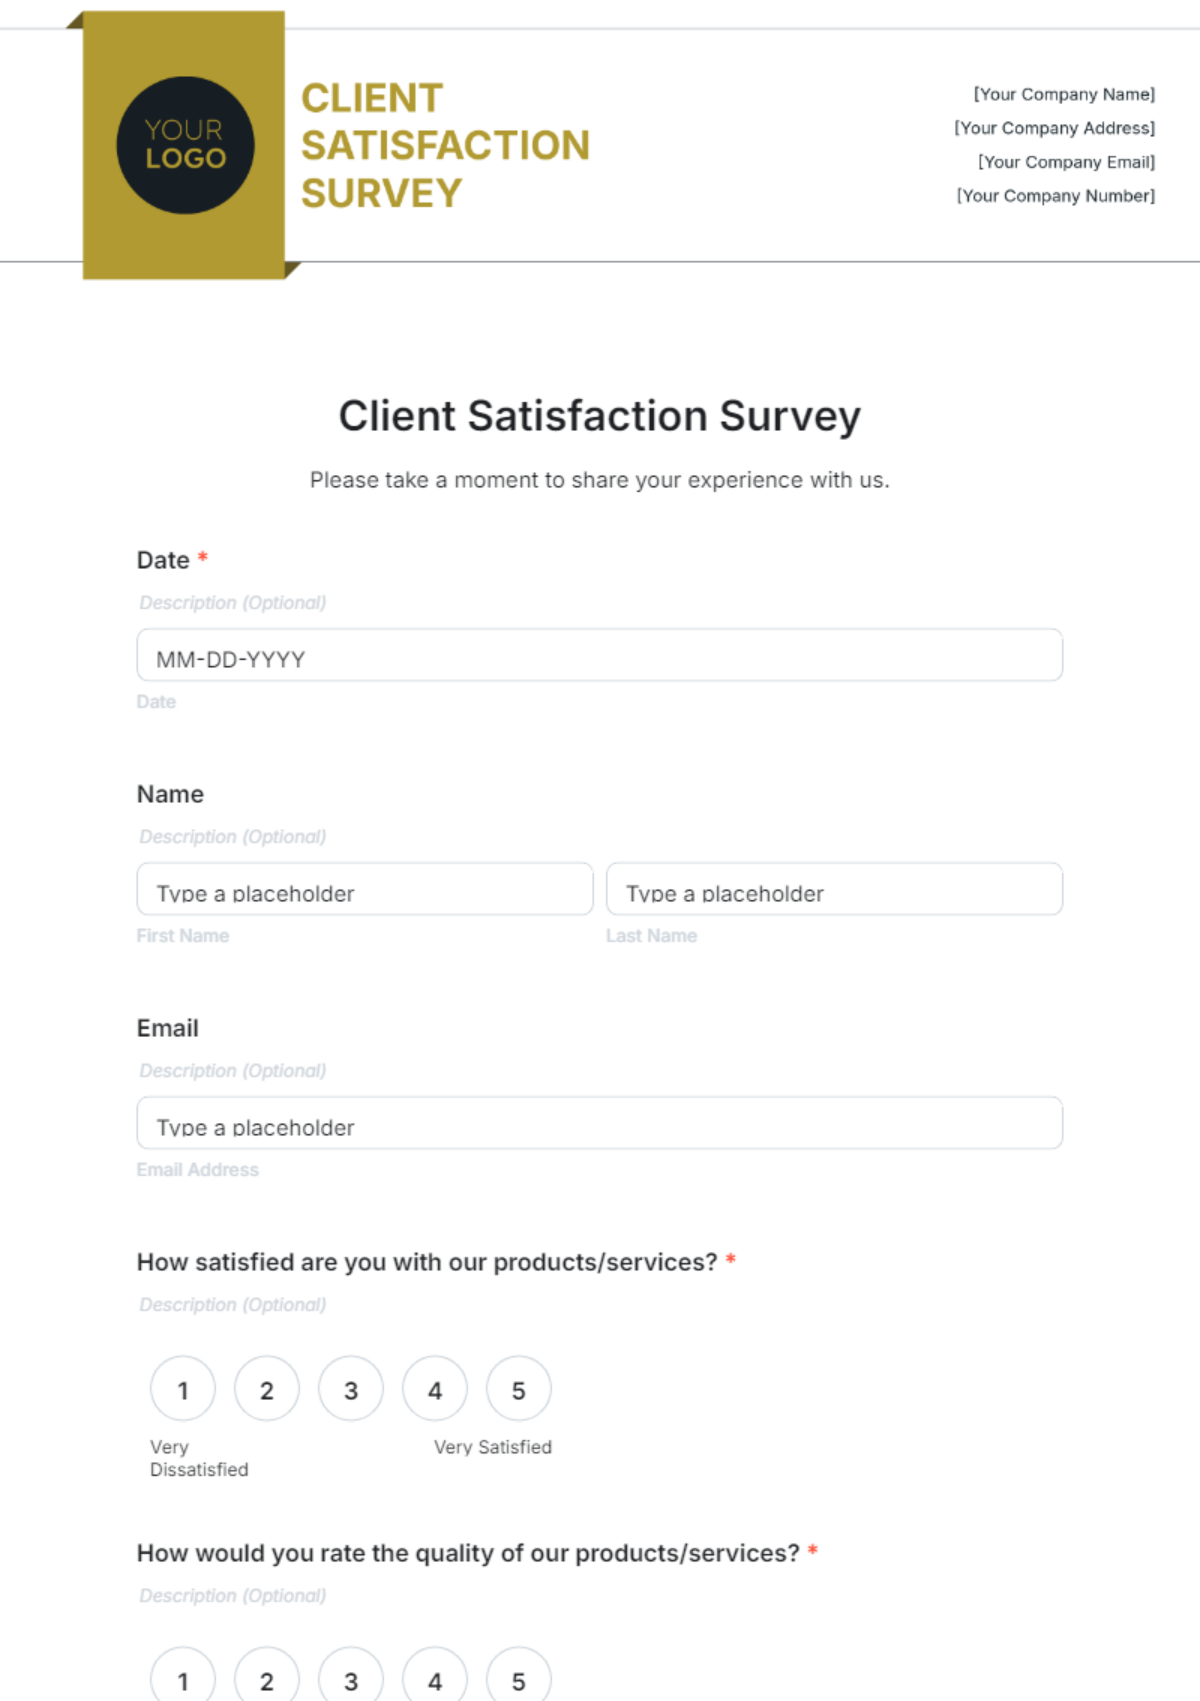
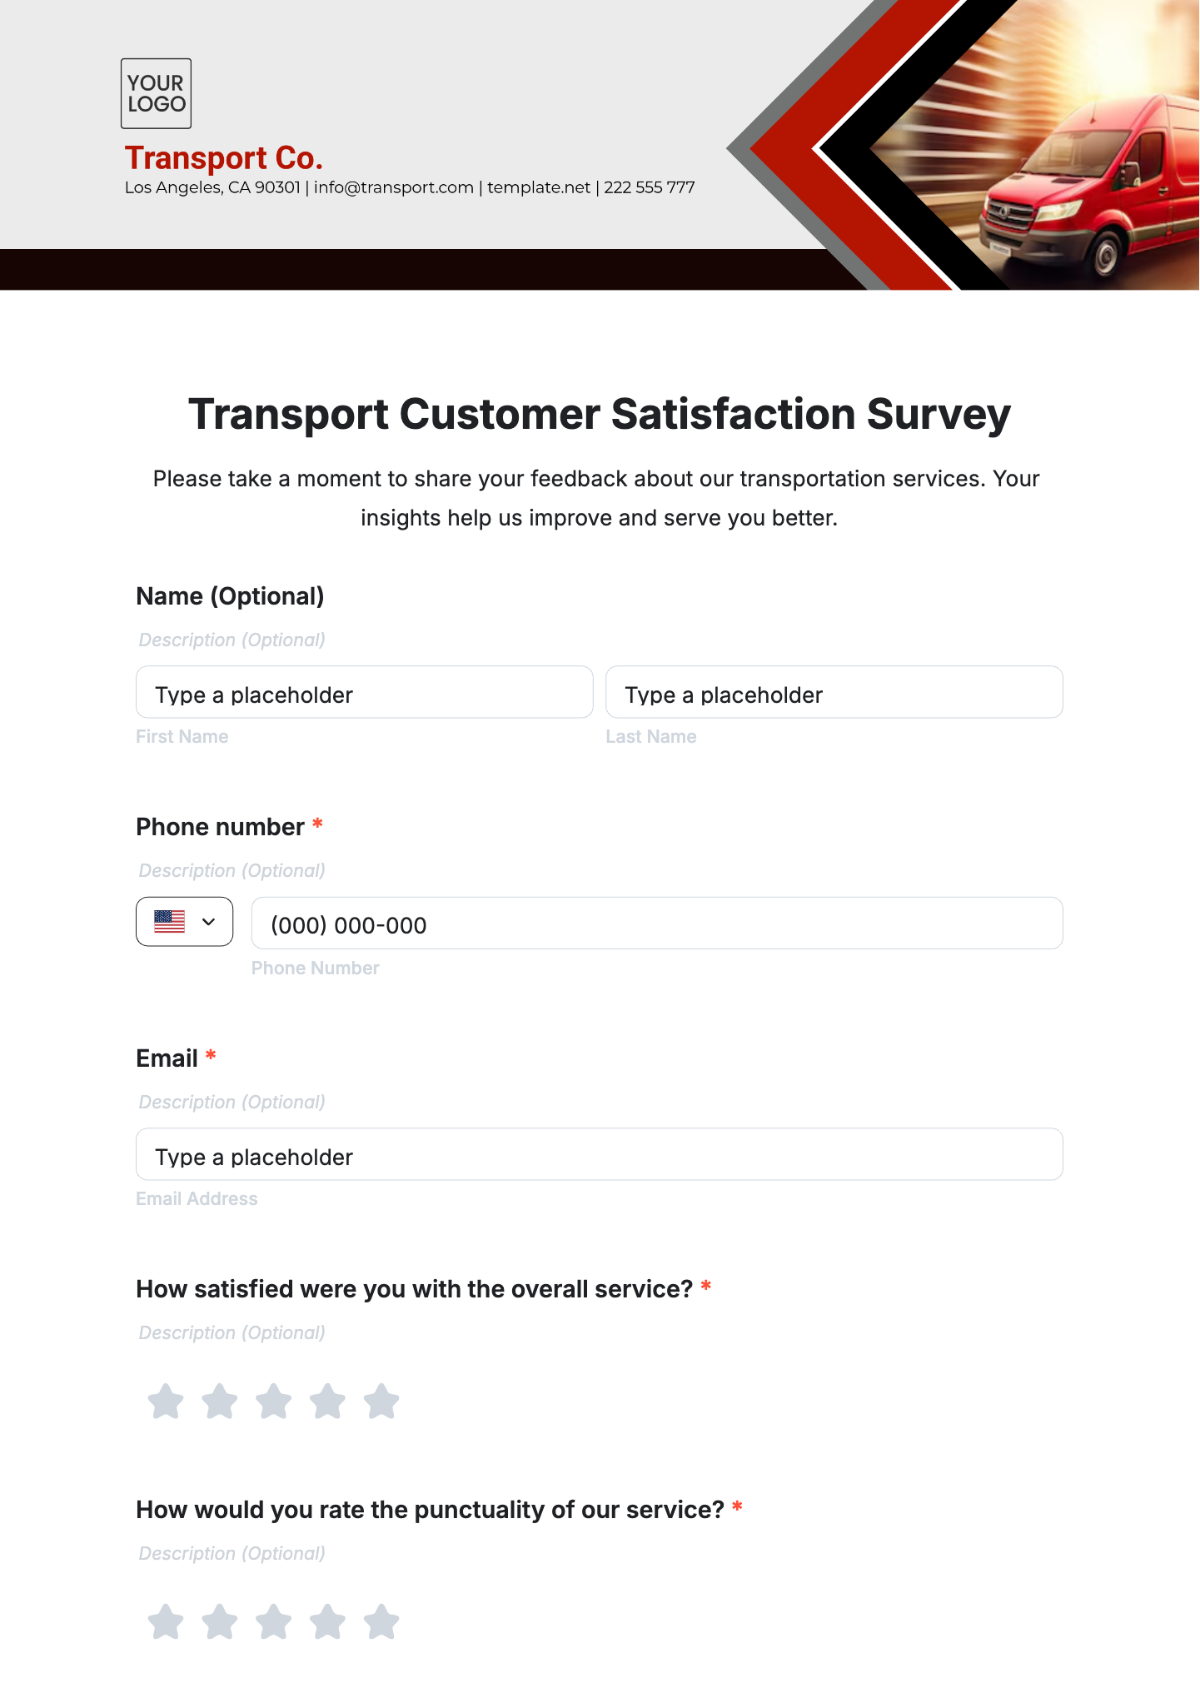
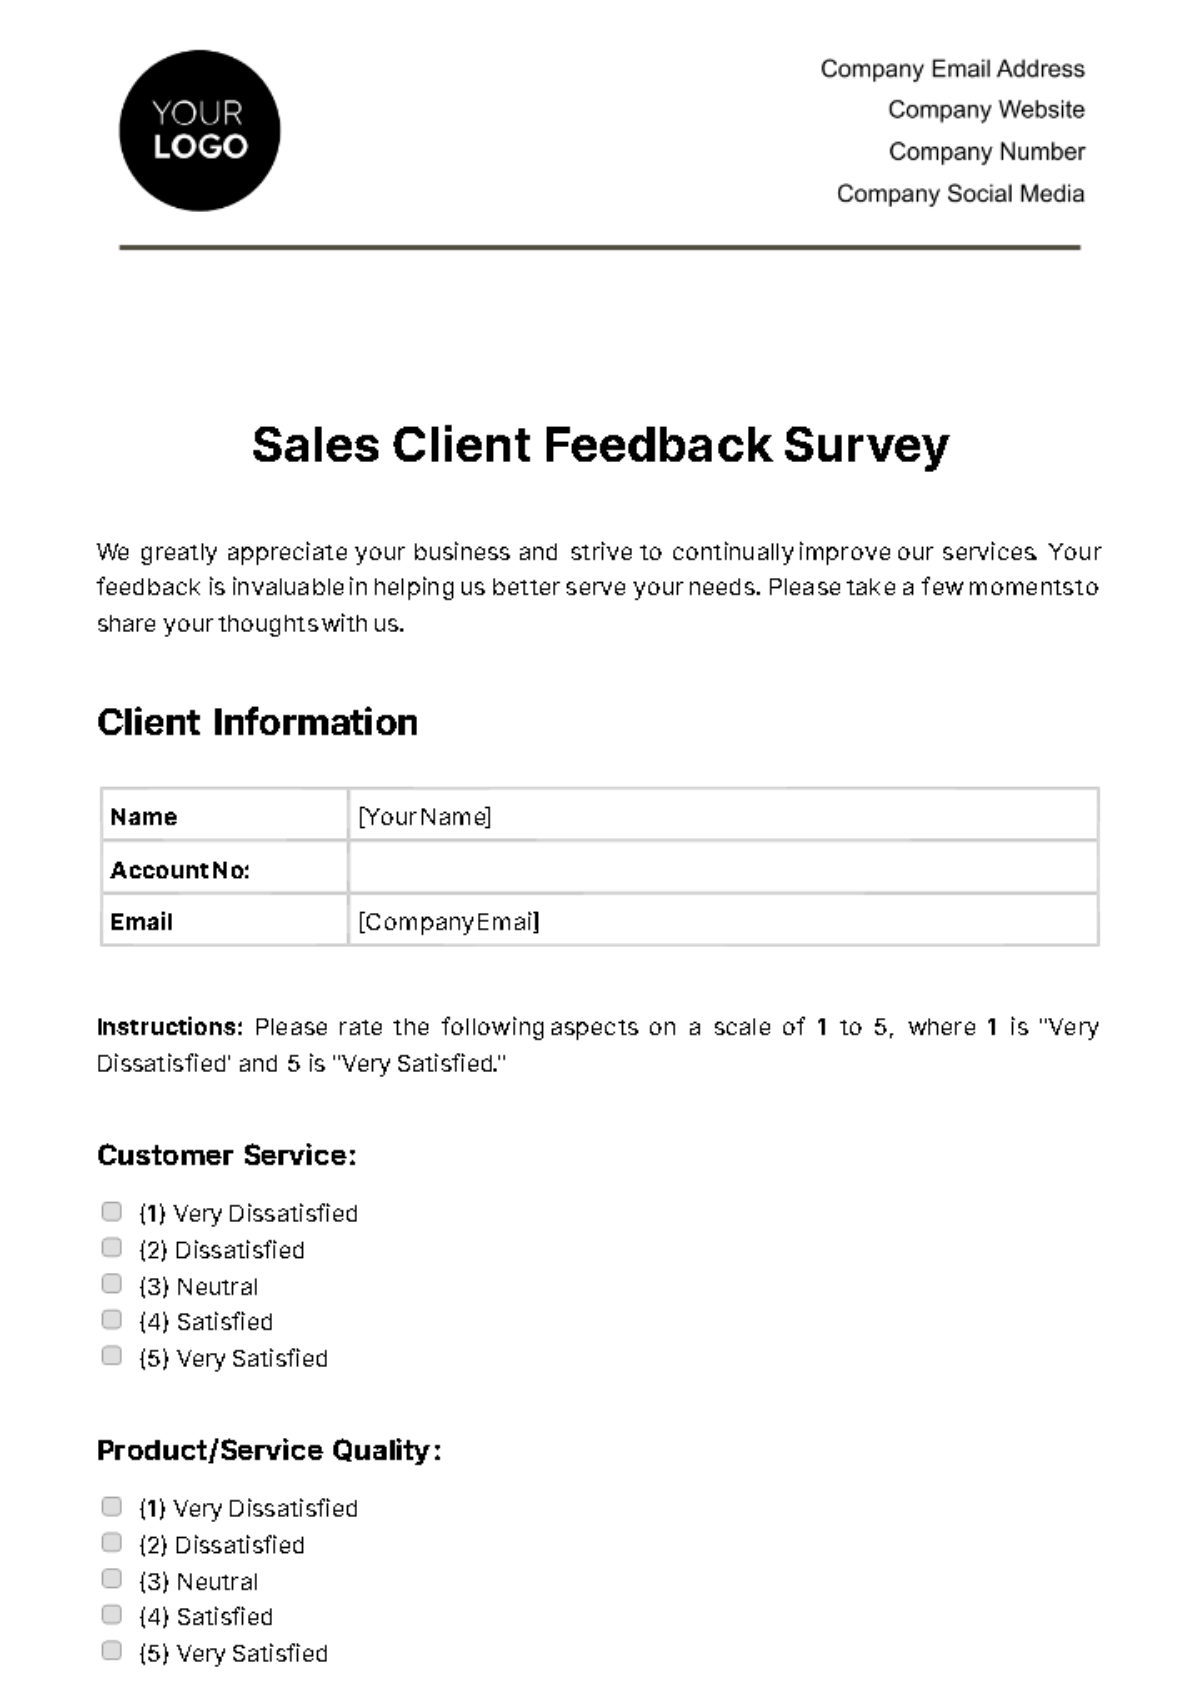
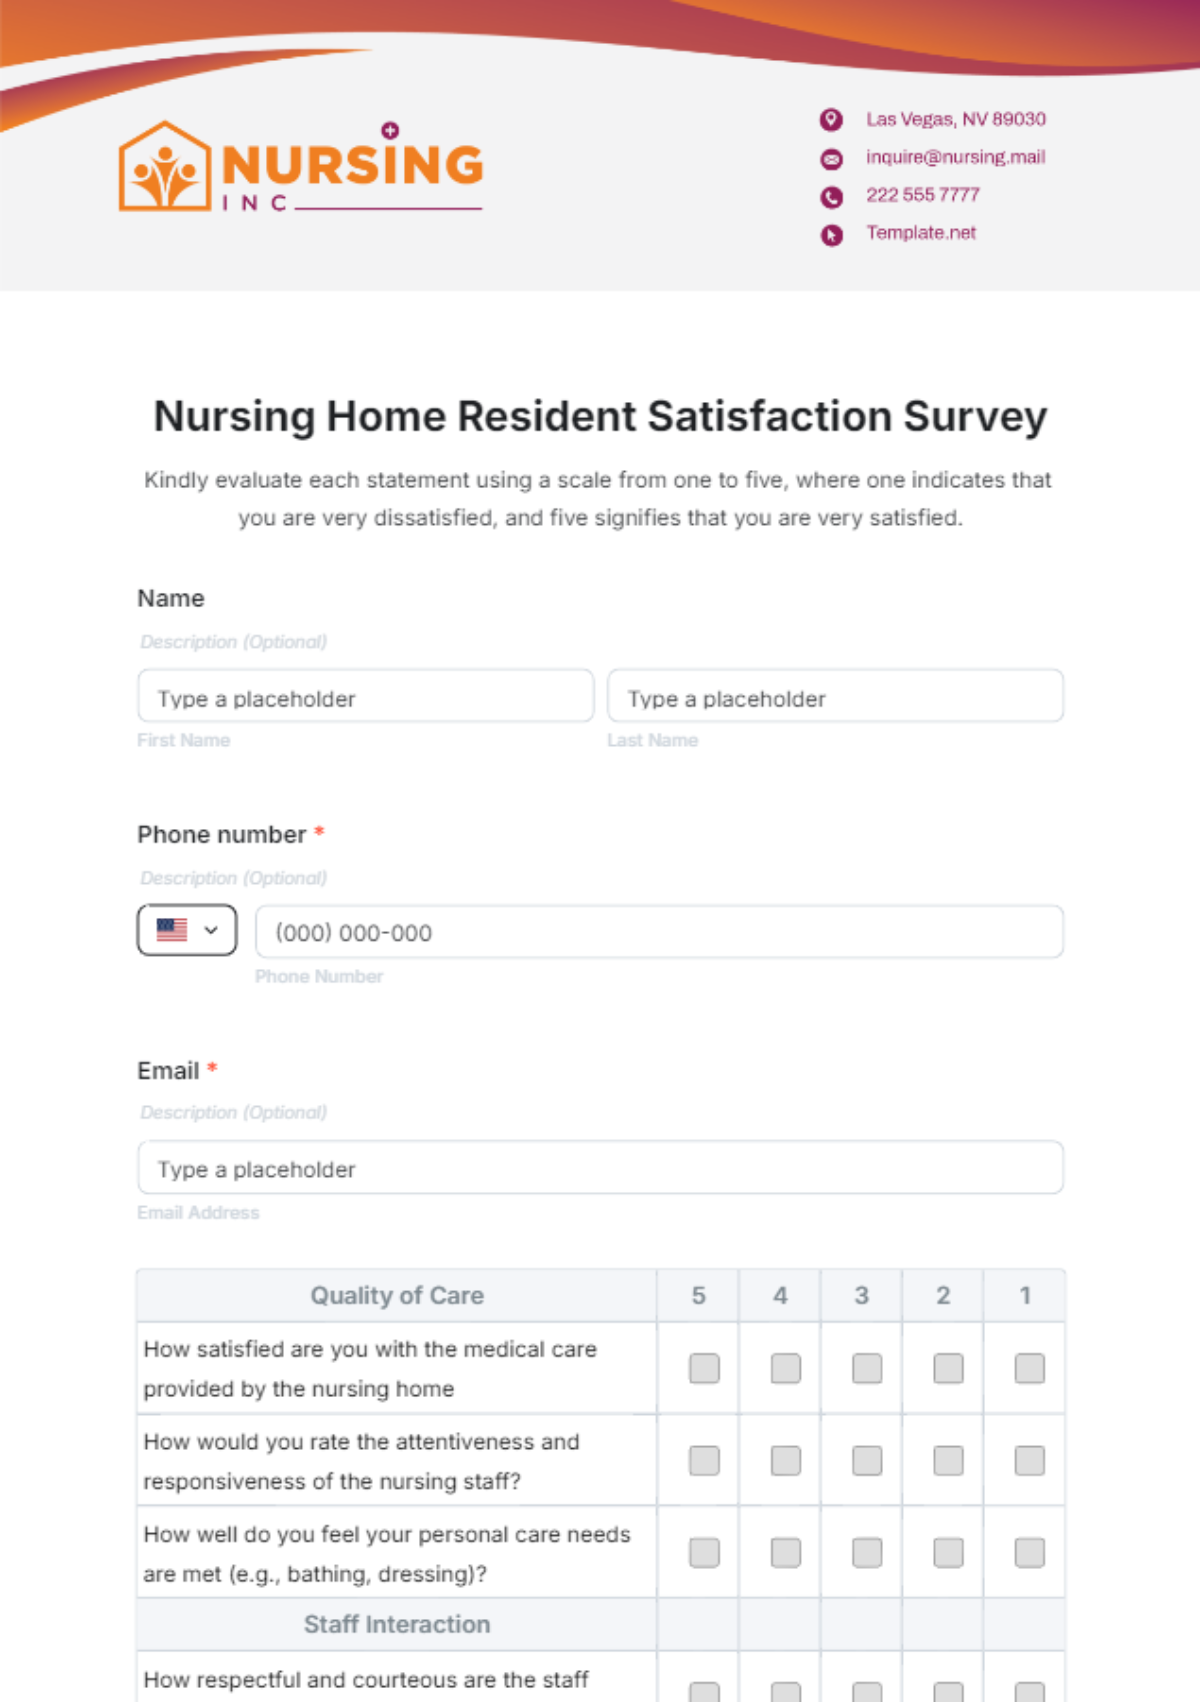
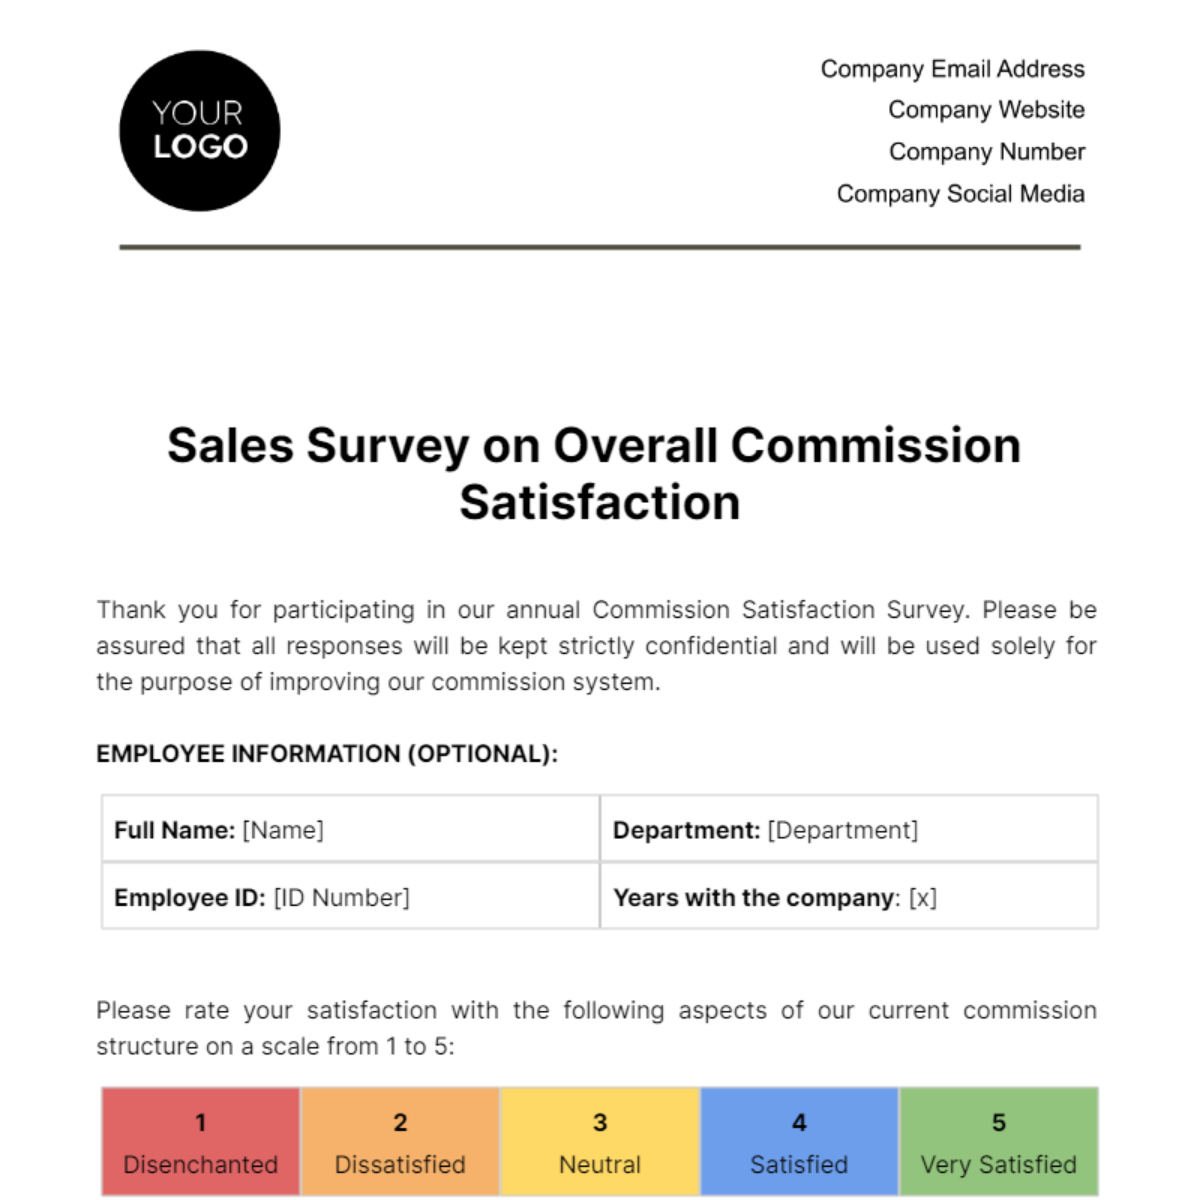
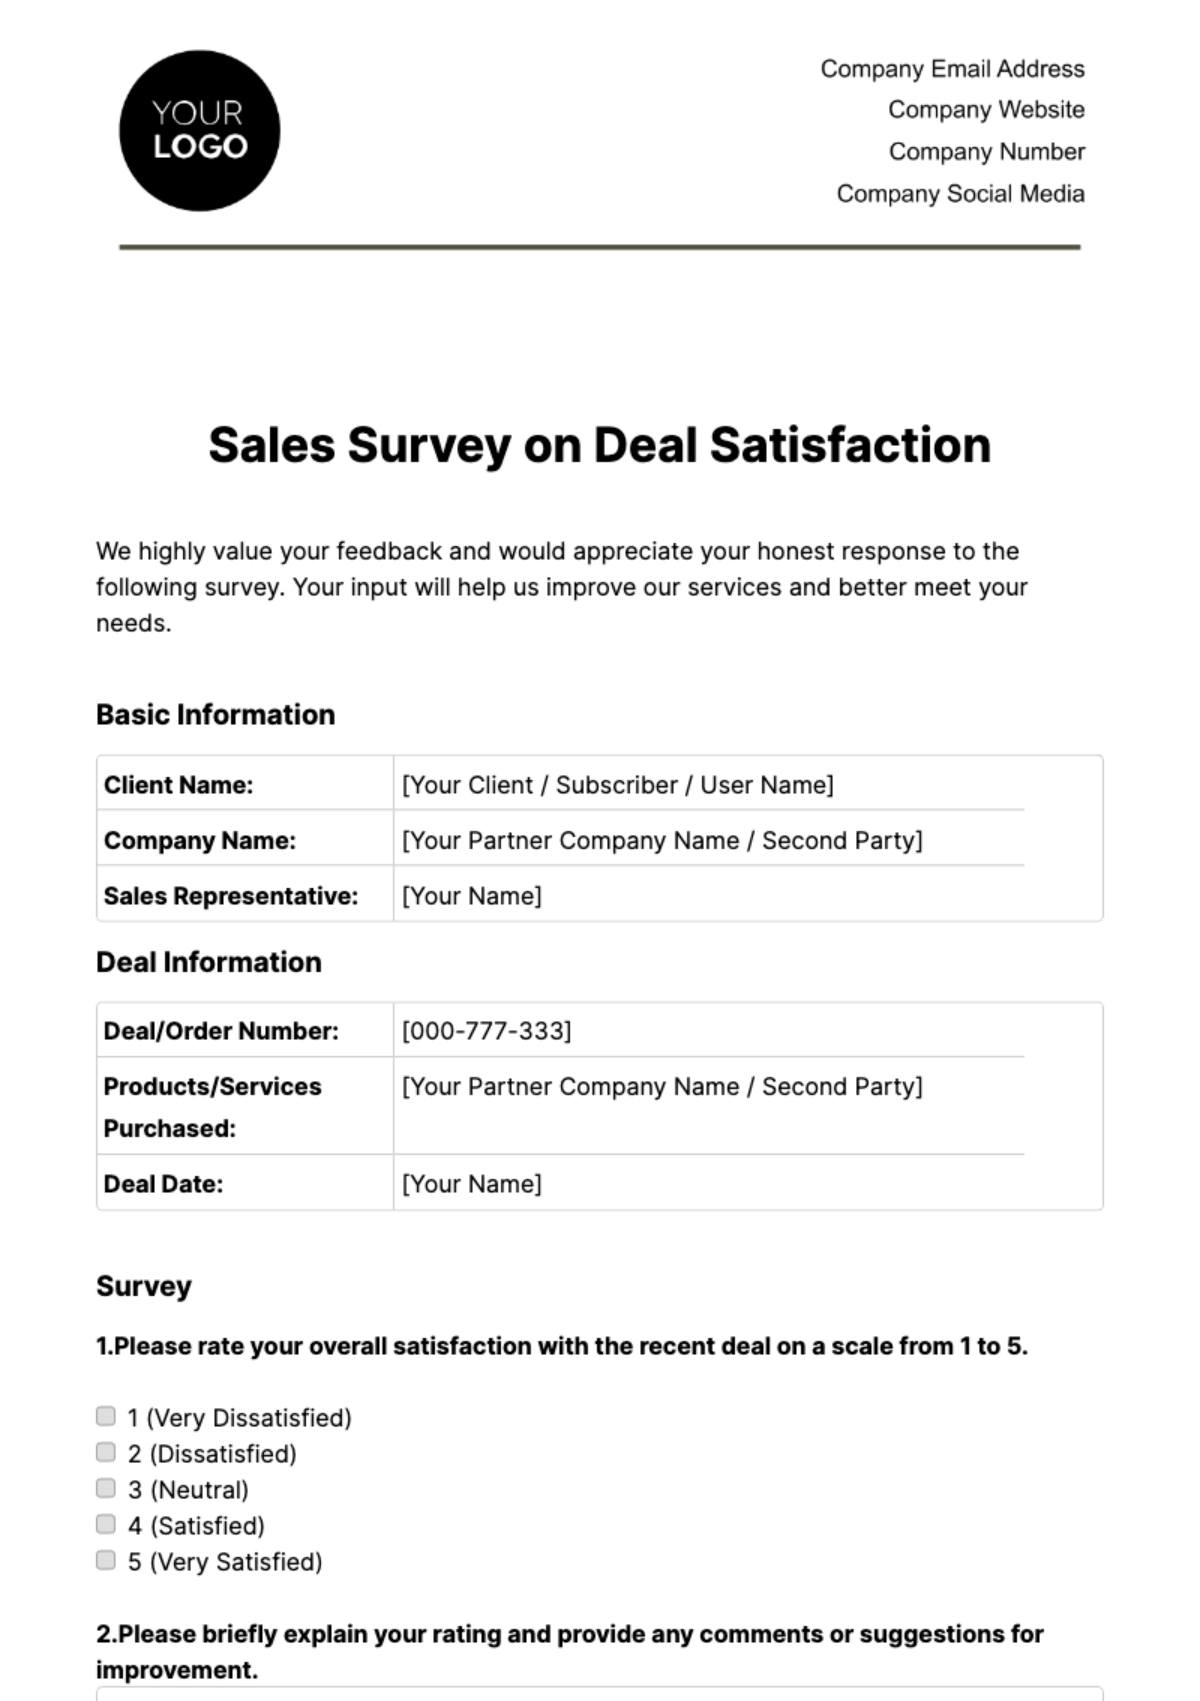
The survey comprised 25 questions designed to gauge customer satisfaction across several key dimensions: product quality, customer service, value for money, and post-purchase support. A Likert scale was used to capture responses, ranging from 1 (very dissatisfied) to 5 (very satisfied).
Findings and Analysis
Overall Satisfaction
The overall customer satisfaction rating was a 4.2 out of 5, indicating a generally positive perception among customers.
Product Quality
With an average score of 4.5, product quality emerged as the highest-rated dimension. Customers frequently highlighted the durability and functionality of our products.
Customer Service
Customer service received a score of 3.8. While most respondents appreciated the professionalism of our staff, there were suggestions for reducing response times during peak hours.
Value for Money
The value for money was rated at 4.0. Customers generally feel our products are priced competitively, though some mentioned the need for additional discounts and promotional offers.
Post-Purchase Support
Post-purchase support scored 3.7, marking it as an area with room for improvement. Feedback indicated a demand for more comprehensive support documentation and easier access to technical assistance.
Demographic Insights
Age Group Analysis
Younger customers (ages 18-34) reported higher satisfaction rates, particularly appreciating the modern features and design of our products. Older customers (ages 55+) expressed the need for more straightforward instructional guides.
Regional Analysis
Customers from urban areas generally reported higher satisfaction levels. In contrast, those from rural regions rated our services slightly lower, primarily due to longer service delivery times.
Recommendations
Enhance Customer Service
Implement advanced training sessions for customer service representatives to improve response times.
Introduce an AI-driven chatbot to handle common customer queries, thereby reducing manual workload.
Improve Post-Purchase Support
Create more detailed and user-friendly online support resources, including how-to videos and FAQs.
Establish a dedicated support hotline for complex technical issues.
Develop Targeted Promotions
Offer exclusive discounts for new product lines to repeat customers.
Implement a loyalty program to reward long-term customers.
Conclusion
Overall, the customer satisfaction survey has provided valuable insights into the current state of customer perceptions. While the findings indicate that customers generally hold our products and services in high regard, there are clear opportunities for enhancement in customer service and post-purchase support. By addressing these areas, we can ensure even higher levels of satisfaction and loyalty among our customer base.
Dimension | Average Rating |
|---|---|
Overall Satisfaction | 4.2 |
Product Quality | 4.5 |
Customer Service | 3.8 |
Value for Money | 4.0 |
Post-Purchase Support | 3.7 |
