Survey Results Report
Introduction
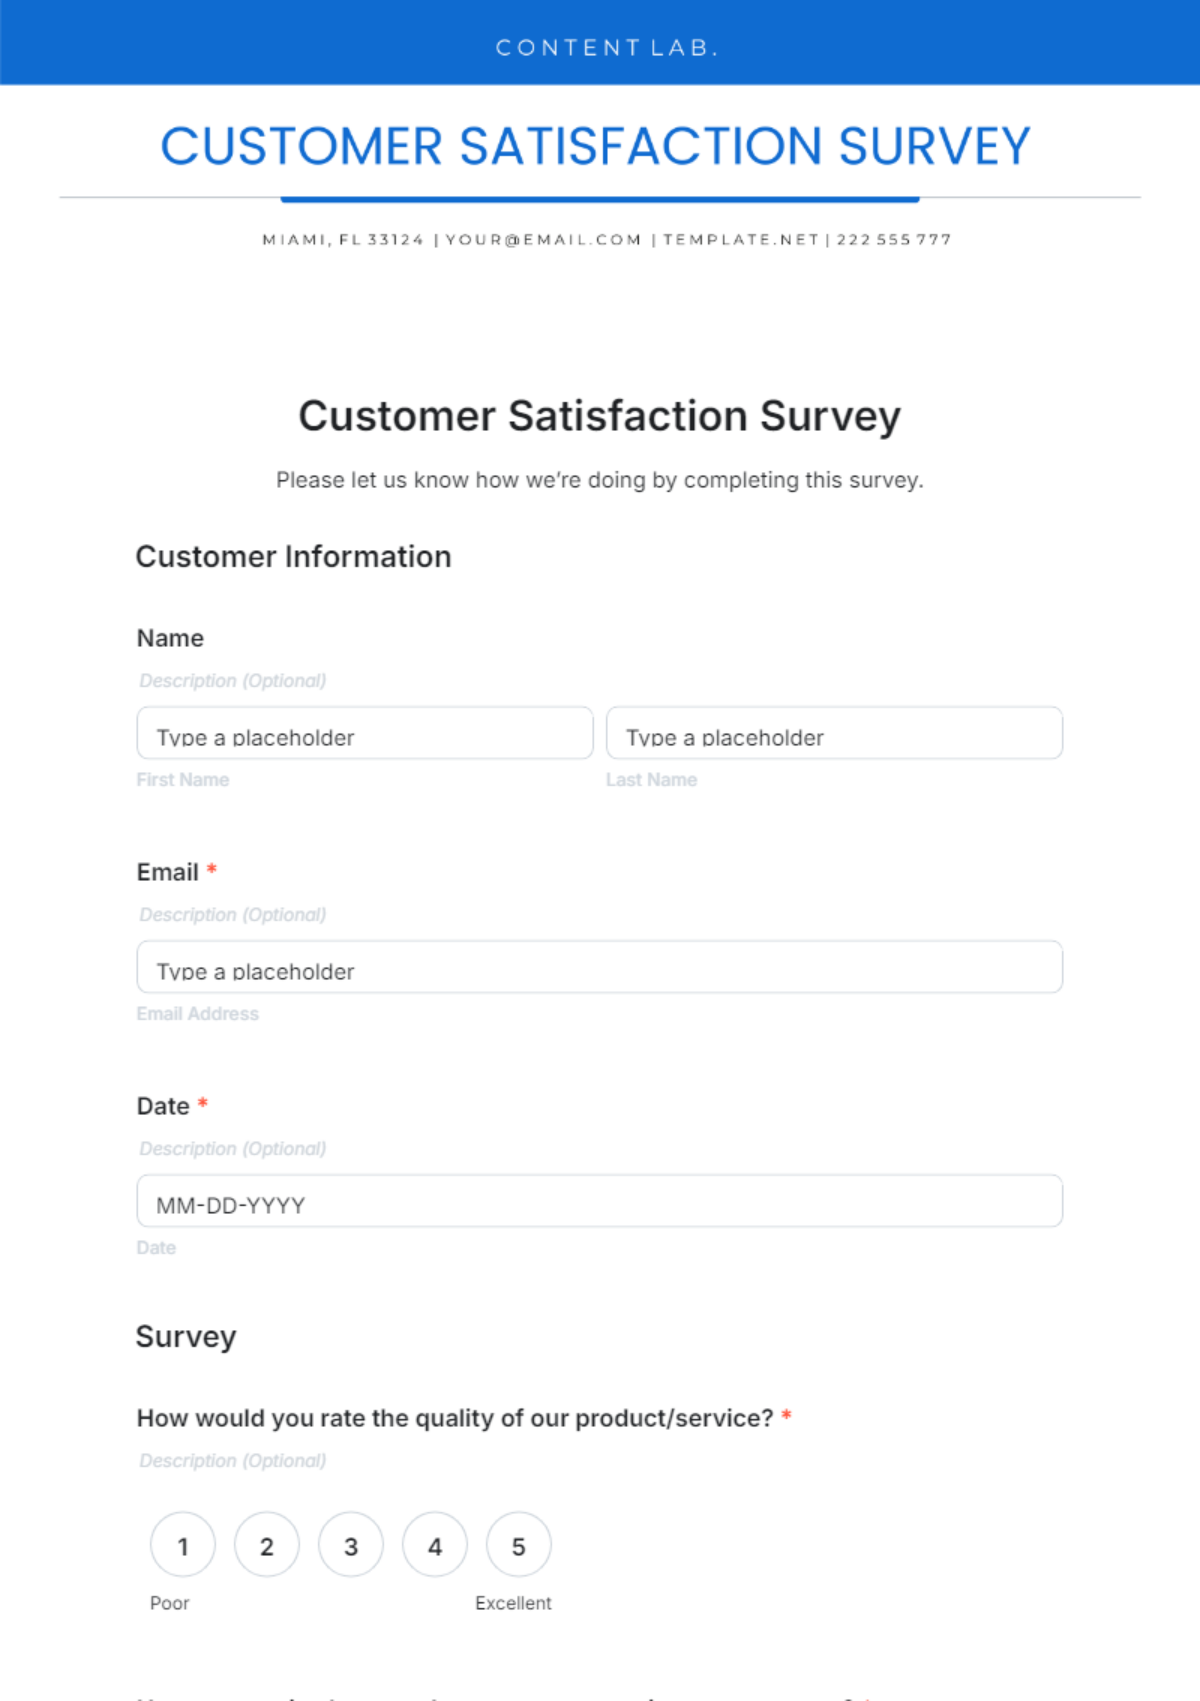
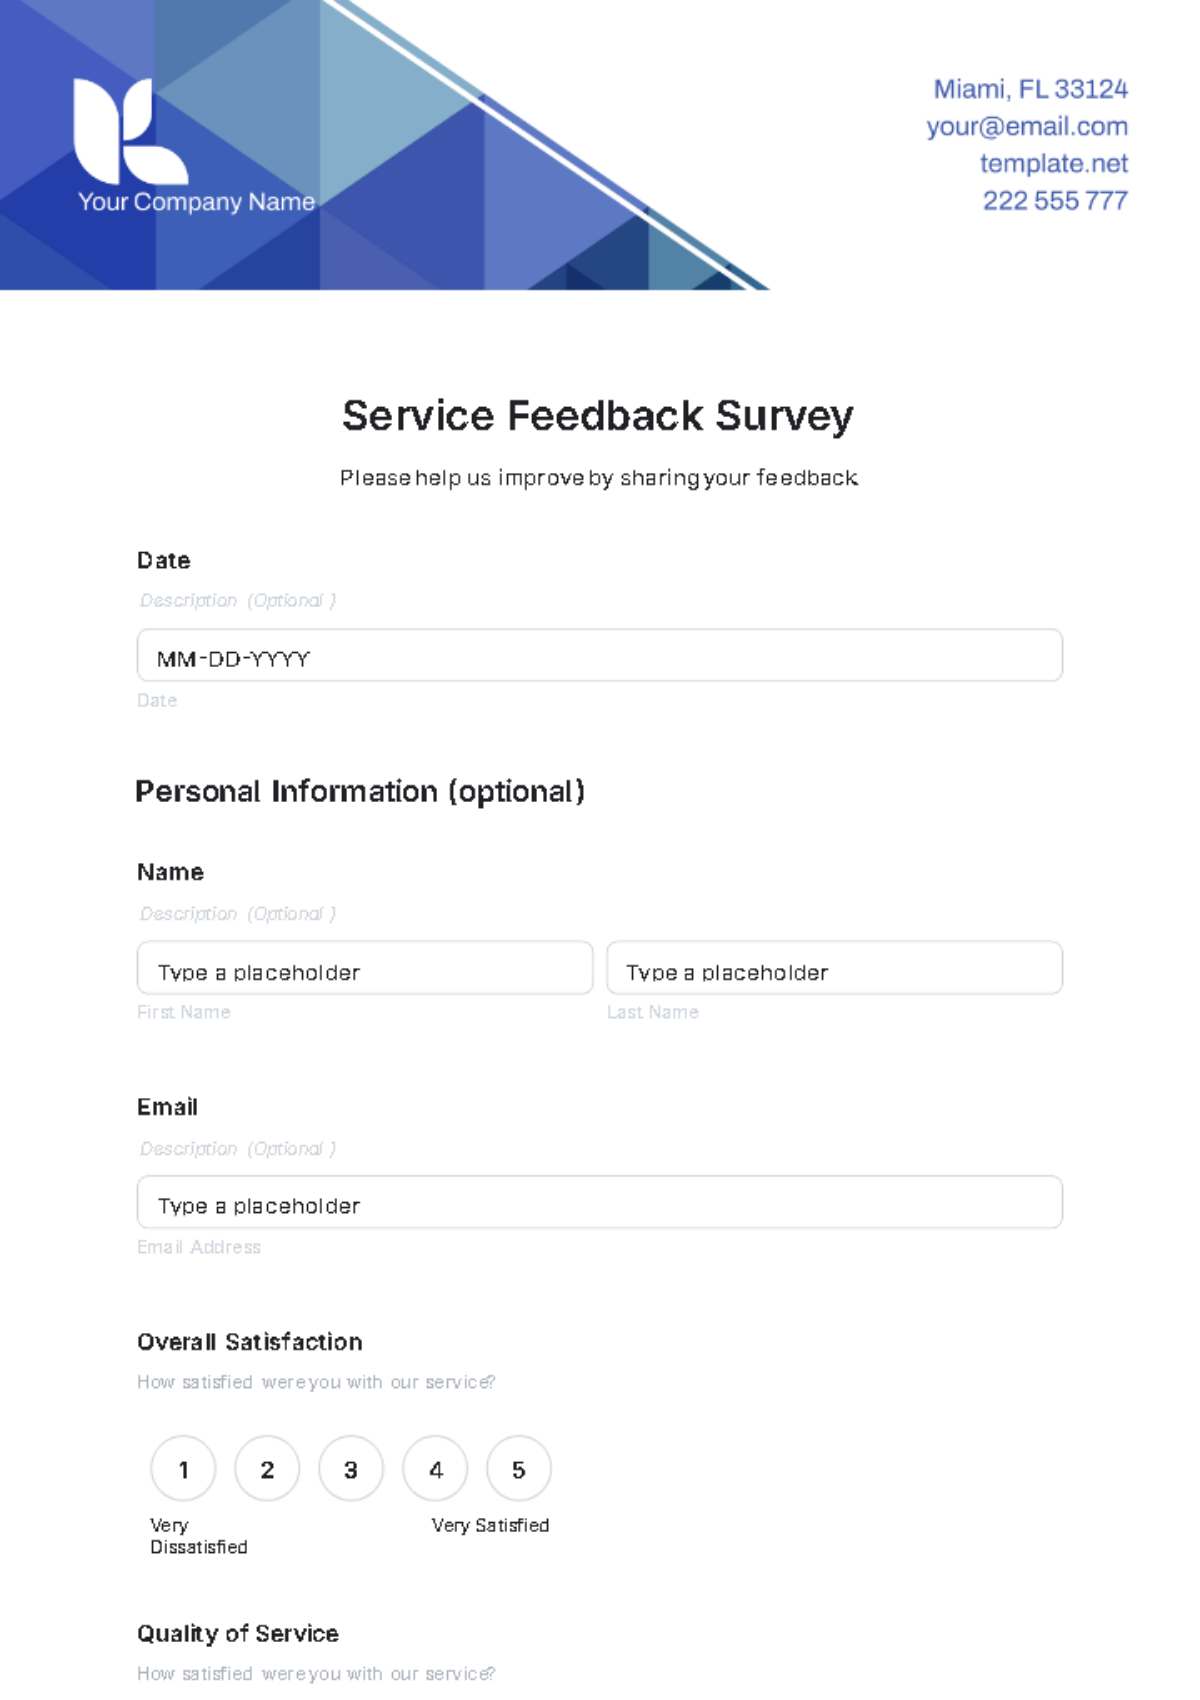
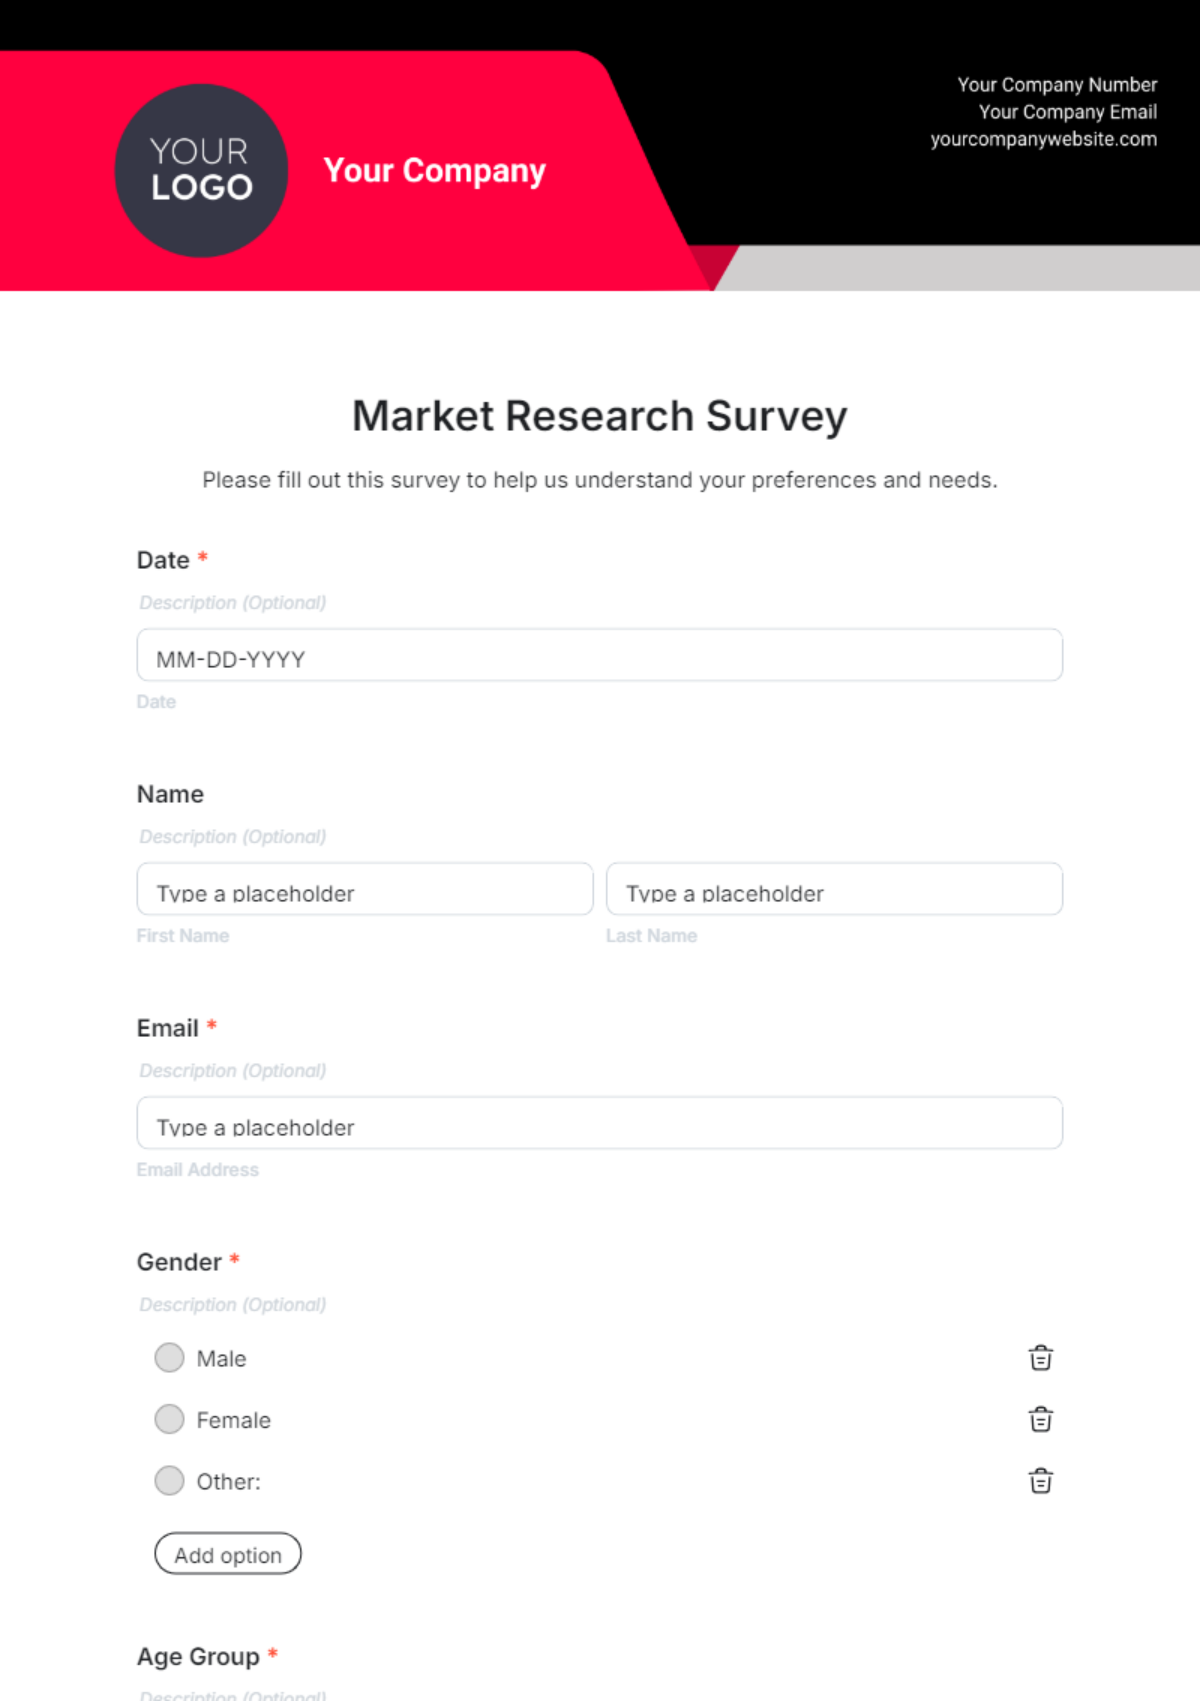
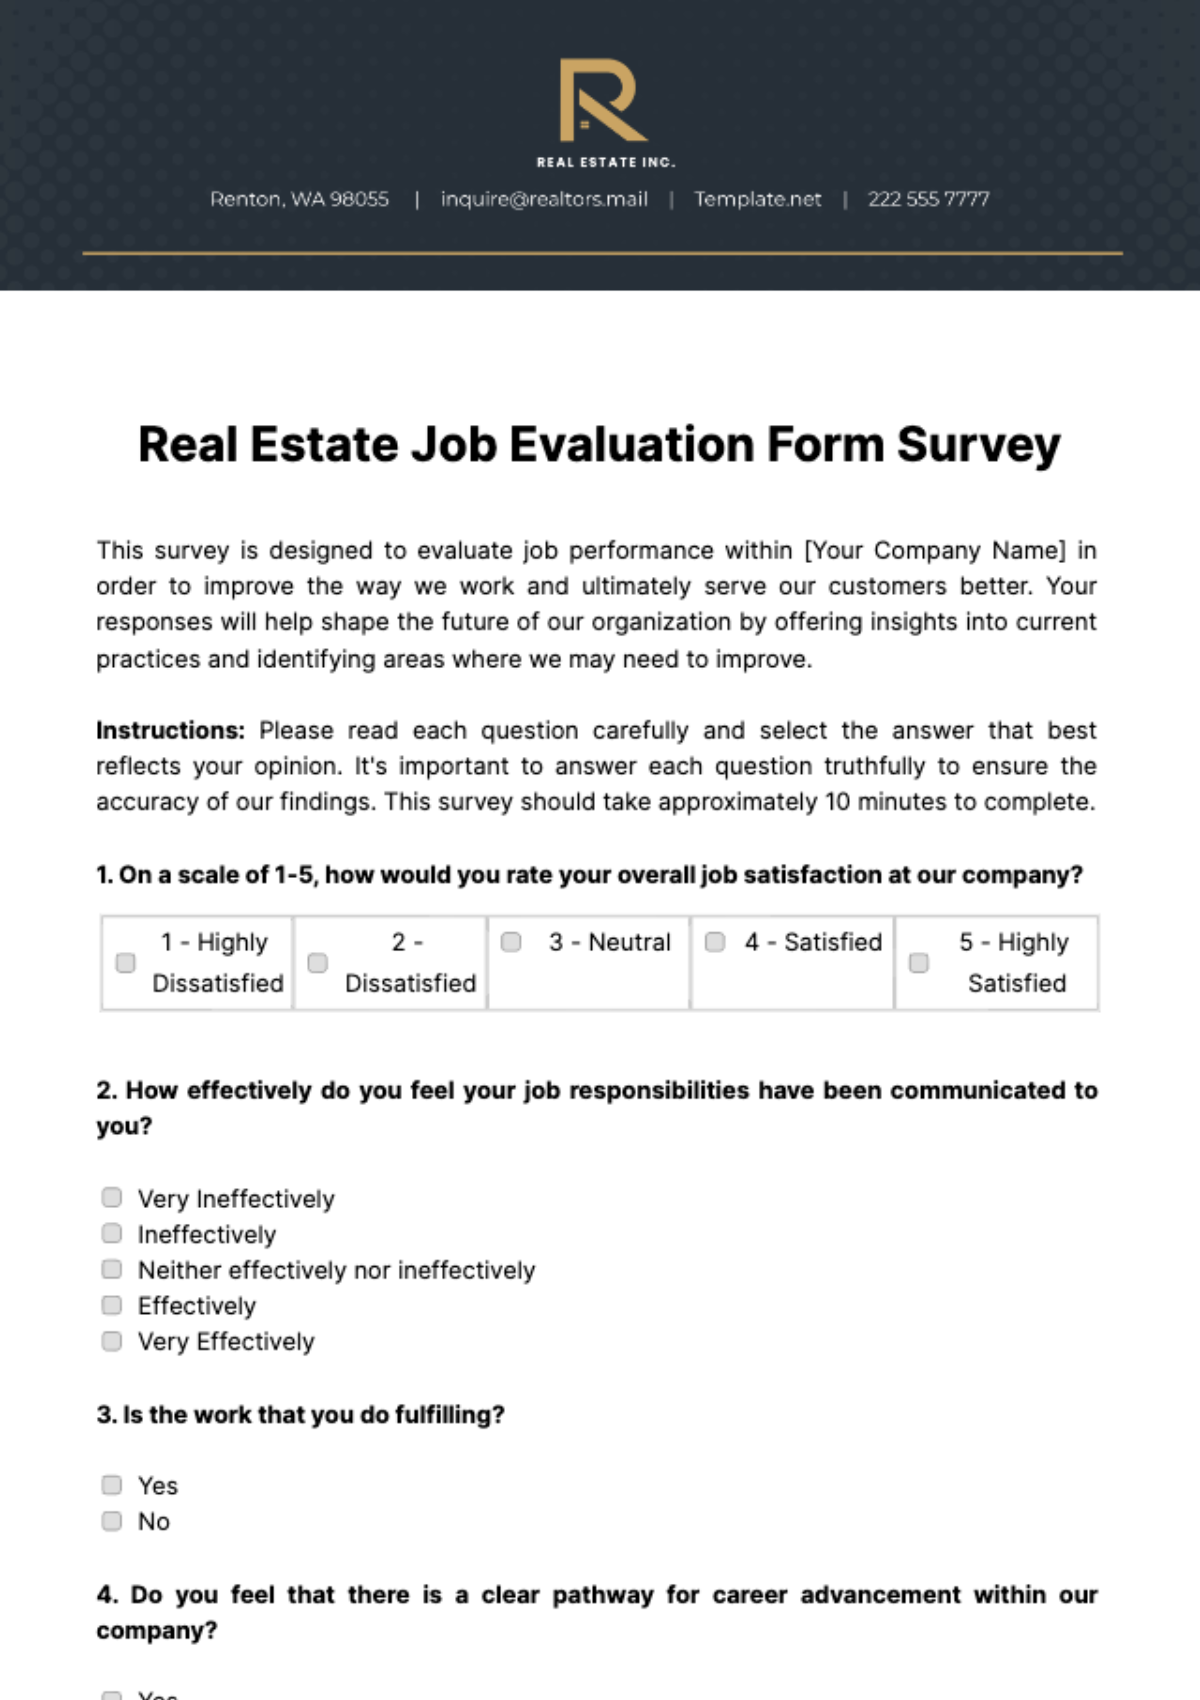
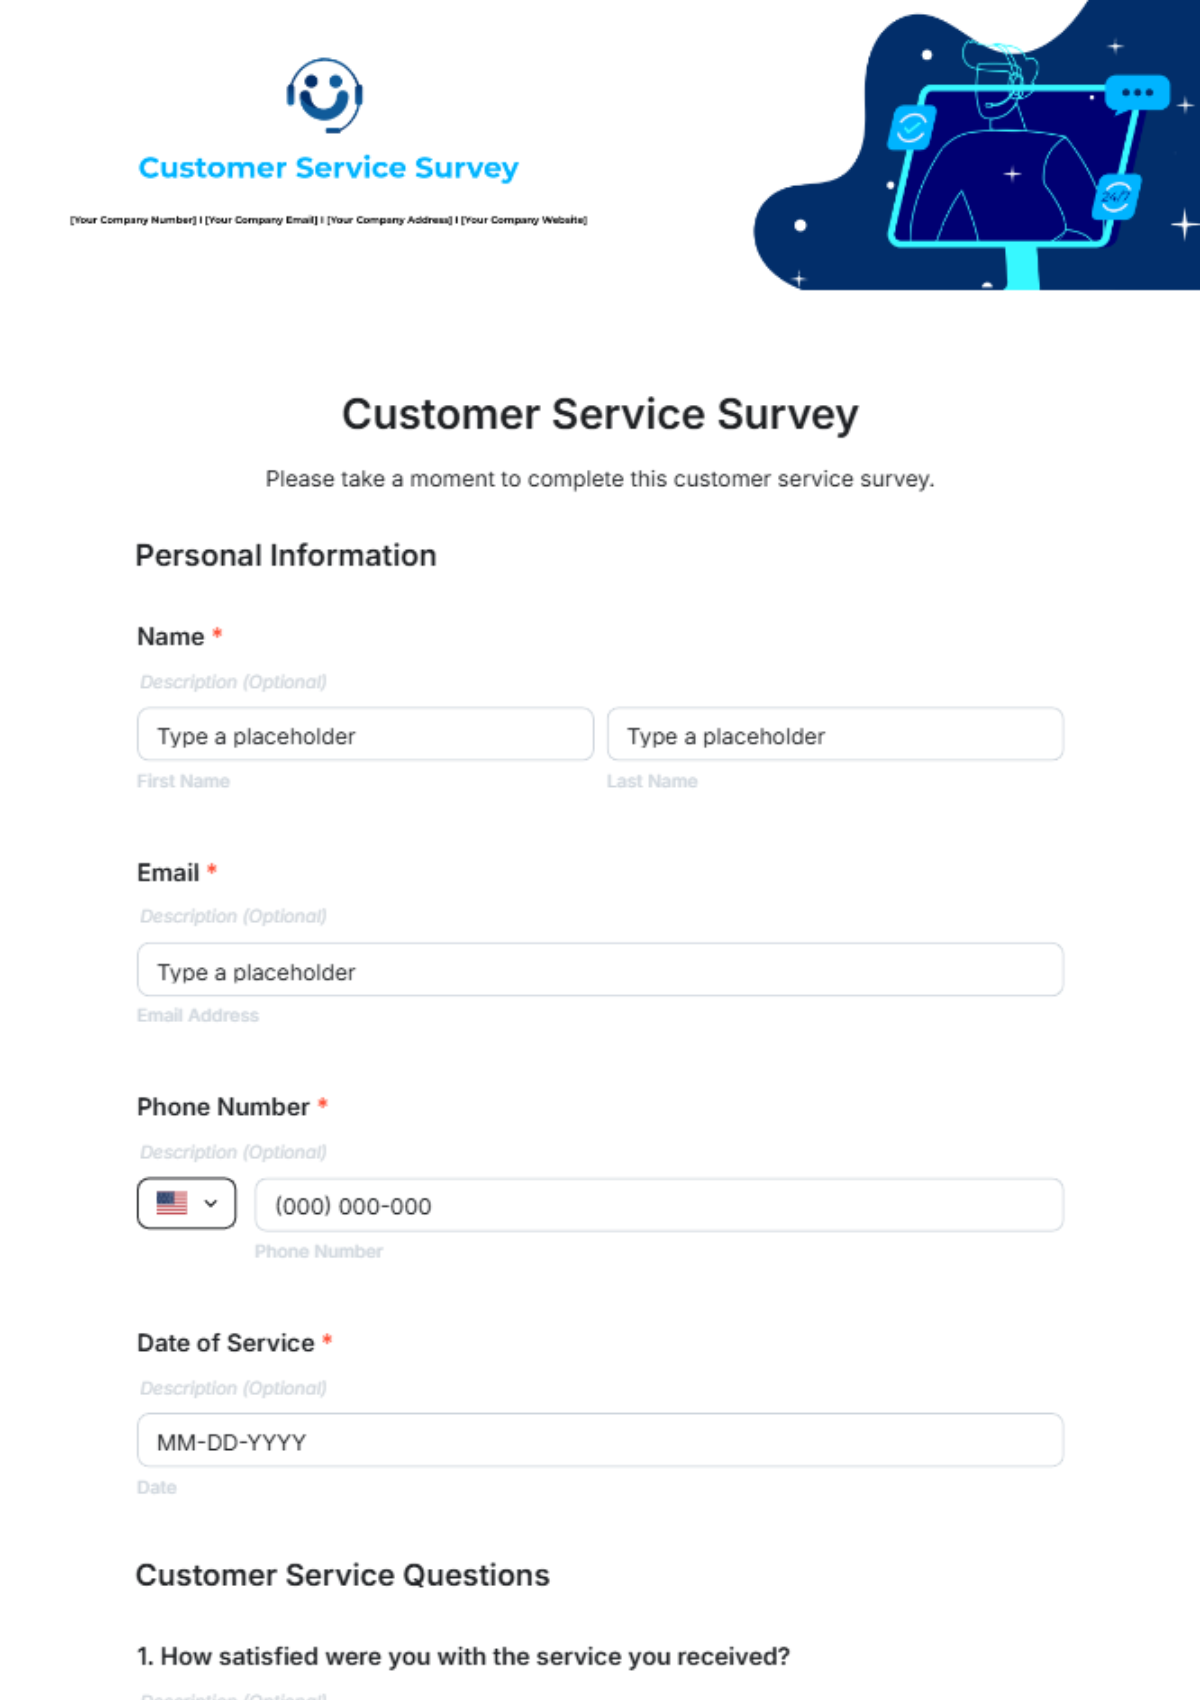
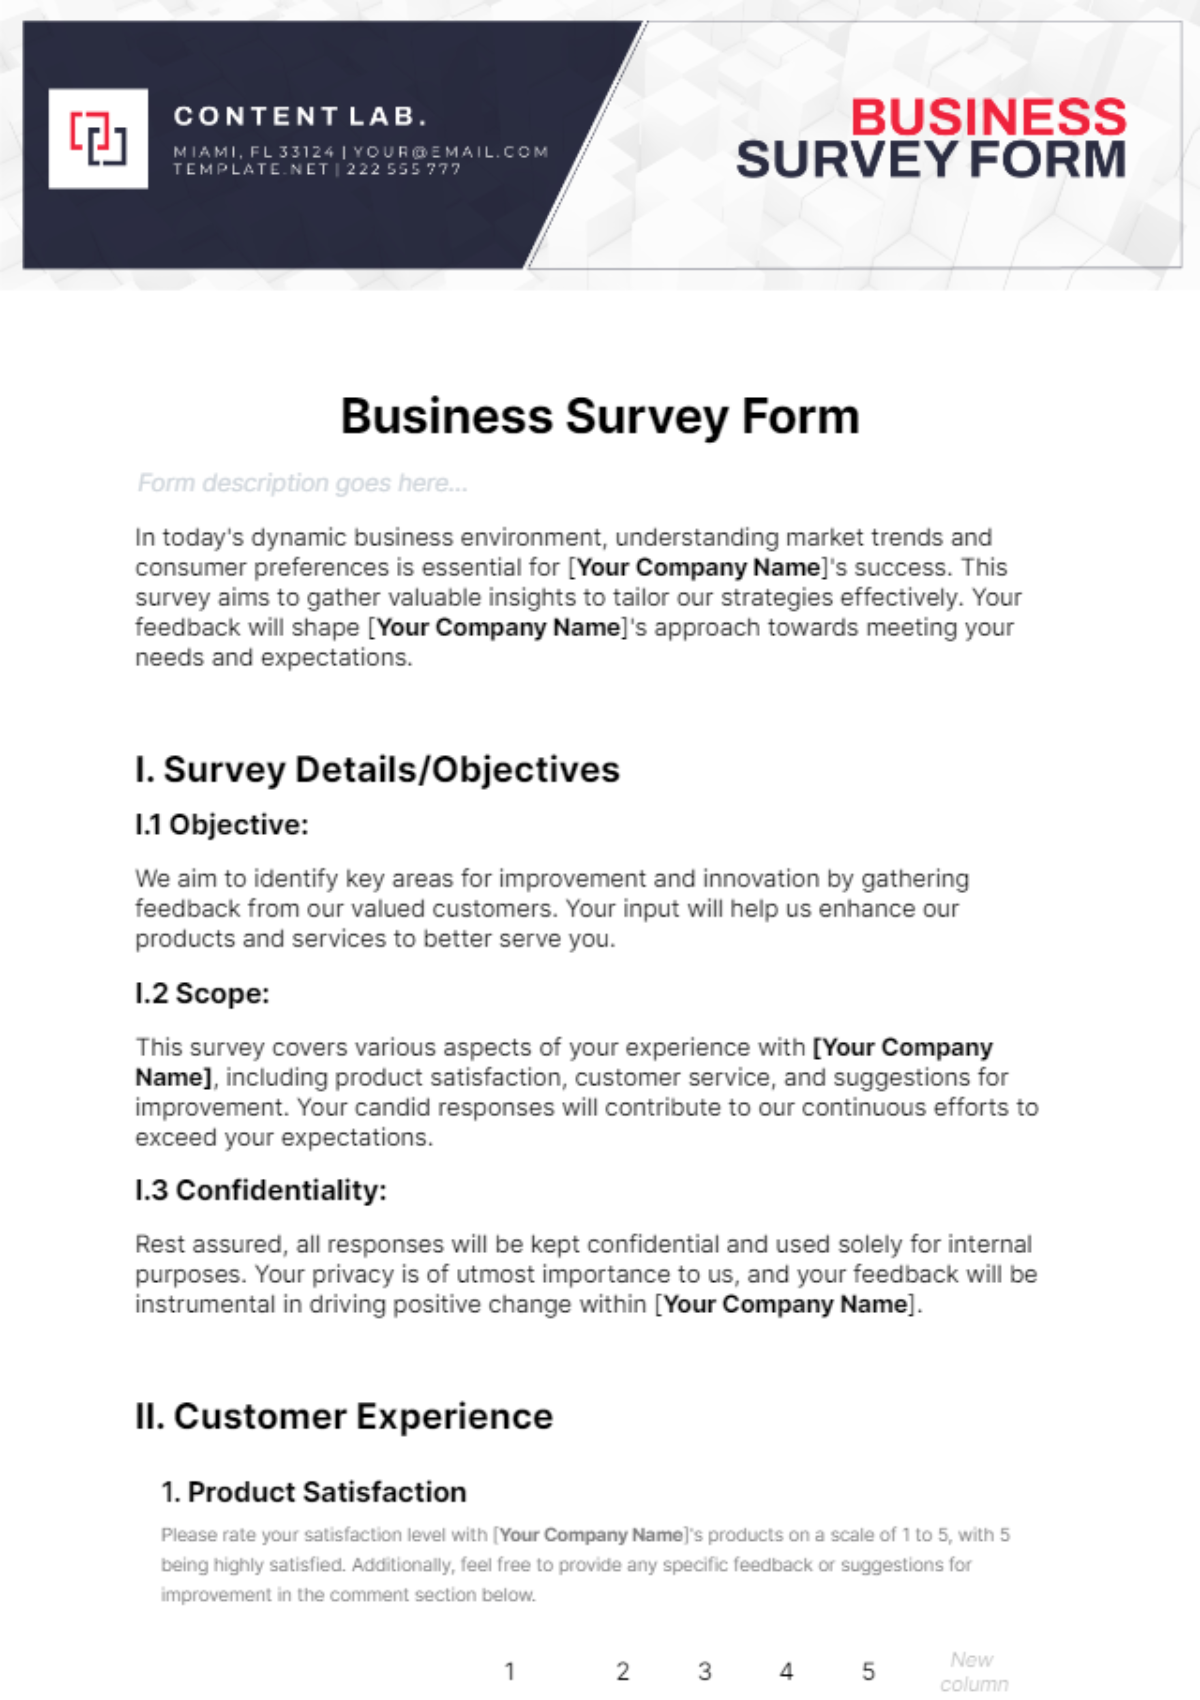
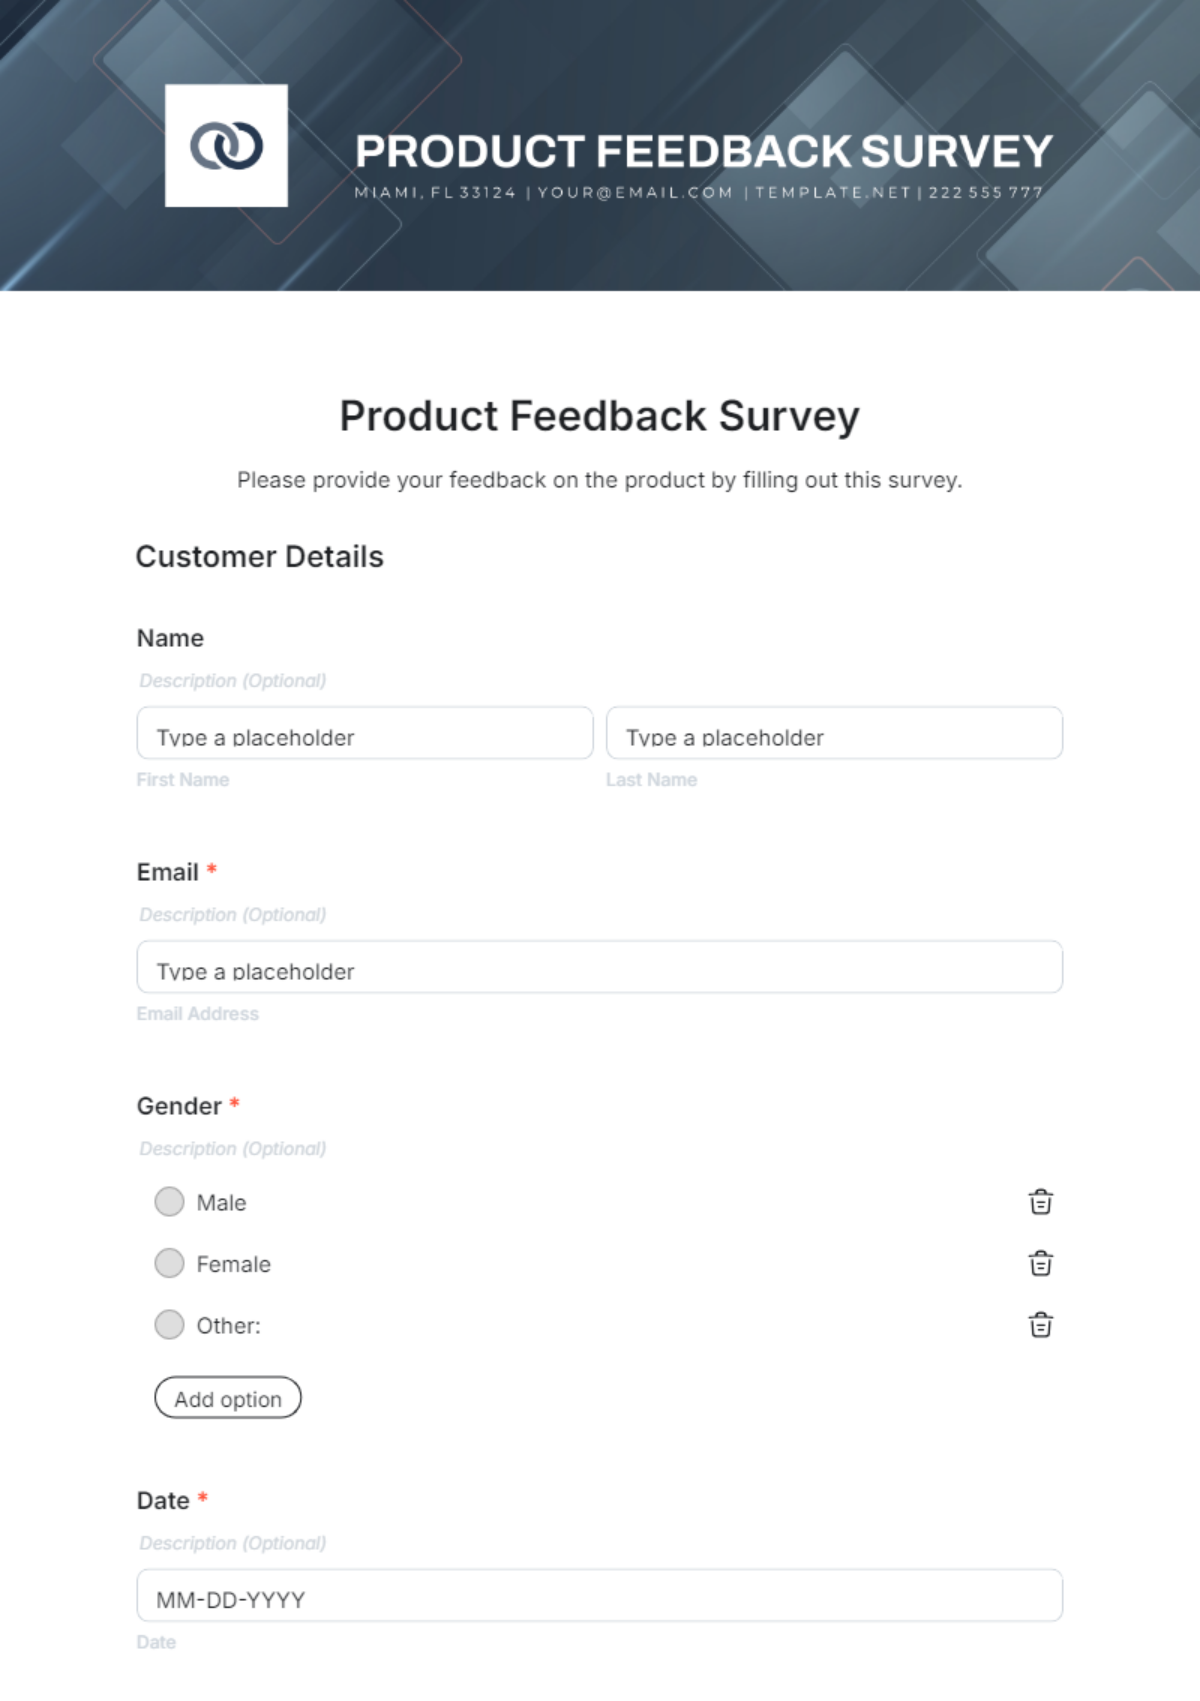
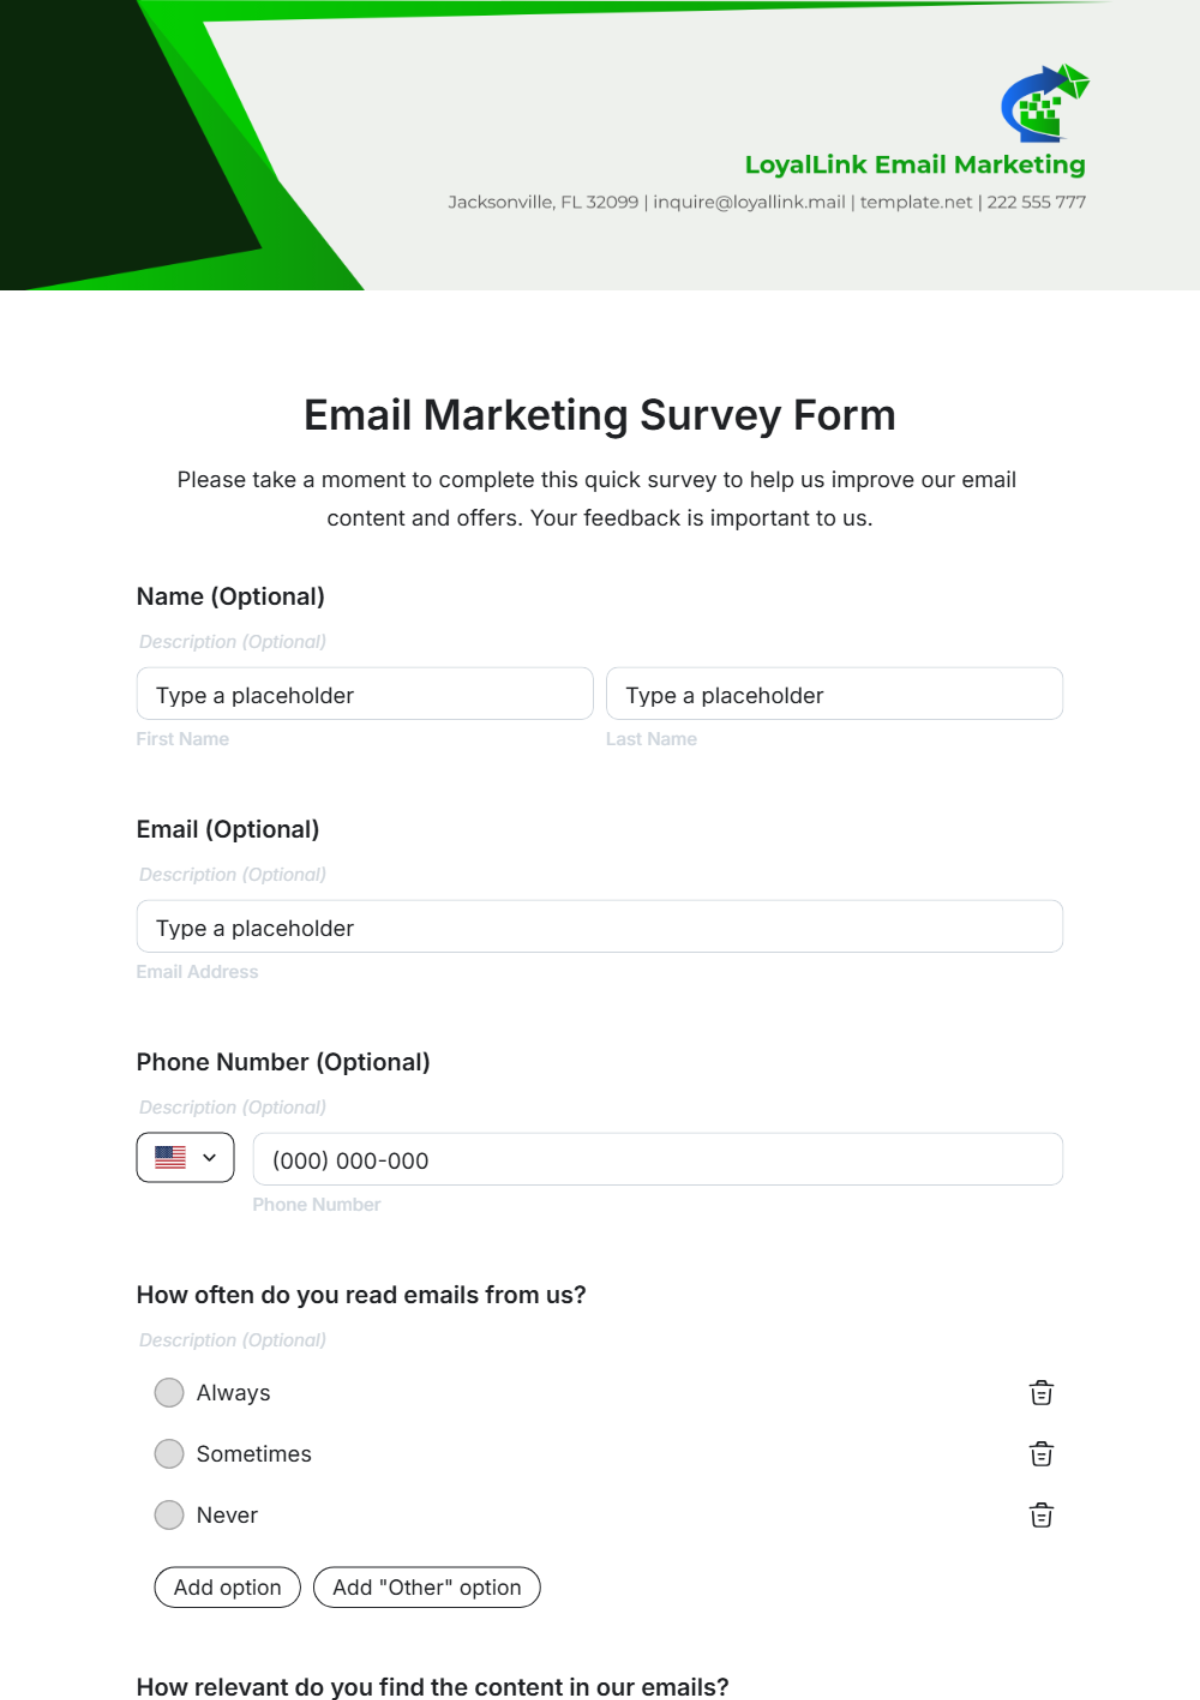
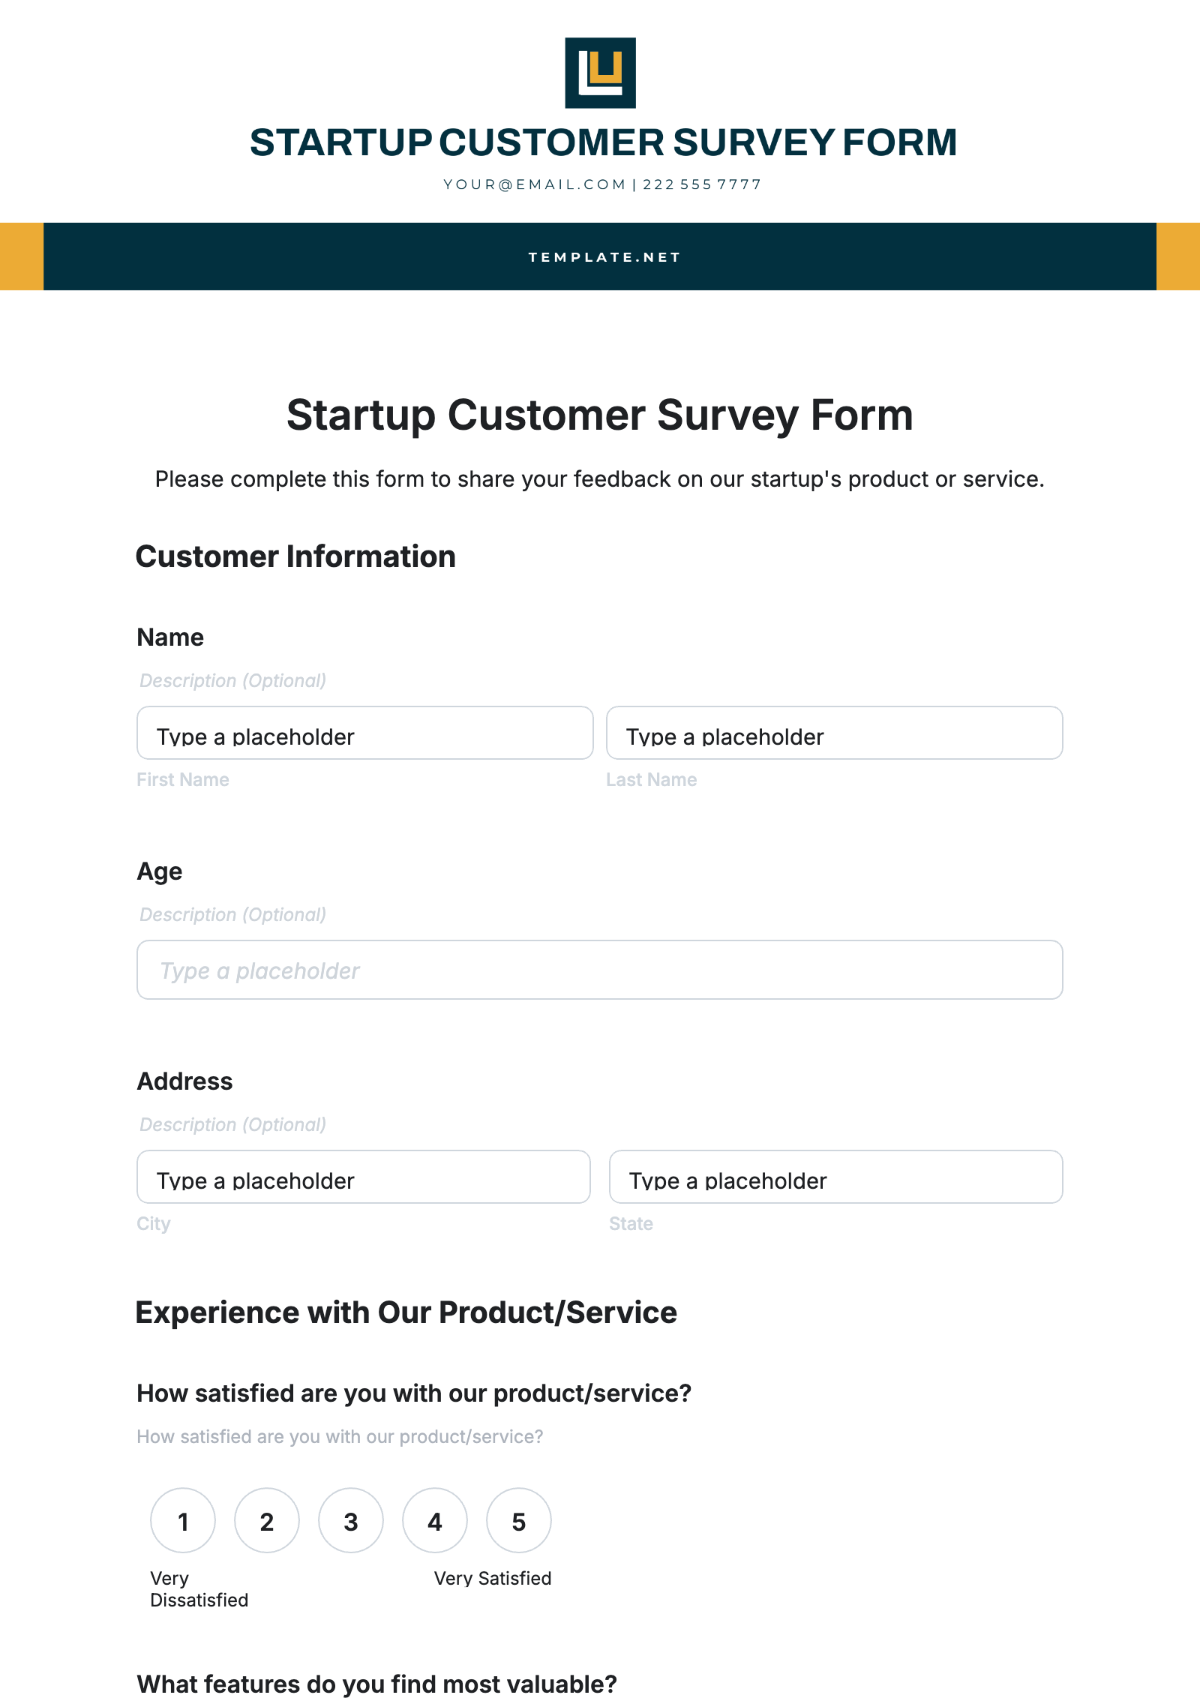
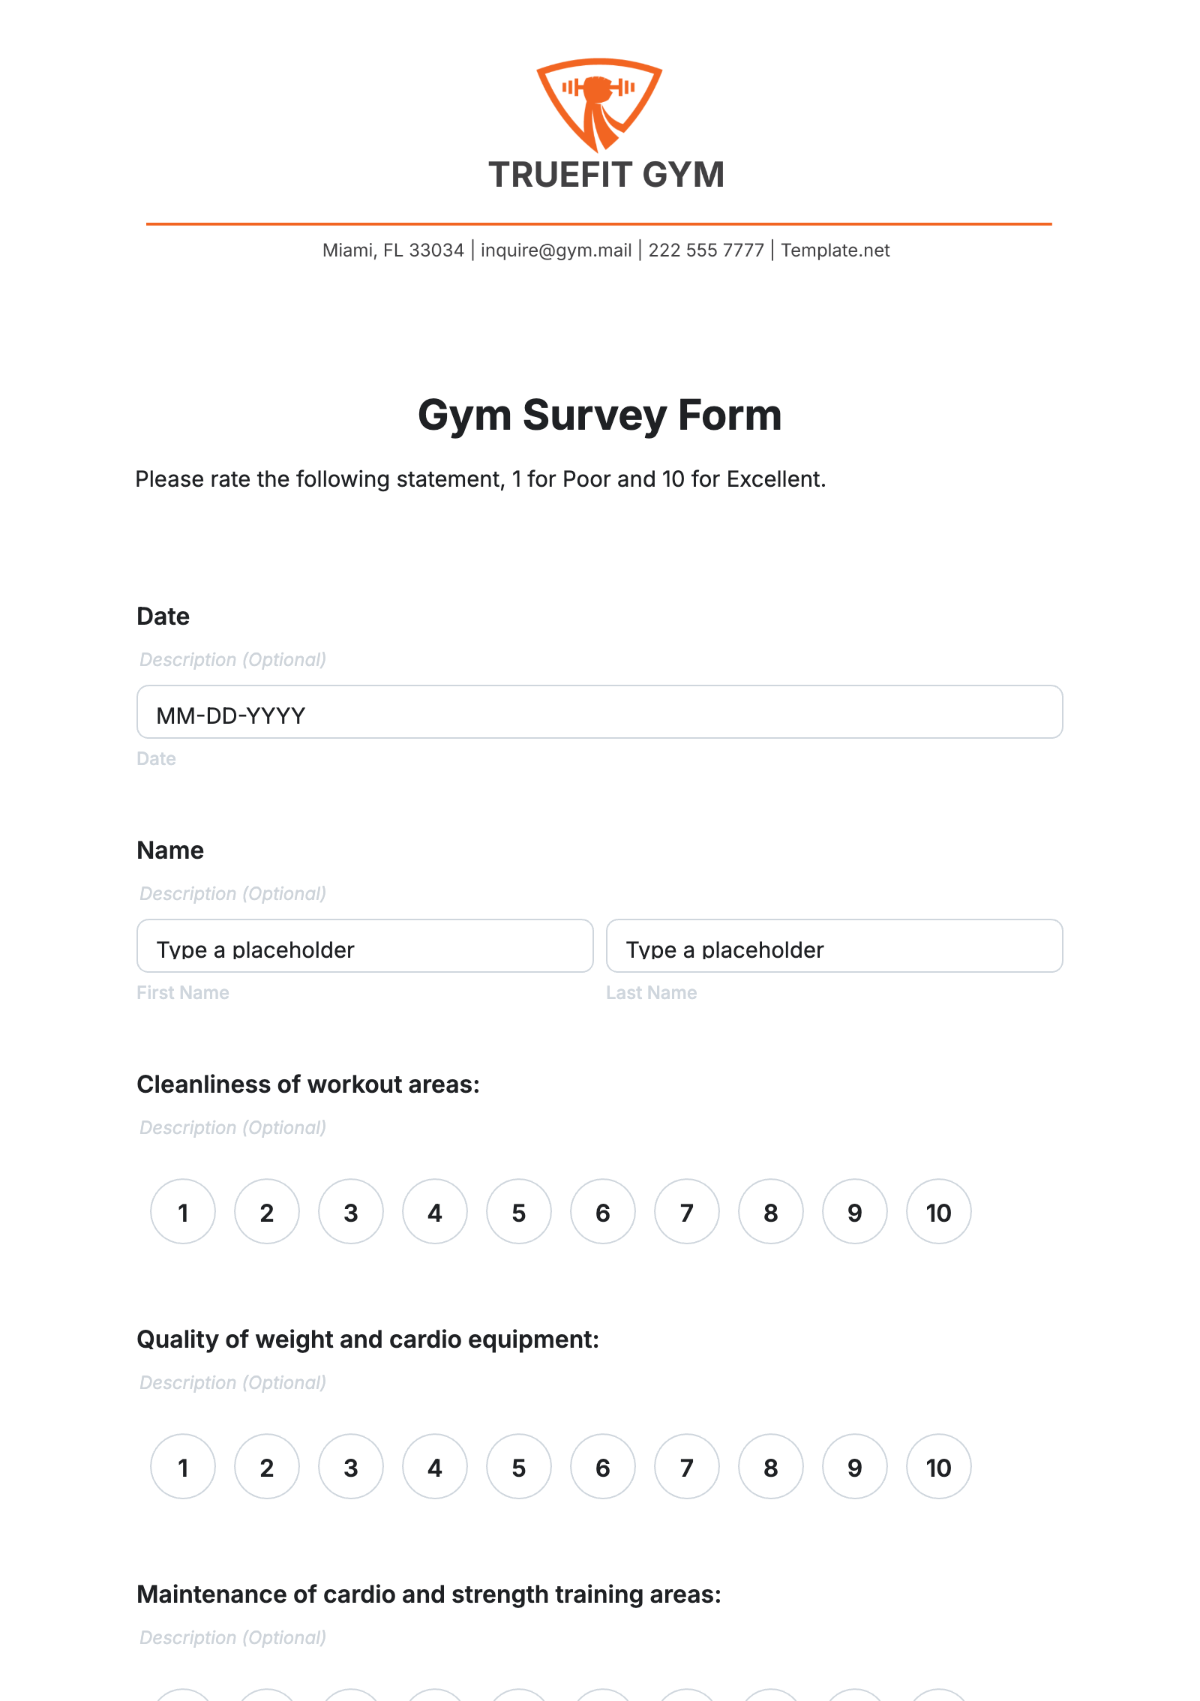
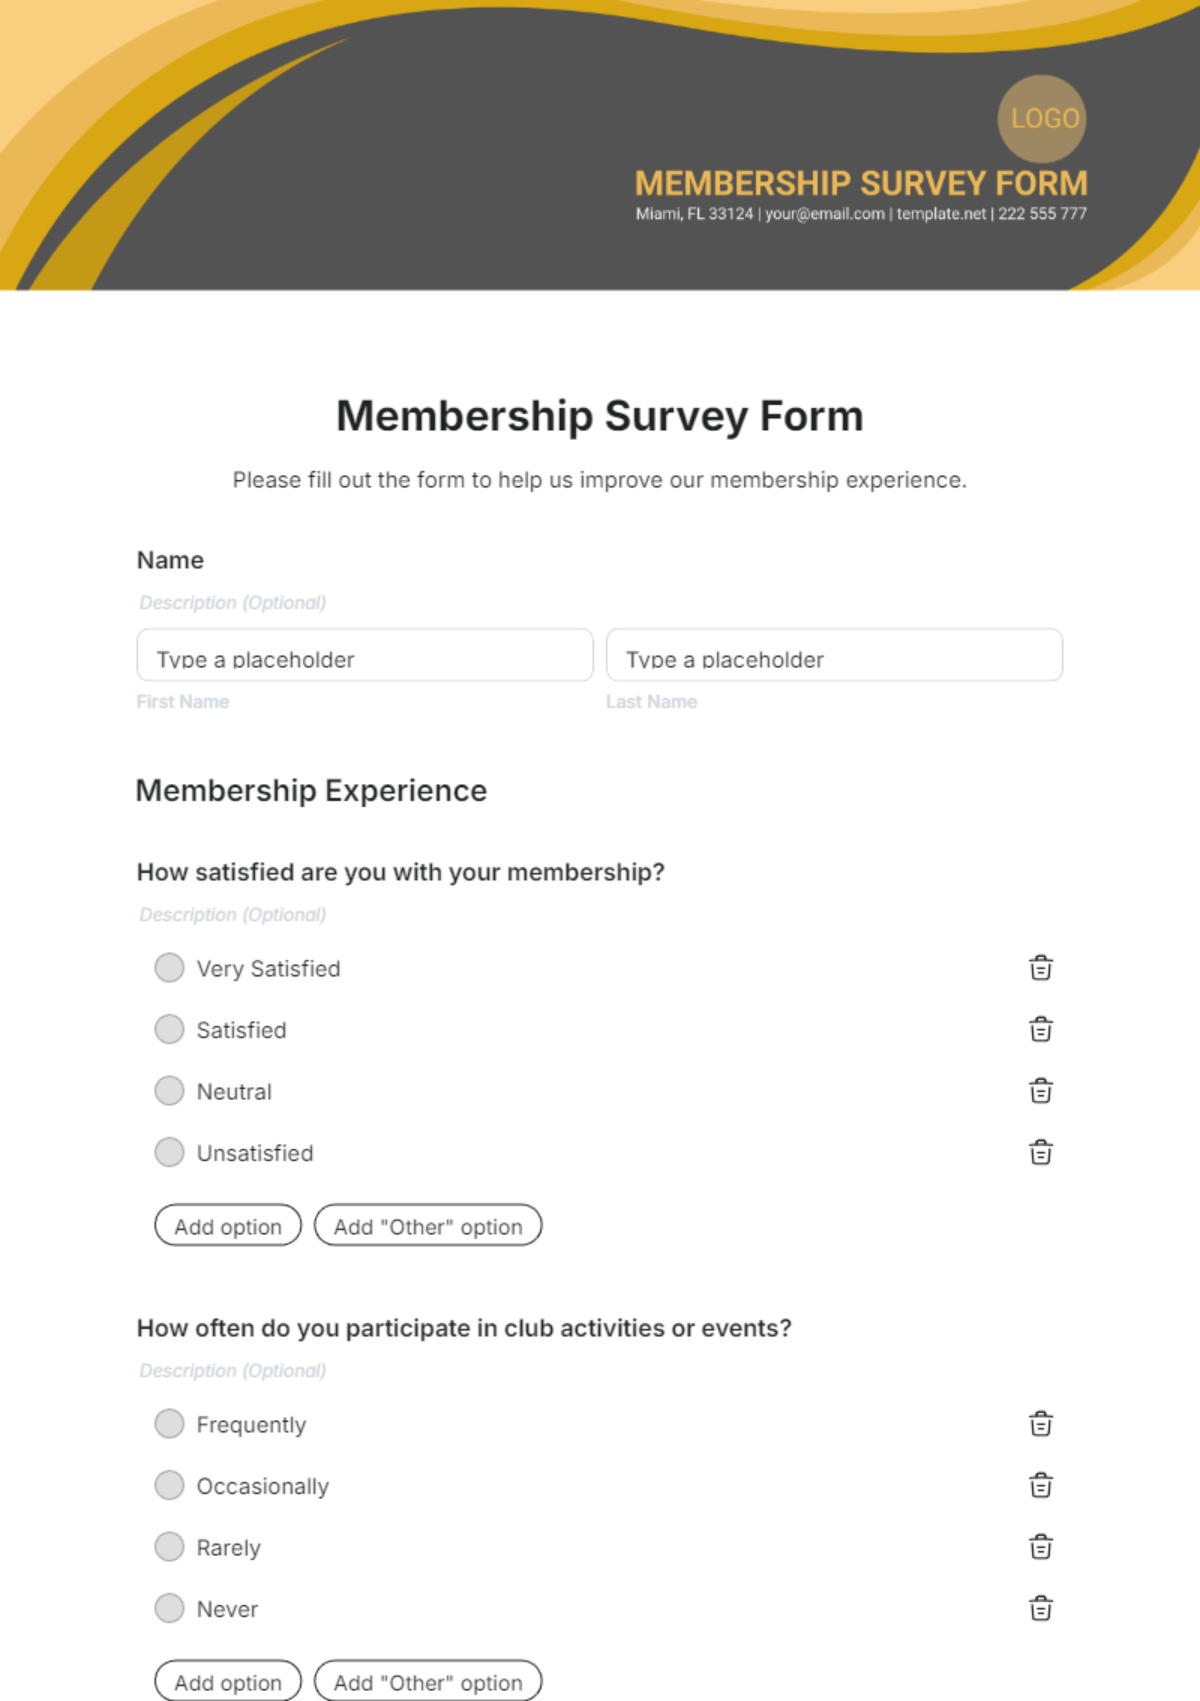
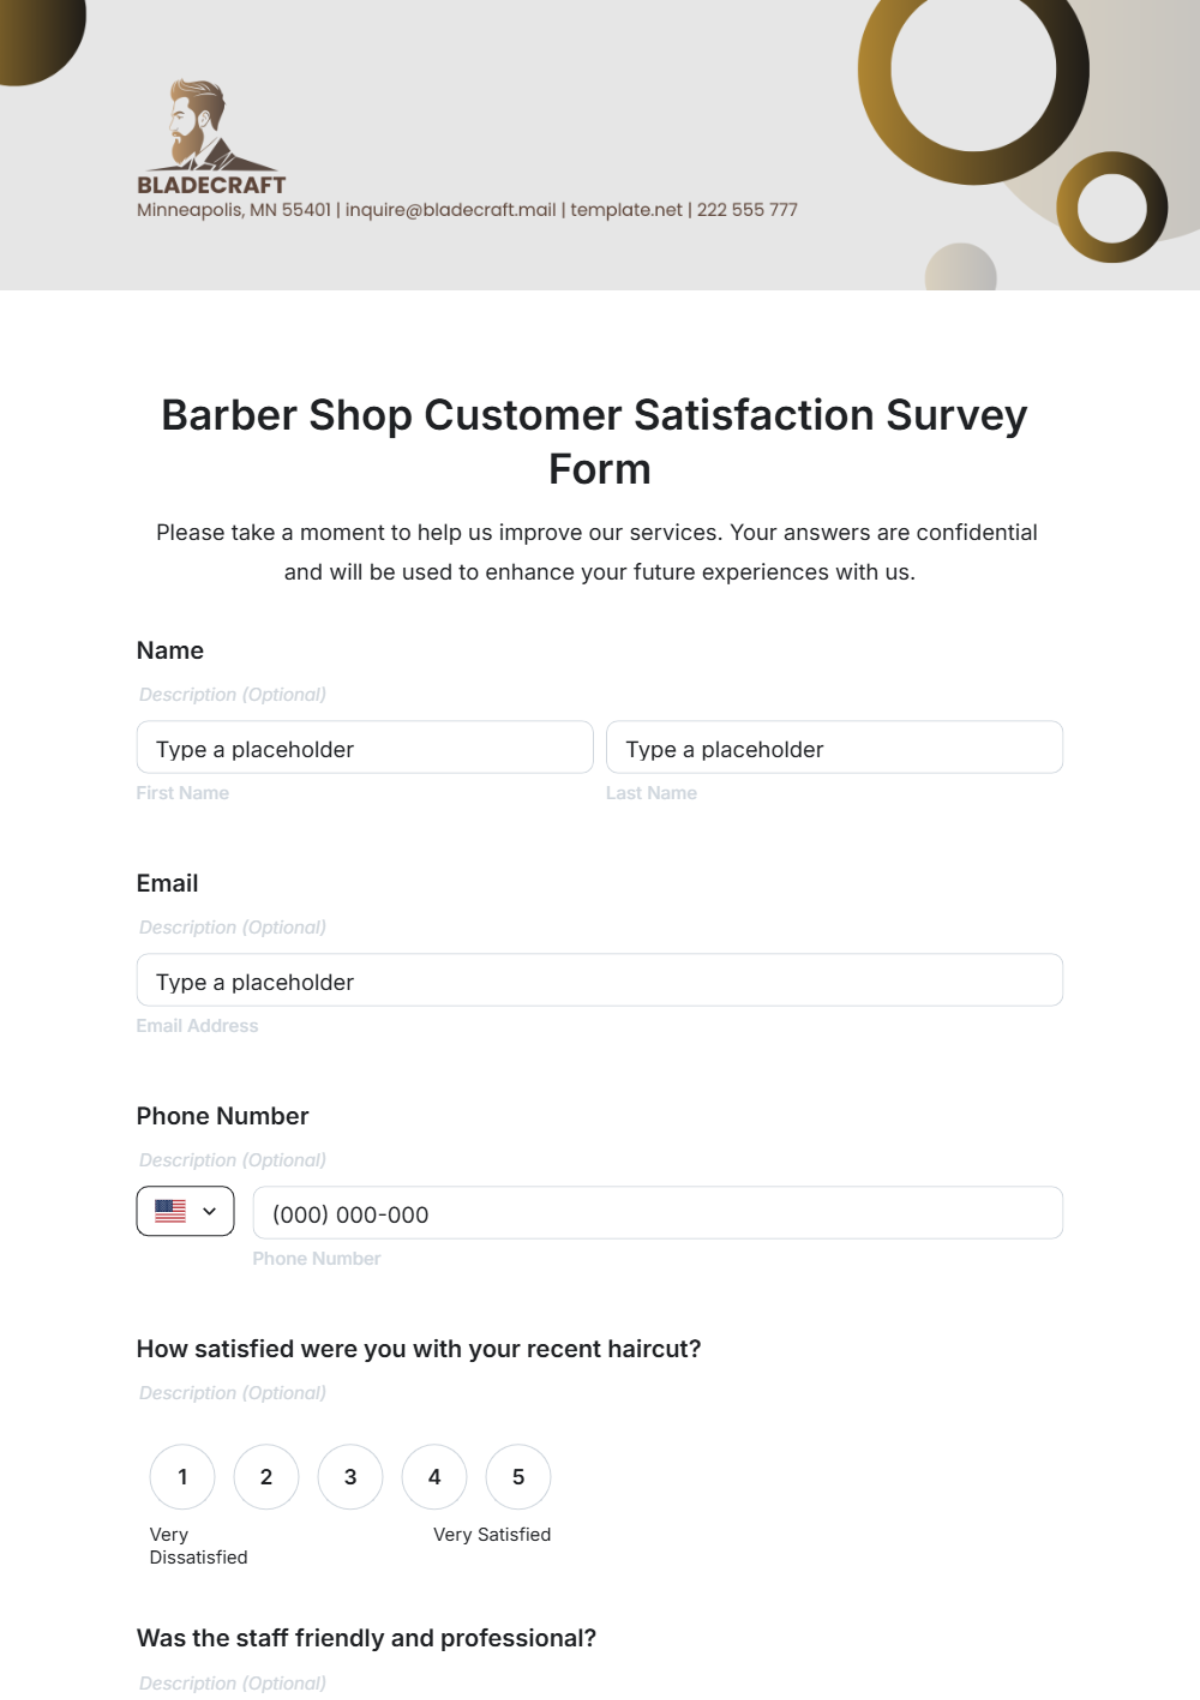
This report provides a comprehensive analysis of the survey conducted to understand the preferences, opinions, and demographics of the respondents. The survey was organized by EyeFusion and targeted a diverse population to gain insights into various topics relevant to our business and community engagement strategies.
Methodology
The survey was conducted online over a period of four weeks, from June 1, 2087, to June 30, 2087. A total of 5,000 invitations were sent out via email and social media platforms, out of which 3,500 responses were received, yielding a response rate of 70%. The questionnaire comprised multiple-choice questions, Likert scale ratings, and open-ended questions to allow for both quantitative and qualitative analysis.
Data Collection
The data collection process was carried out using a secure online survey platform, which ensured the anonymity and confidentiality of all participants. The survey was divided into three main sections: Demographic Information, Product Preferences, and Feedback and Suggestions.
Data Analysis
The collected data was analyzed using statistical software to identify trends, patterns, and correlations. Descriptive statistics were used to summarize the basic features of the data, while inferential statistics were used to draw conclusions and make predictions.
Results
Demographic Information
Category | Percentage |
|---|---|
Gender | Male: 48%, Female: 51%, Other: 1% |
Age | 18-24: 20%, 25-34: 35%, 35-44: 25%, 45-54: 15%, 55+: 5% |
Location | Urban: 60%, Suburban: 30%, Rural: 10% |
Product Preferences
Respondents were asked to rate their preference for various types of products offered by our company on a scale of 1 to 5, with 1 being 'Very Uninterested' and 5 being 'Very Interested'. The results are summarized as follows:
Product Category | Average Rating |
|---|---|
Electronics | 4.2 |
Apparel | 3.8 |
Home Goods | 4.0 |
Feedback and Suggestions
The open-ended questions provided valuable feedback and suggestions from the respondents. Key themes extracted from the responses include:
Desire for more environmentally friendly product options.
Request for enhanced customer service and support channels.
Interest in loyalty programs and exclusive discounts.
Discussion
The survey results highlight several important insights that can guide strategic decision-making. The demographic data suggests that our target audience is predominantly between the ages of 25 and 44, indicating a need to tailor marketing efforts to this age group. The high interest in electronics and home goods products suggests potential areas for product line expansion. Additionally, the feedback on environmental sustainability and customer service highlights areas for improvement to meet consumer expectations more effectively.
Conclusion
Overall, the survey has provided a wealth of information that will inform our future strategies and initiatives. By acknowledging the preferences and feedback from our customers, we can enhance our offerings and improve customer satisfaction. Future surveys may focus on specific areas such as brand perception, cultural trends, and technological adoption to further refine our approach.
Recommendations
Develop a marketing strategy focused on the 25-44 age group.
Expand the range of eco-friendly products available.
Improve customer support services to ensure a seamless consumer experience.
Introduce loyalty programs to boost customer retention and satisfaction.
This report serves as a foundational tool for enhancing our business strategies, aligning with consumer expectations, and ultimately achieving greater market success.
