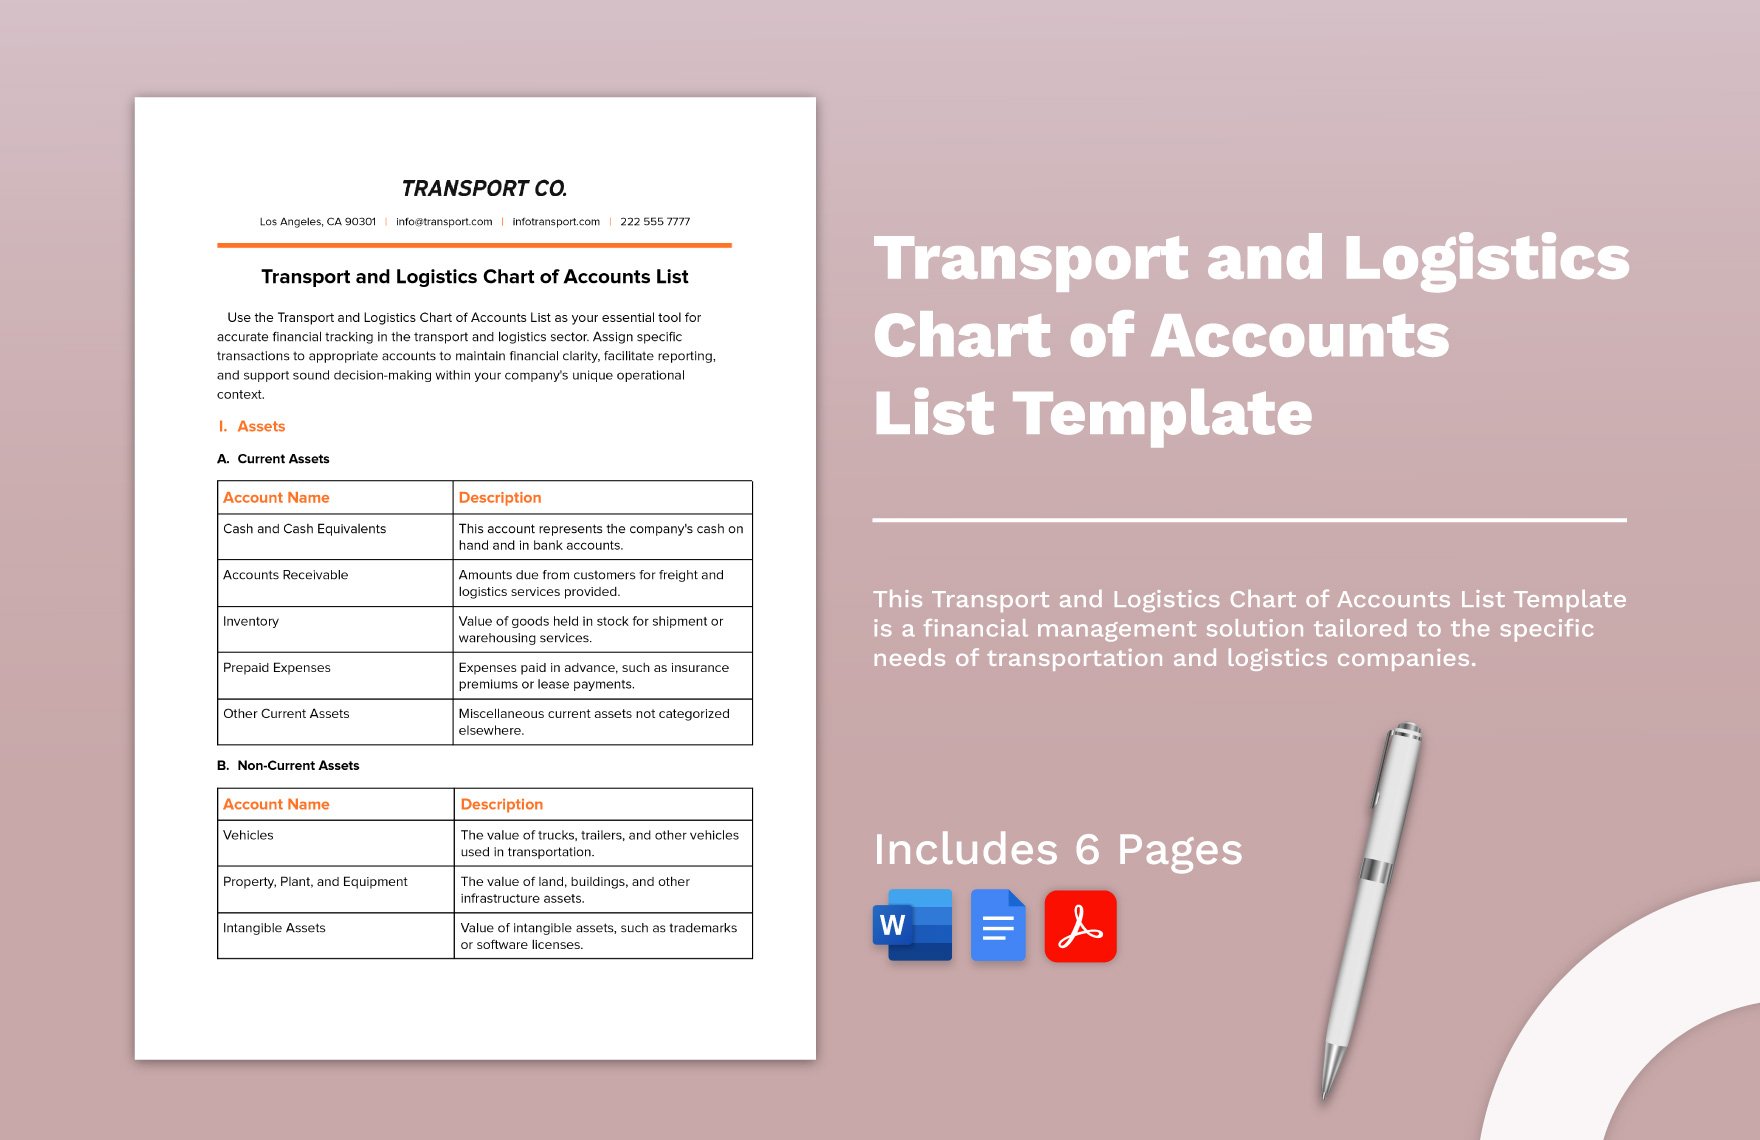
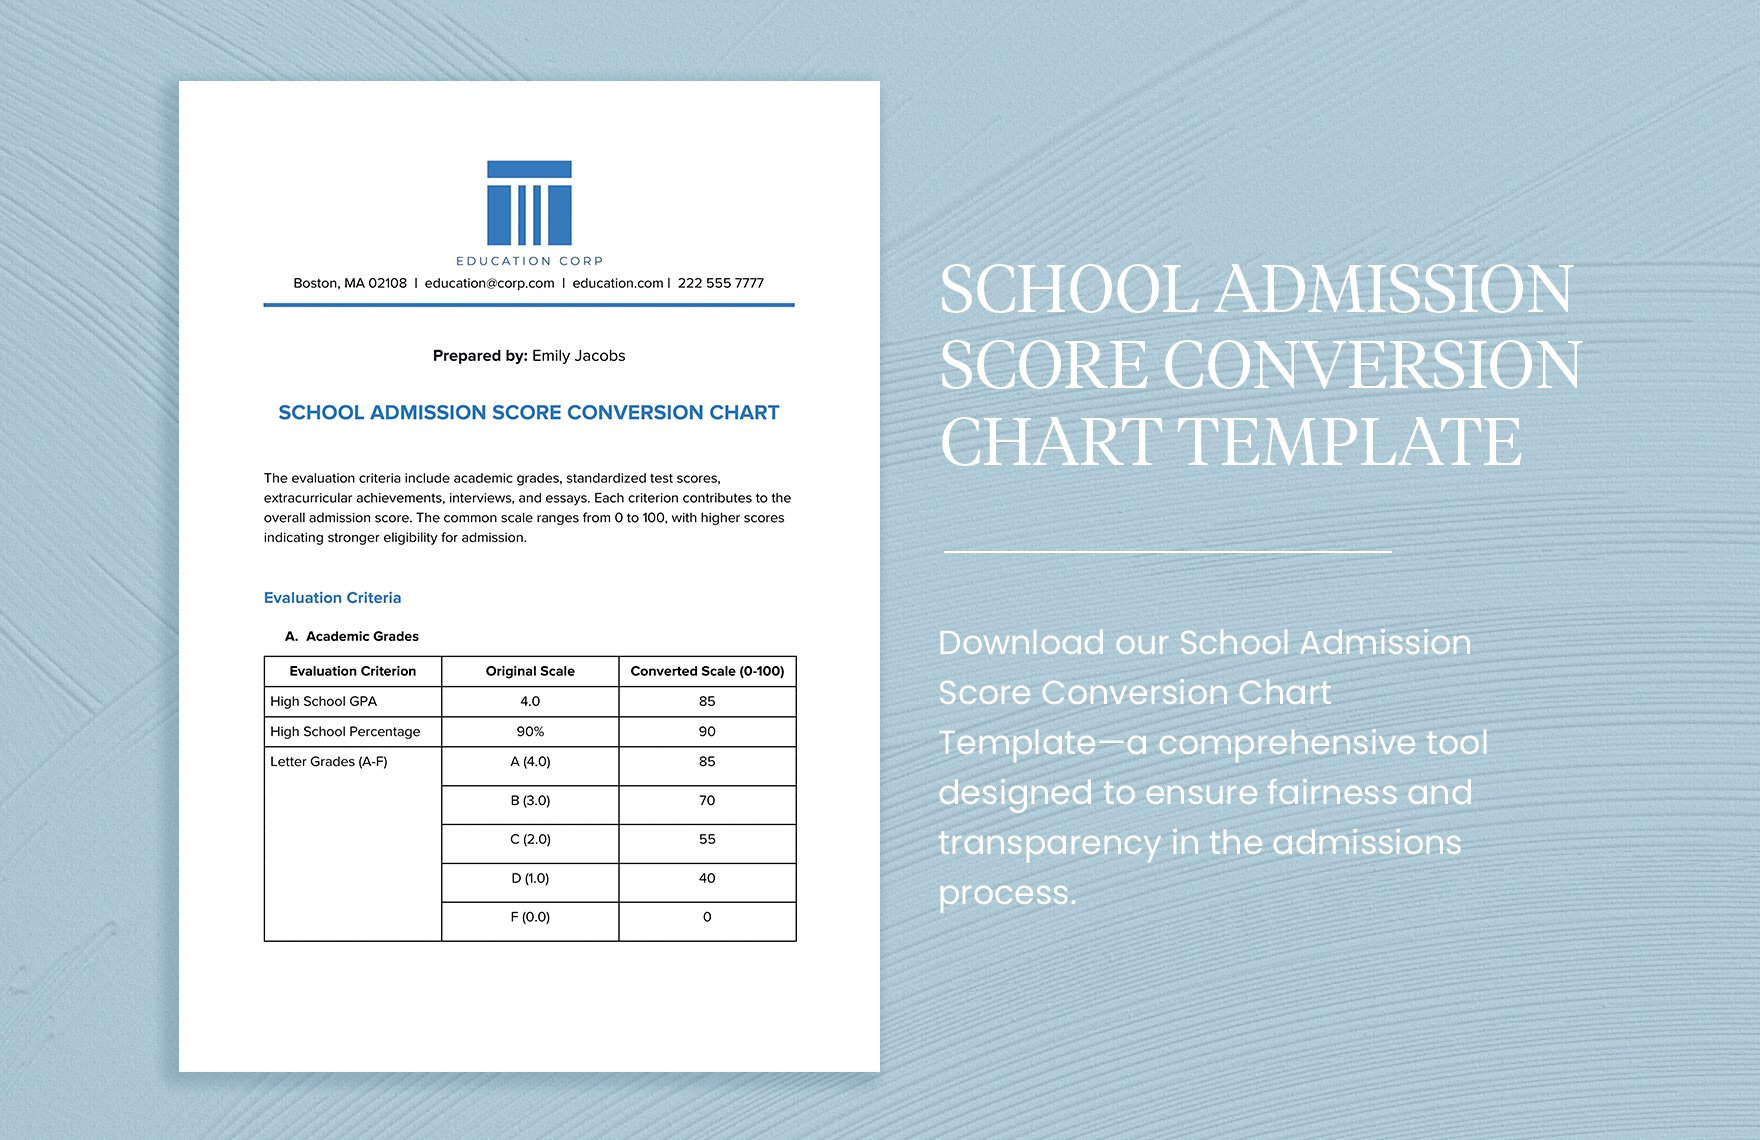
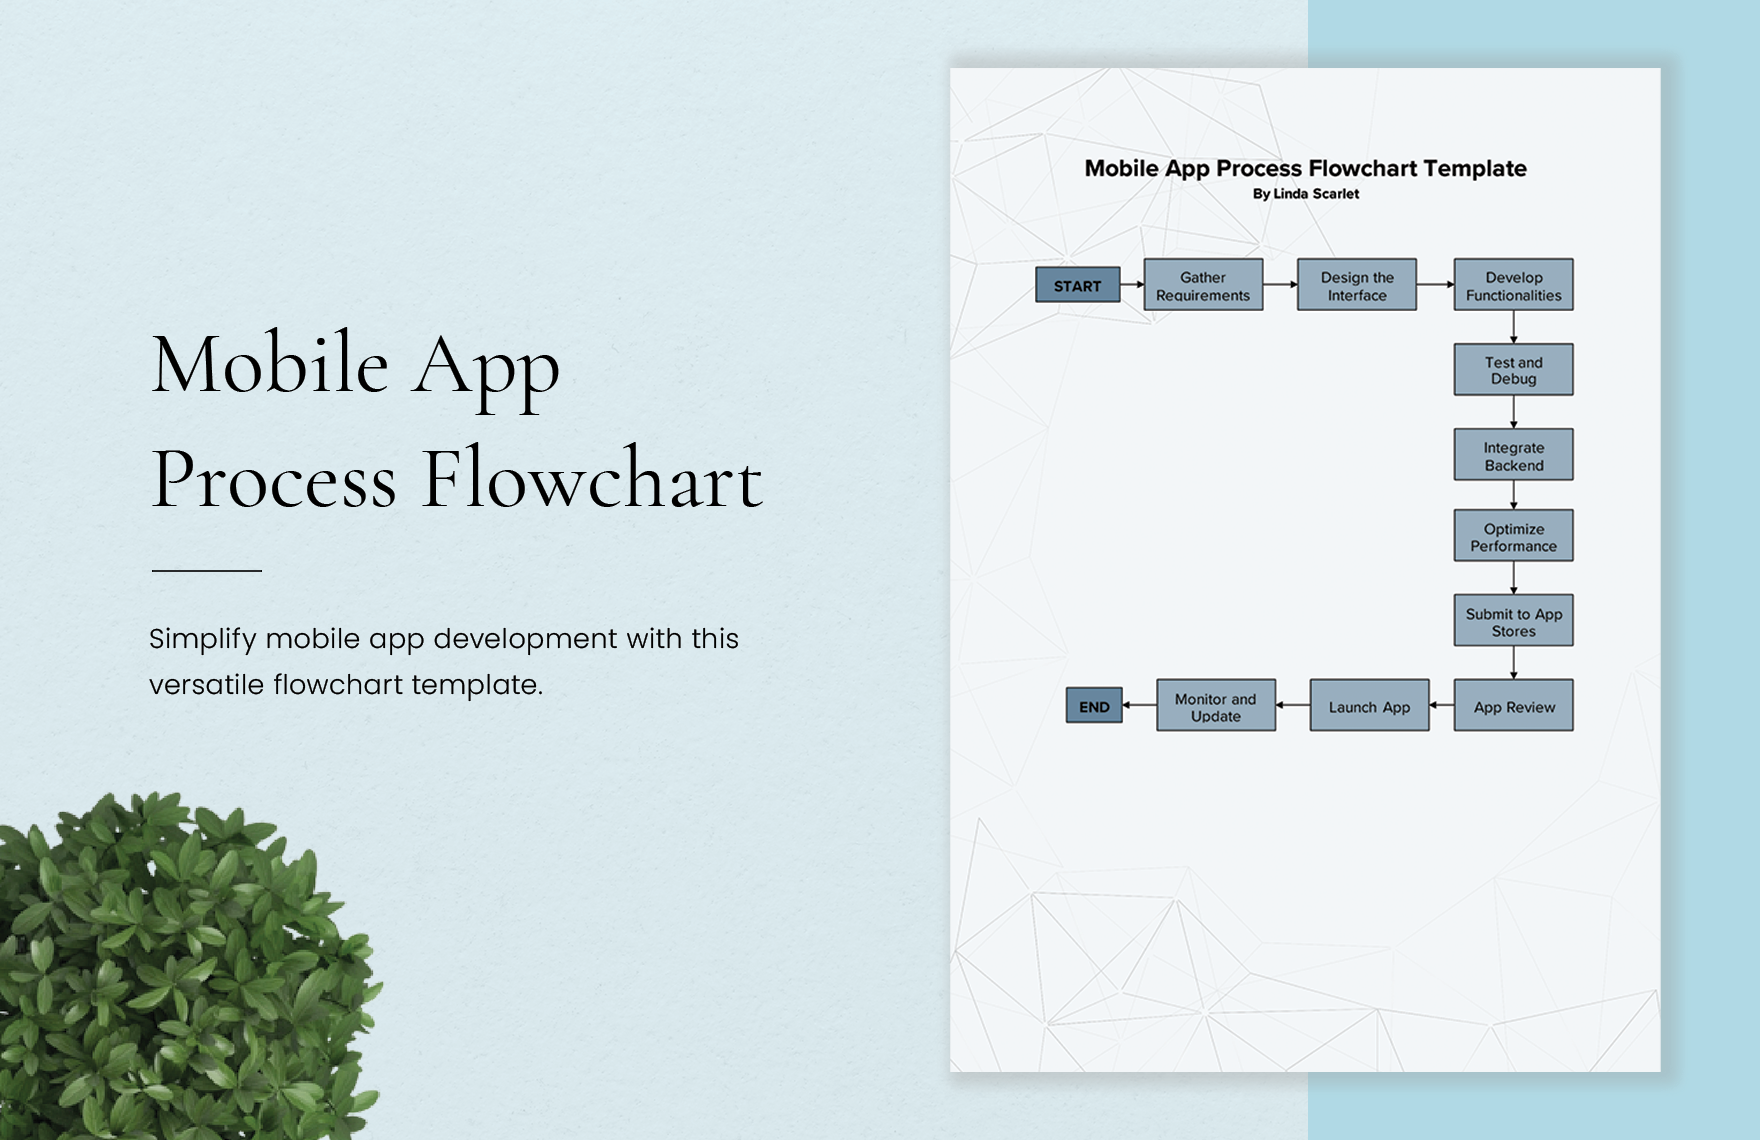
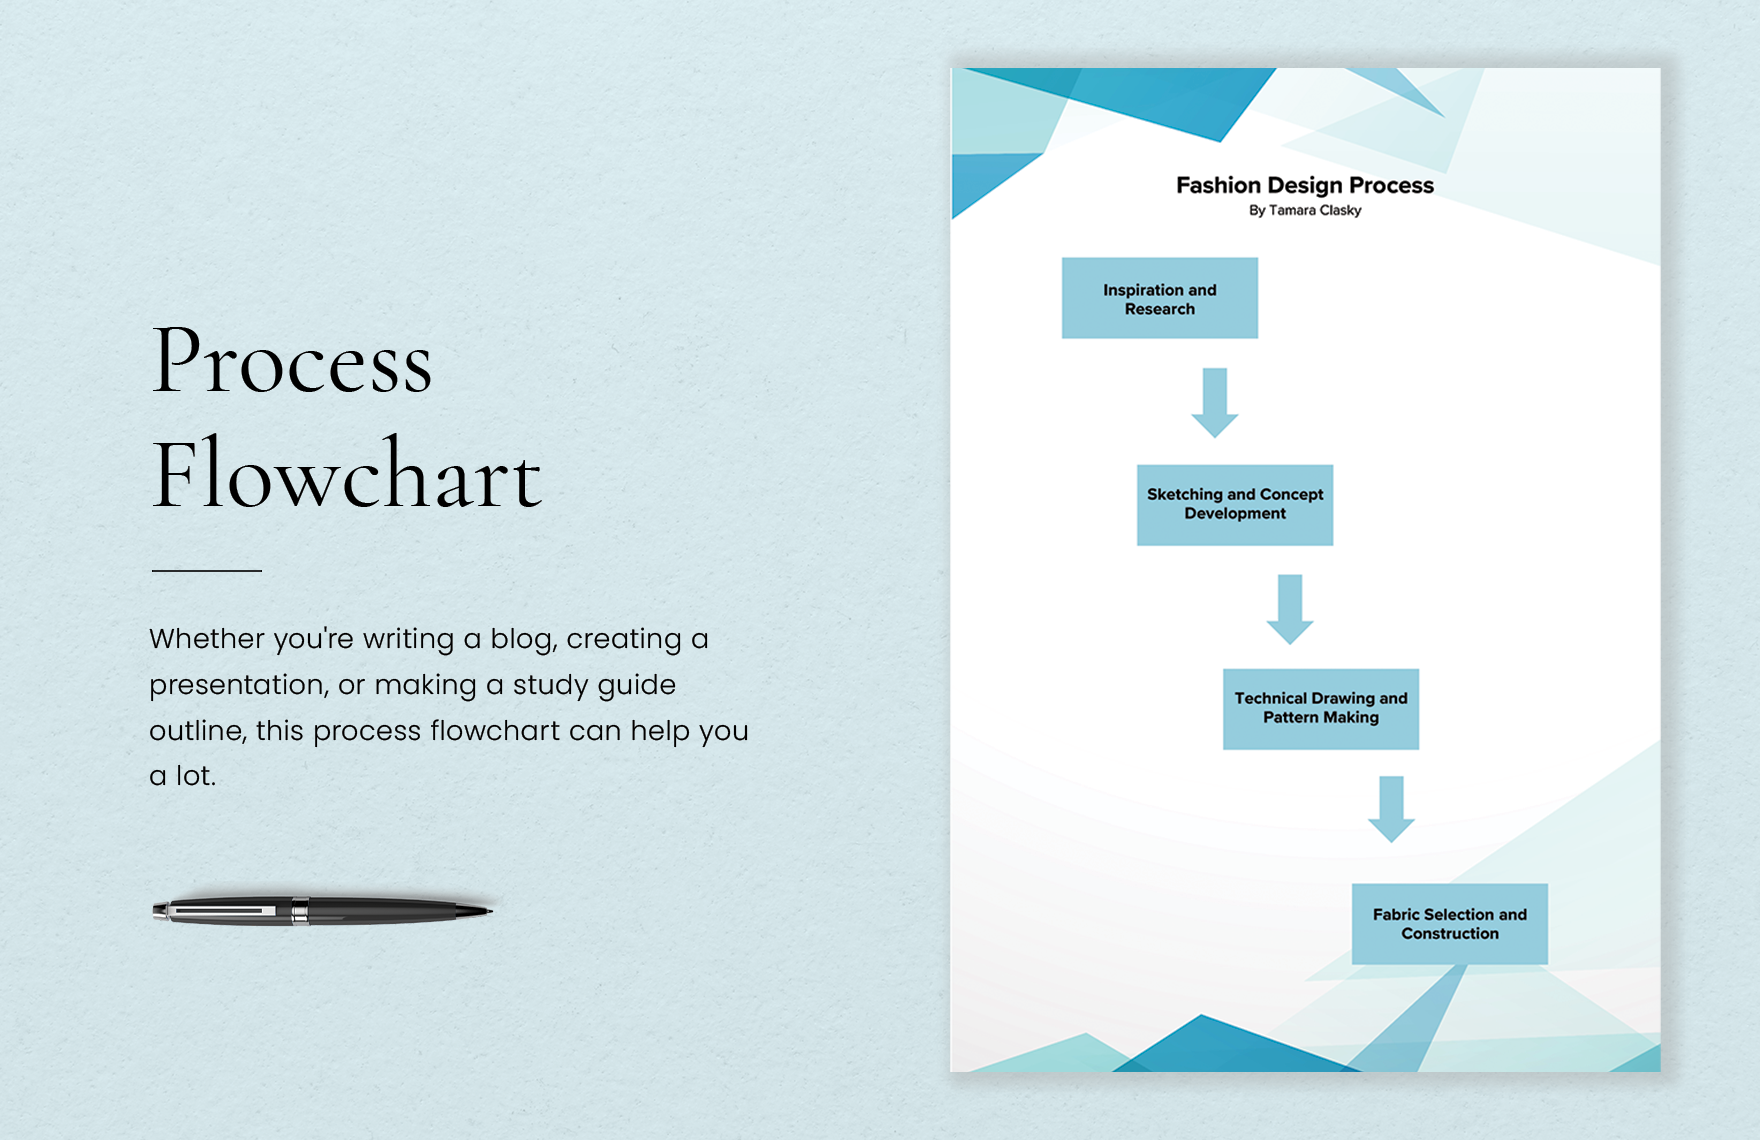
Are you looking for a chart useful in whatever you do and a template that helps you personalize one? Choose your desired template and instantly download it today. These charts are created as 100% customizable for you to edit details on your favor. These are also easily editable in your favorite web-based application Google Docs. Create your needed charts and get organized with it. You'll be more eligible in communicating your own presentation of data better, thus, improve your productivity. We have a variety of free chart templates you can use in your company, school or organization. Our premium templates are designed to all the requirements. Print ready and can be shared digitally, perfect for immediate presentation when needed.
What Is A Chart?
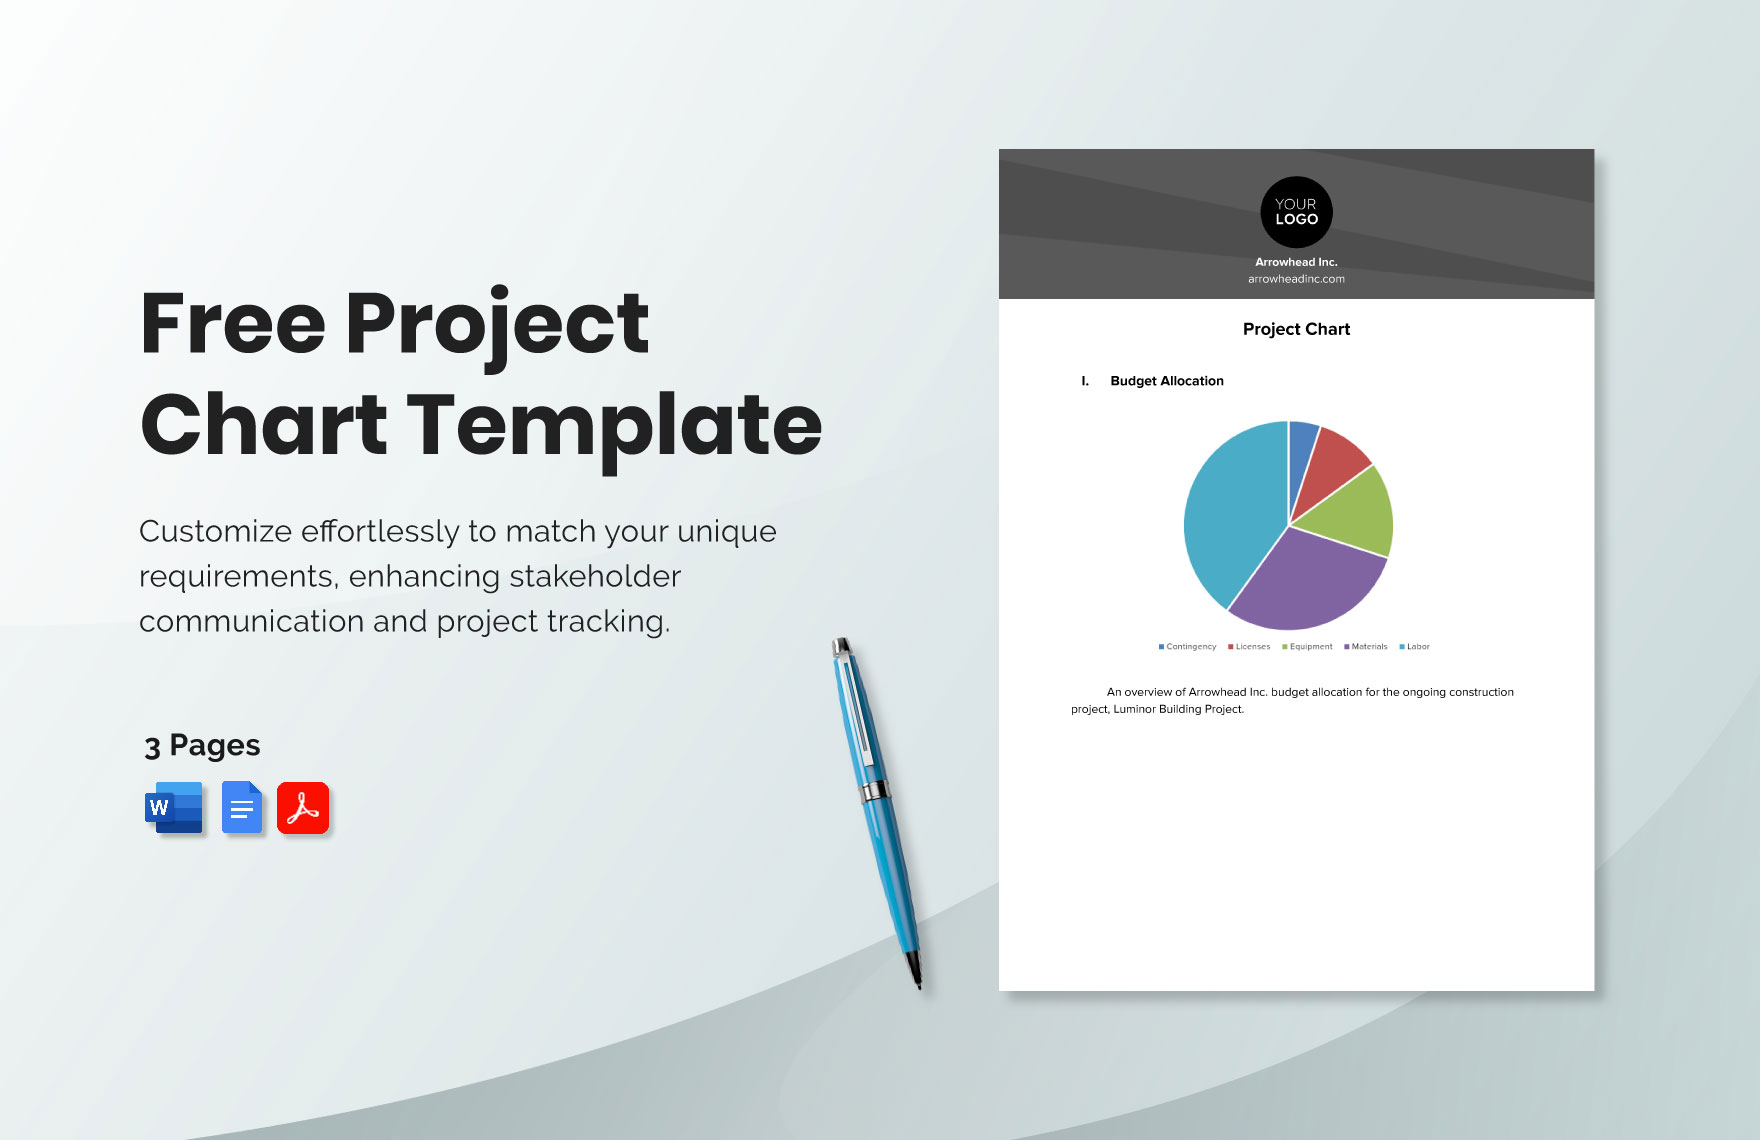
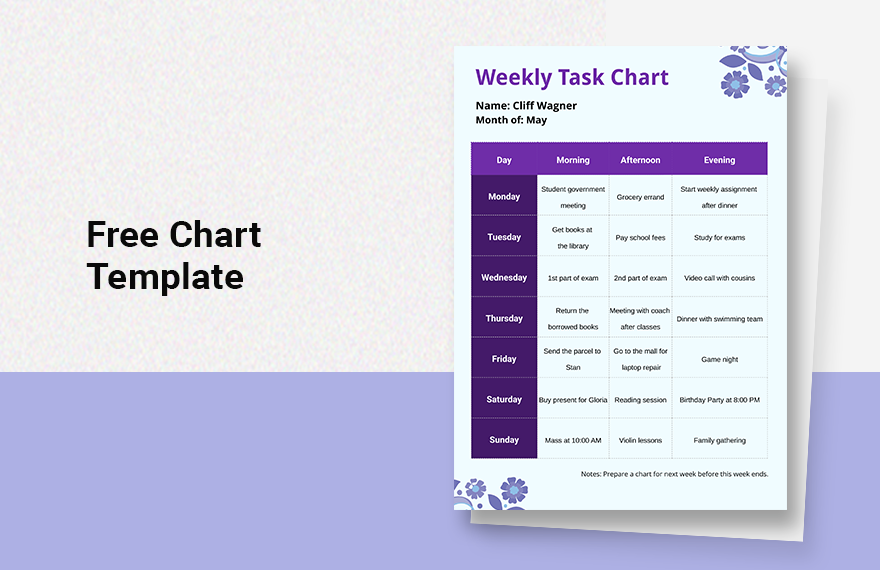
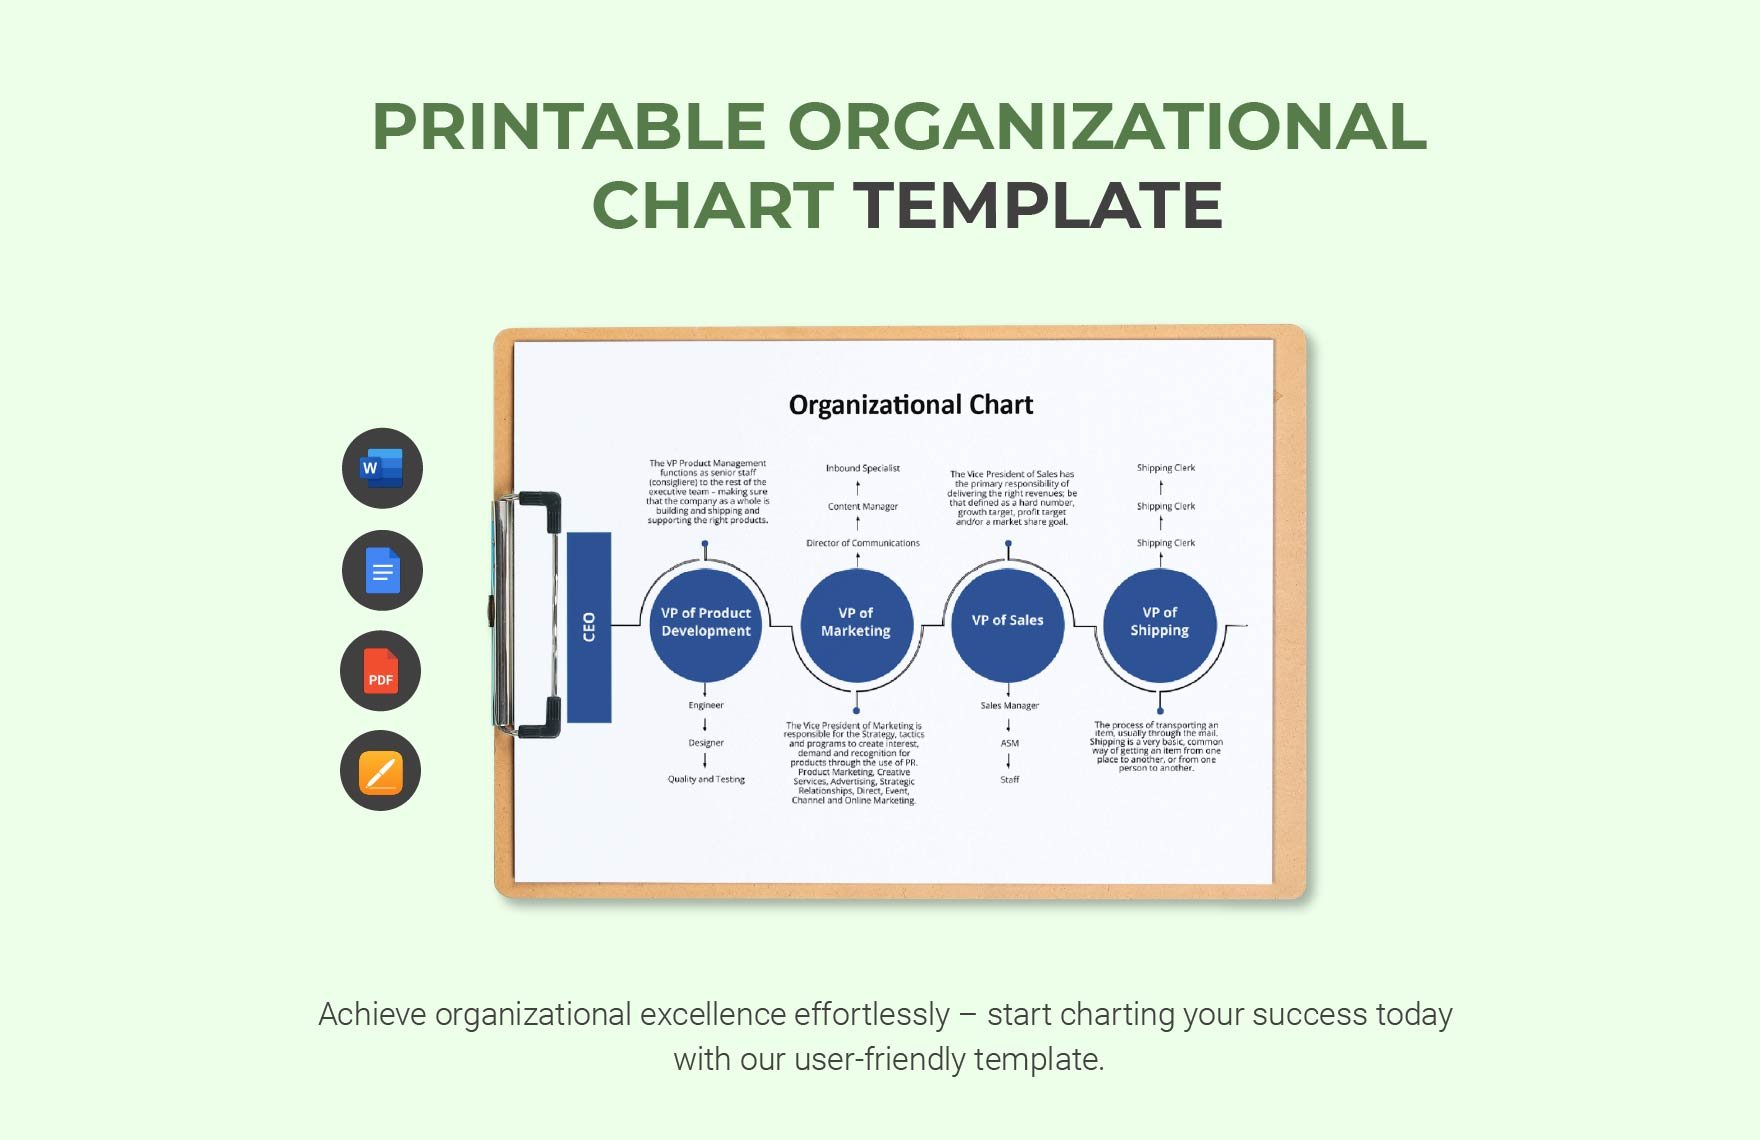
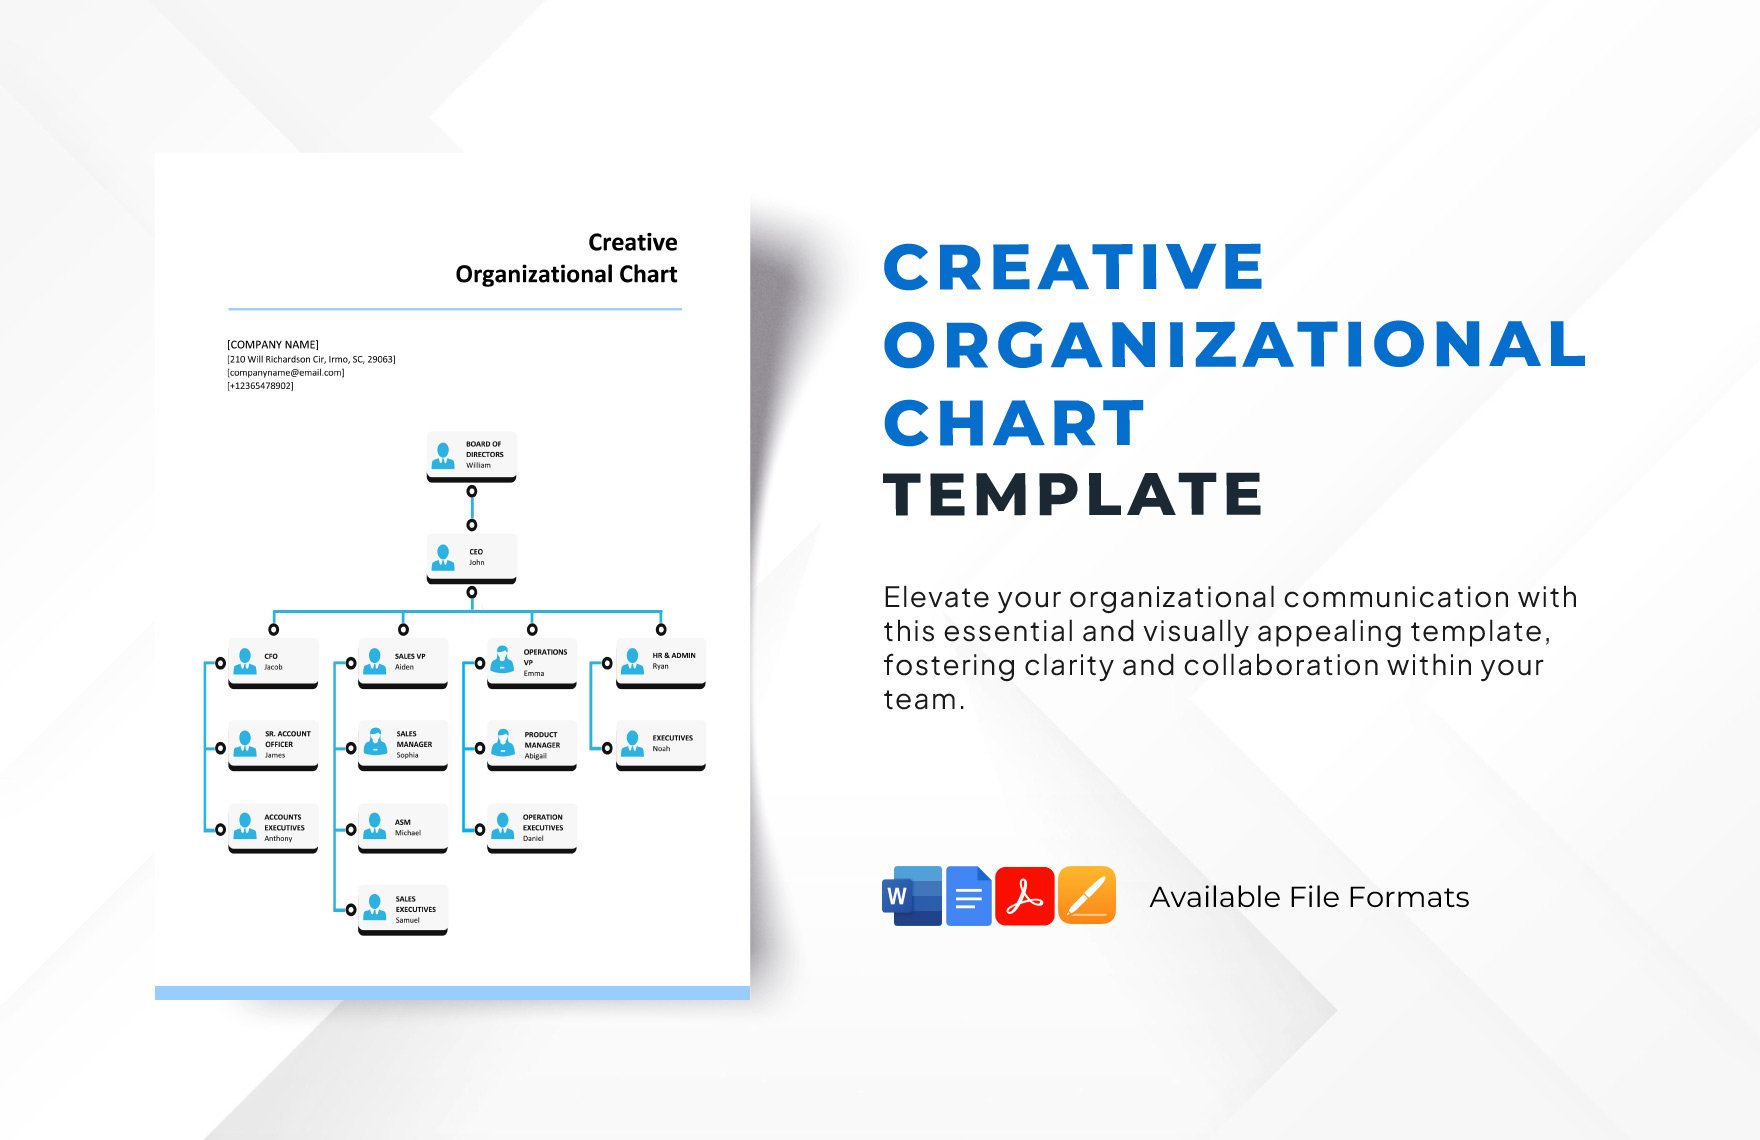
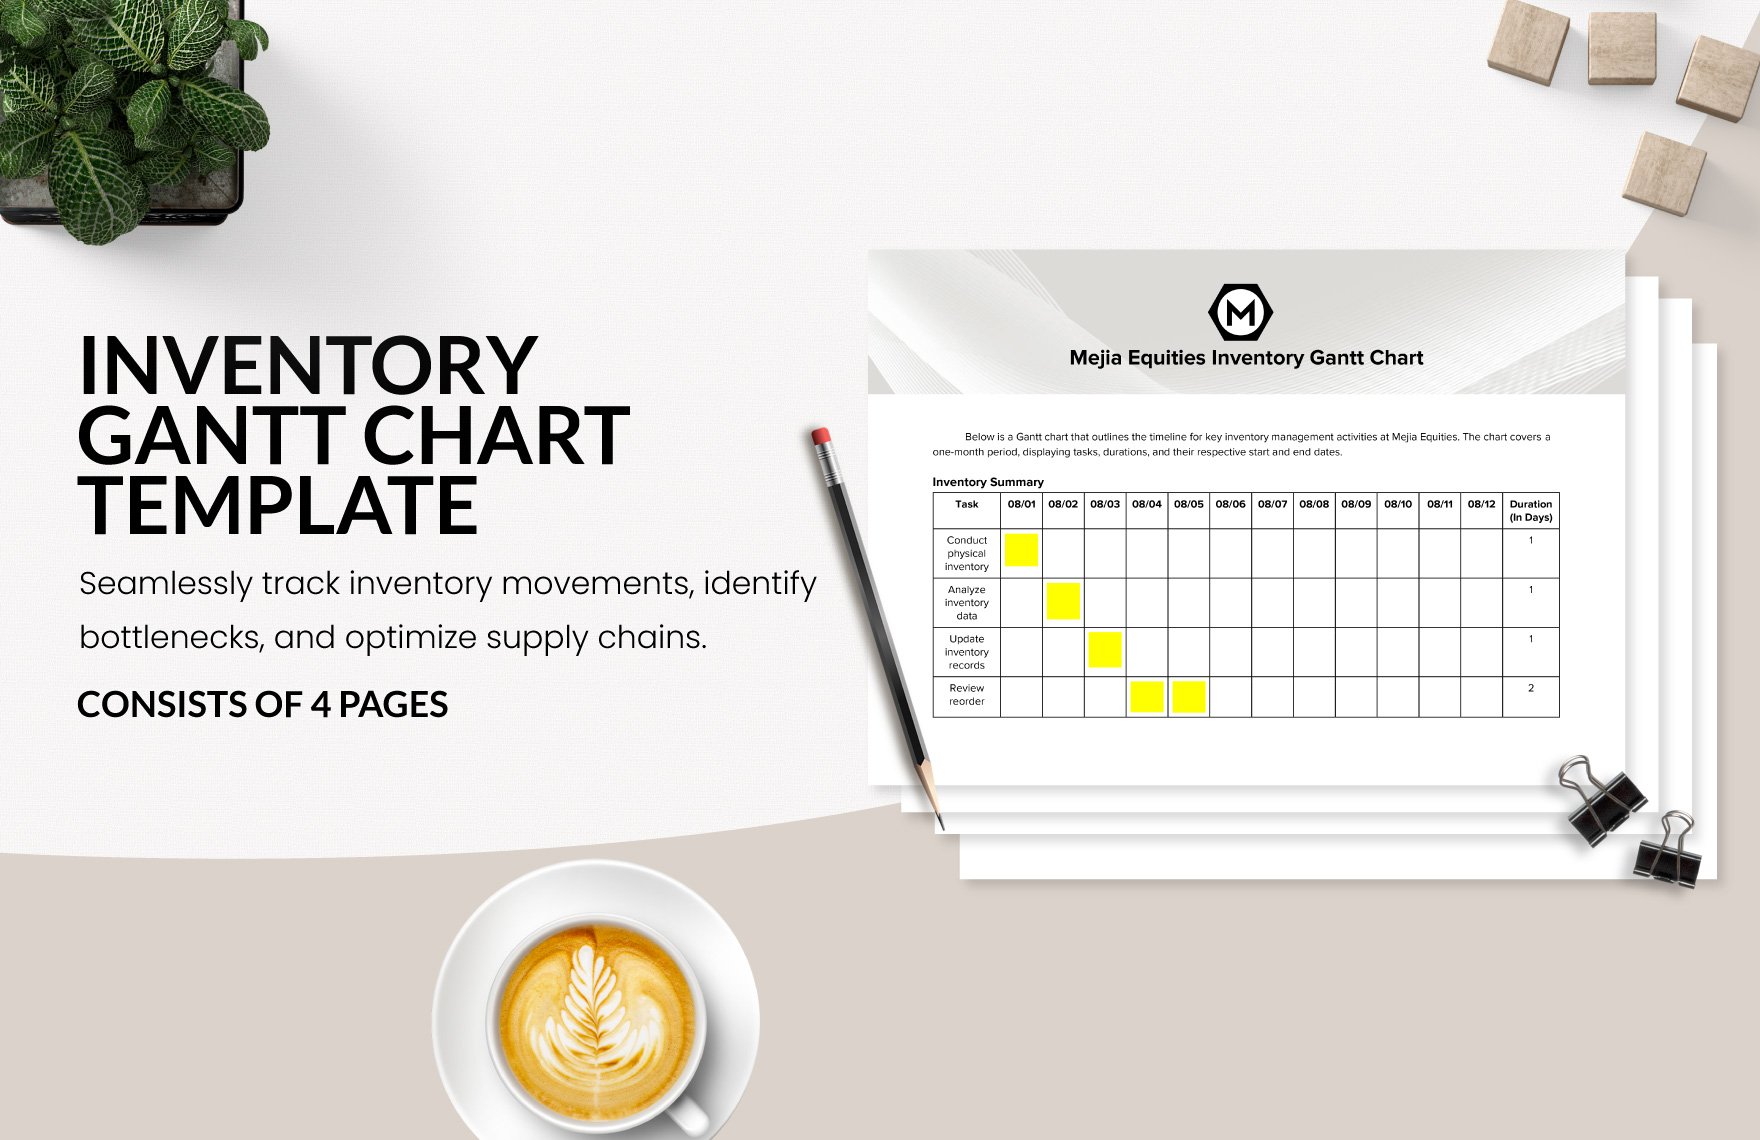
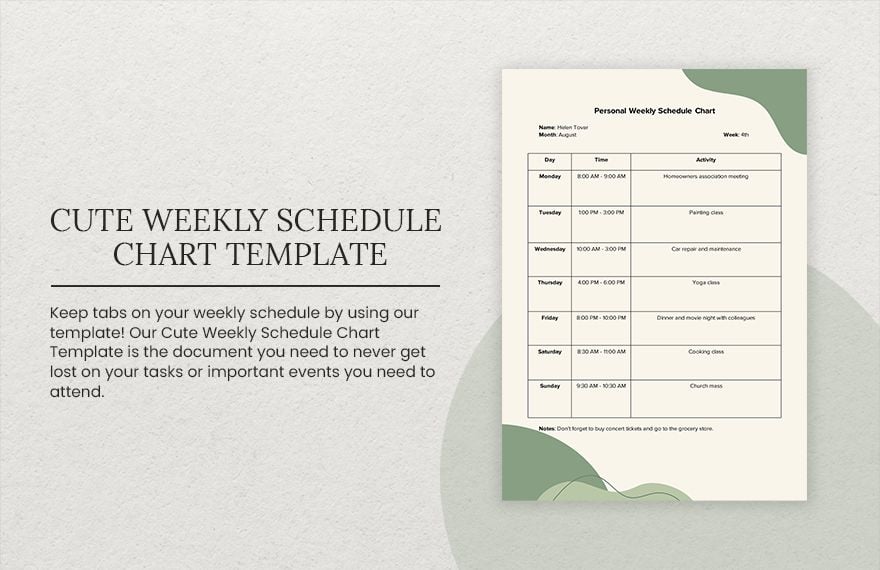
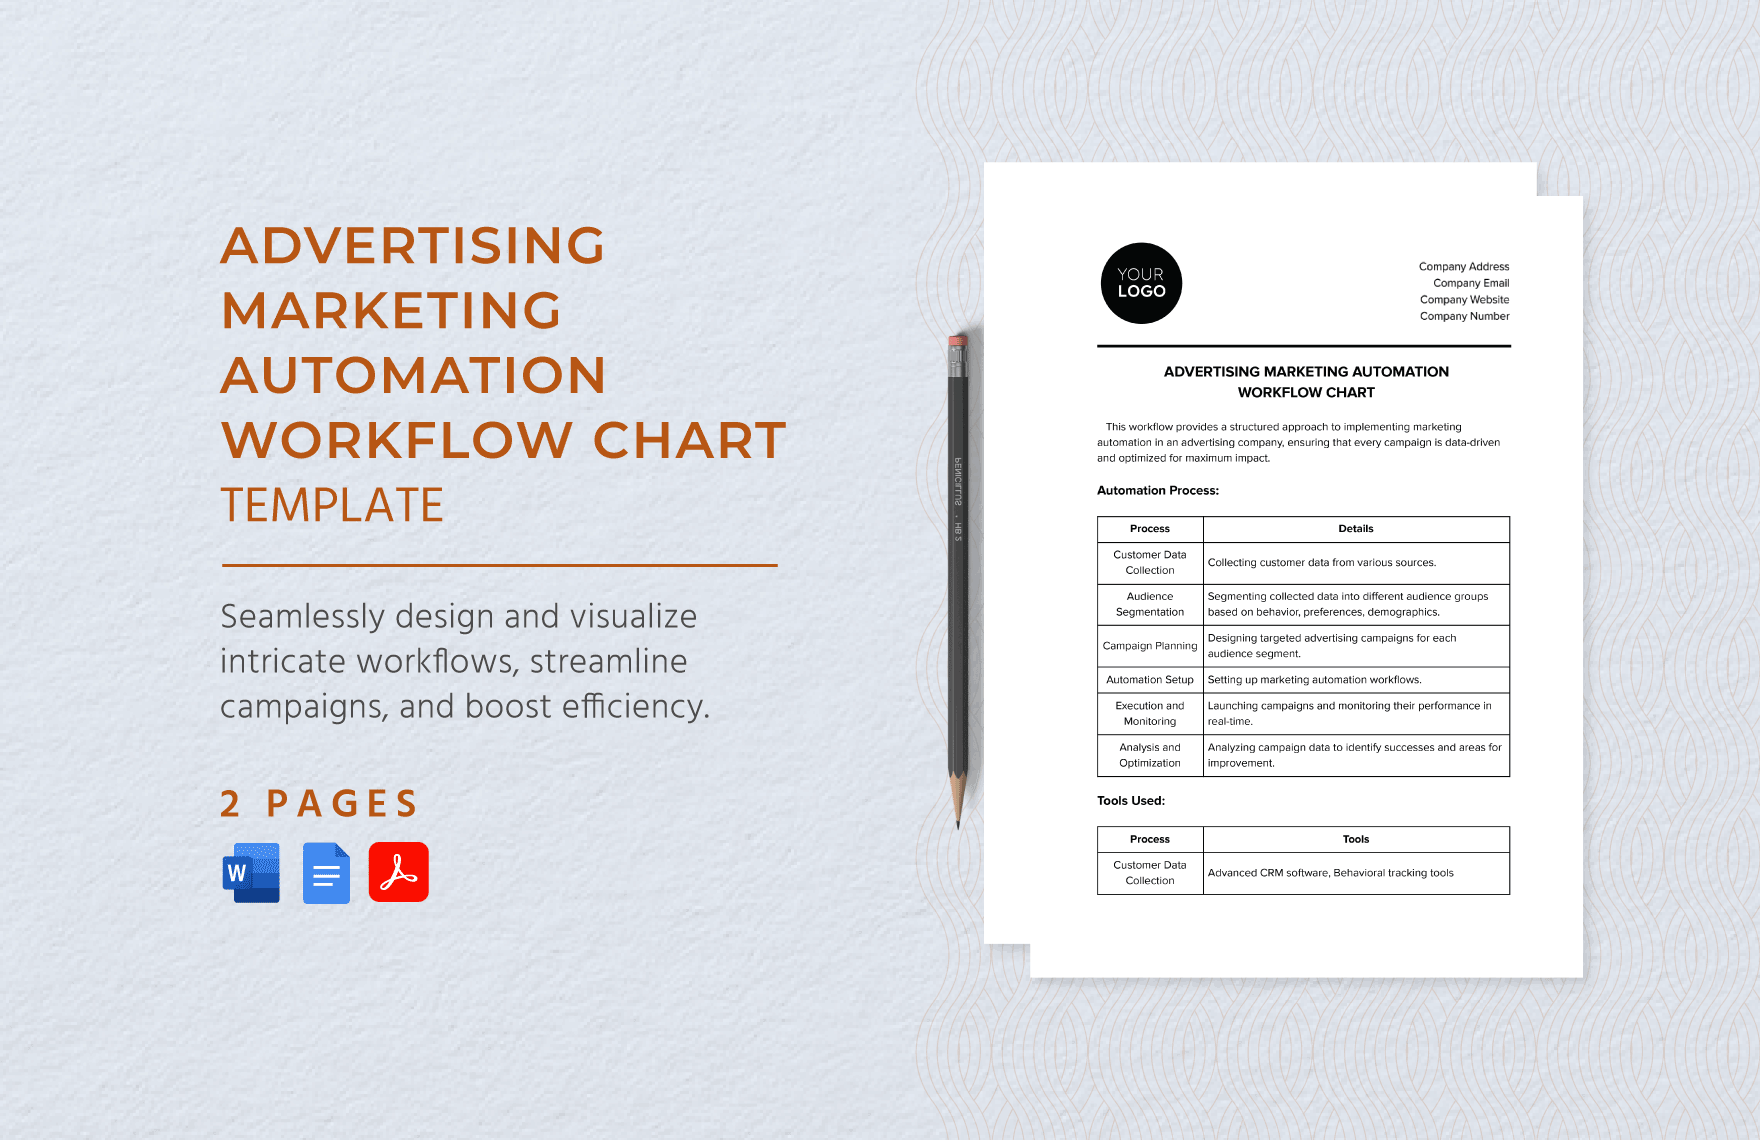
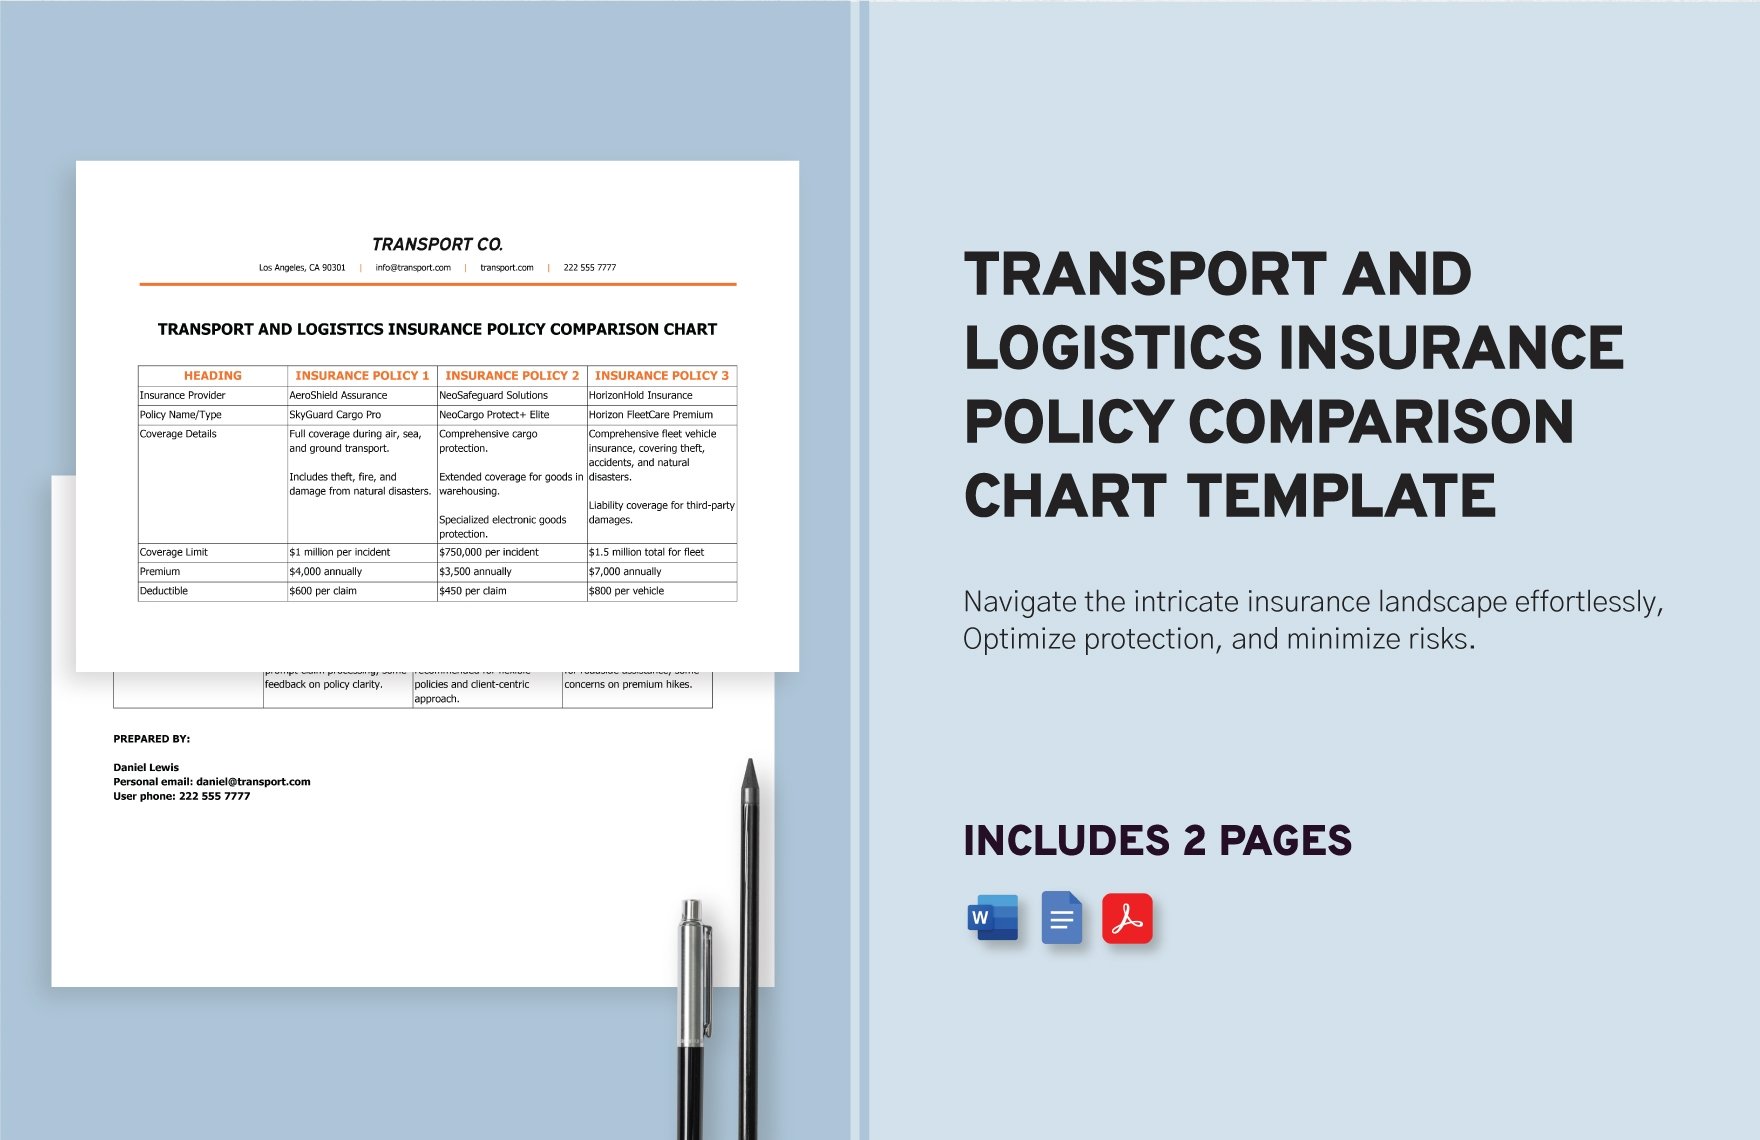
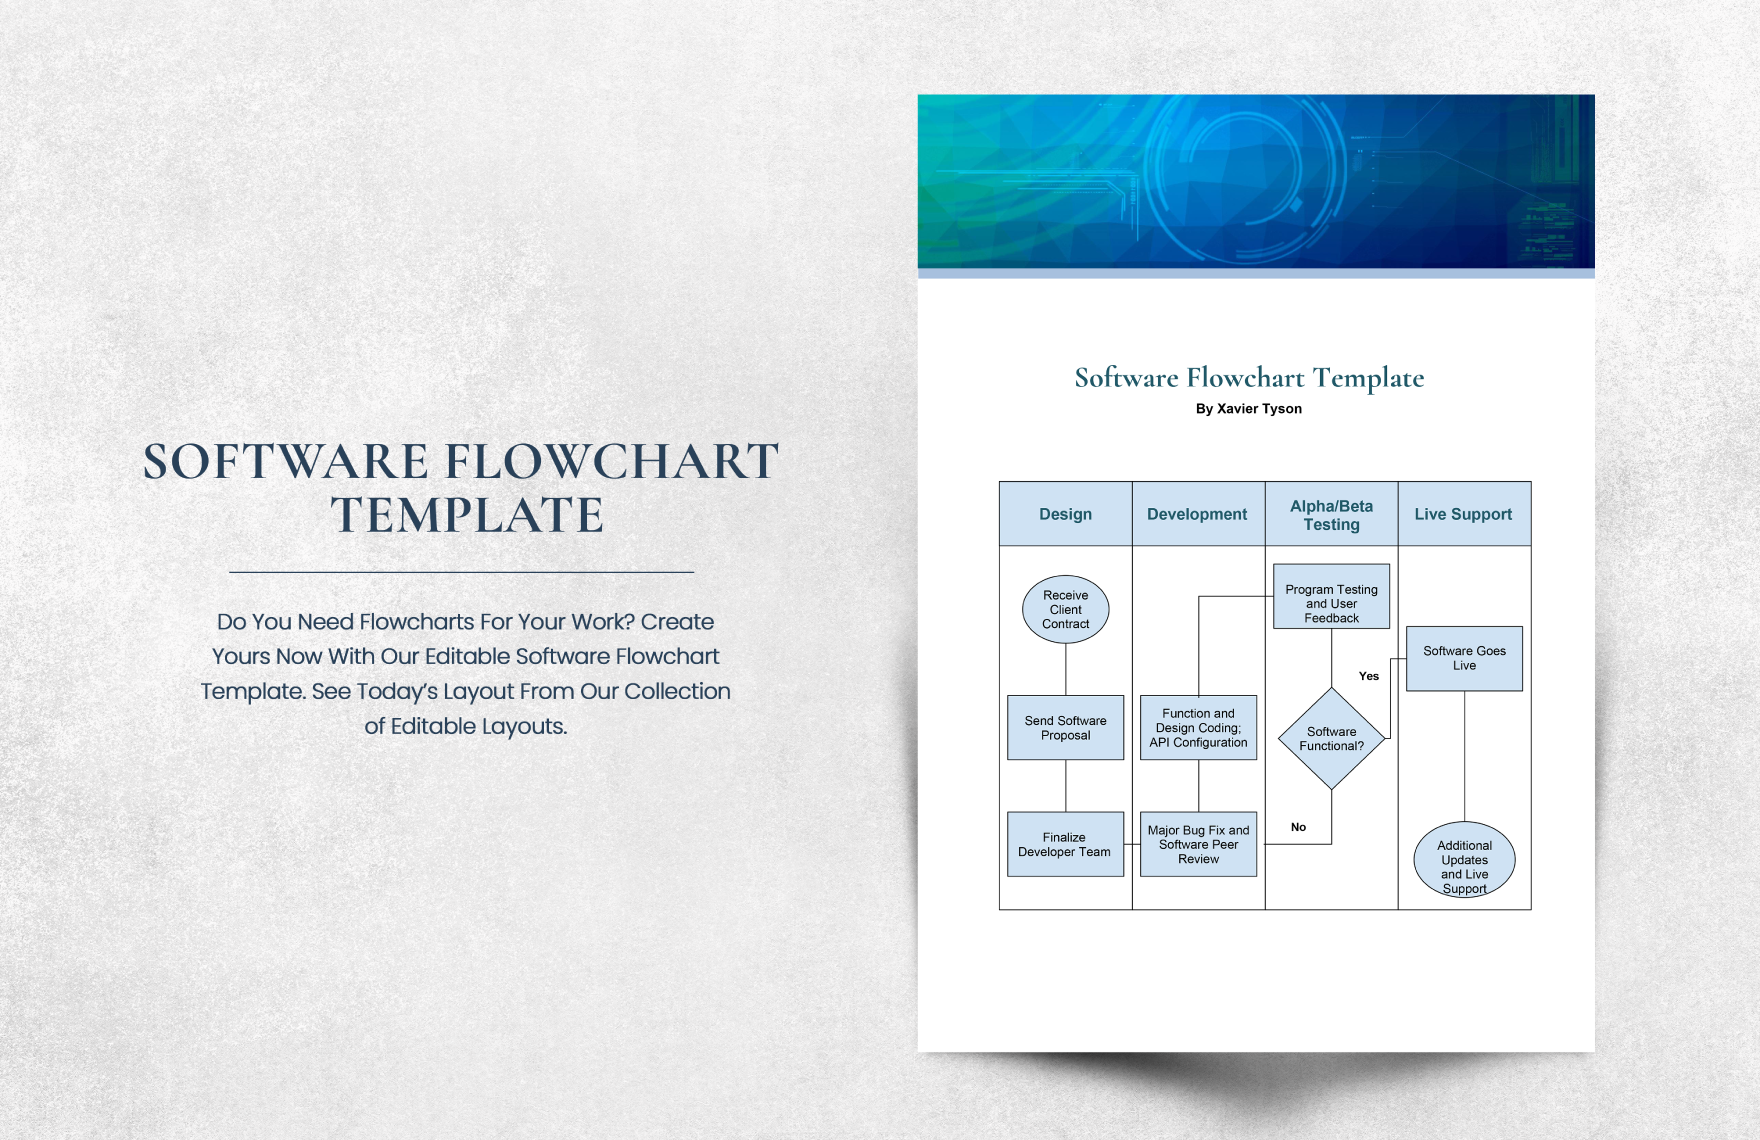
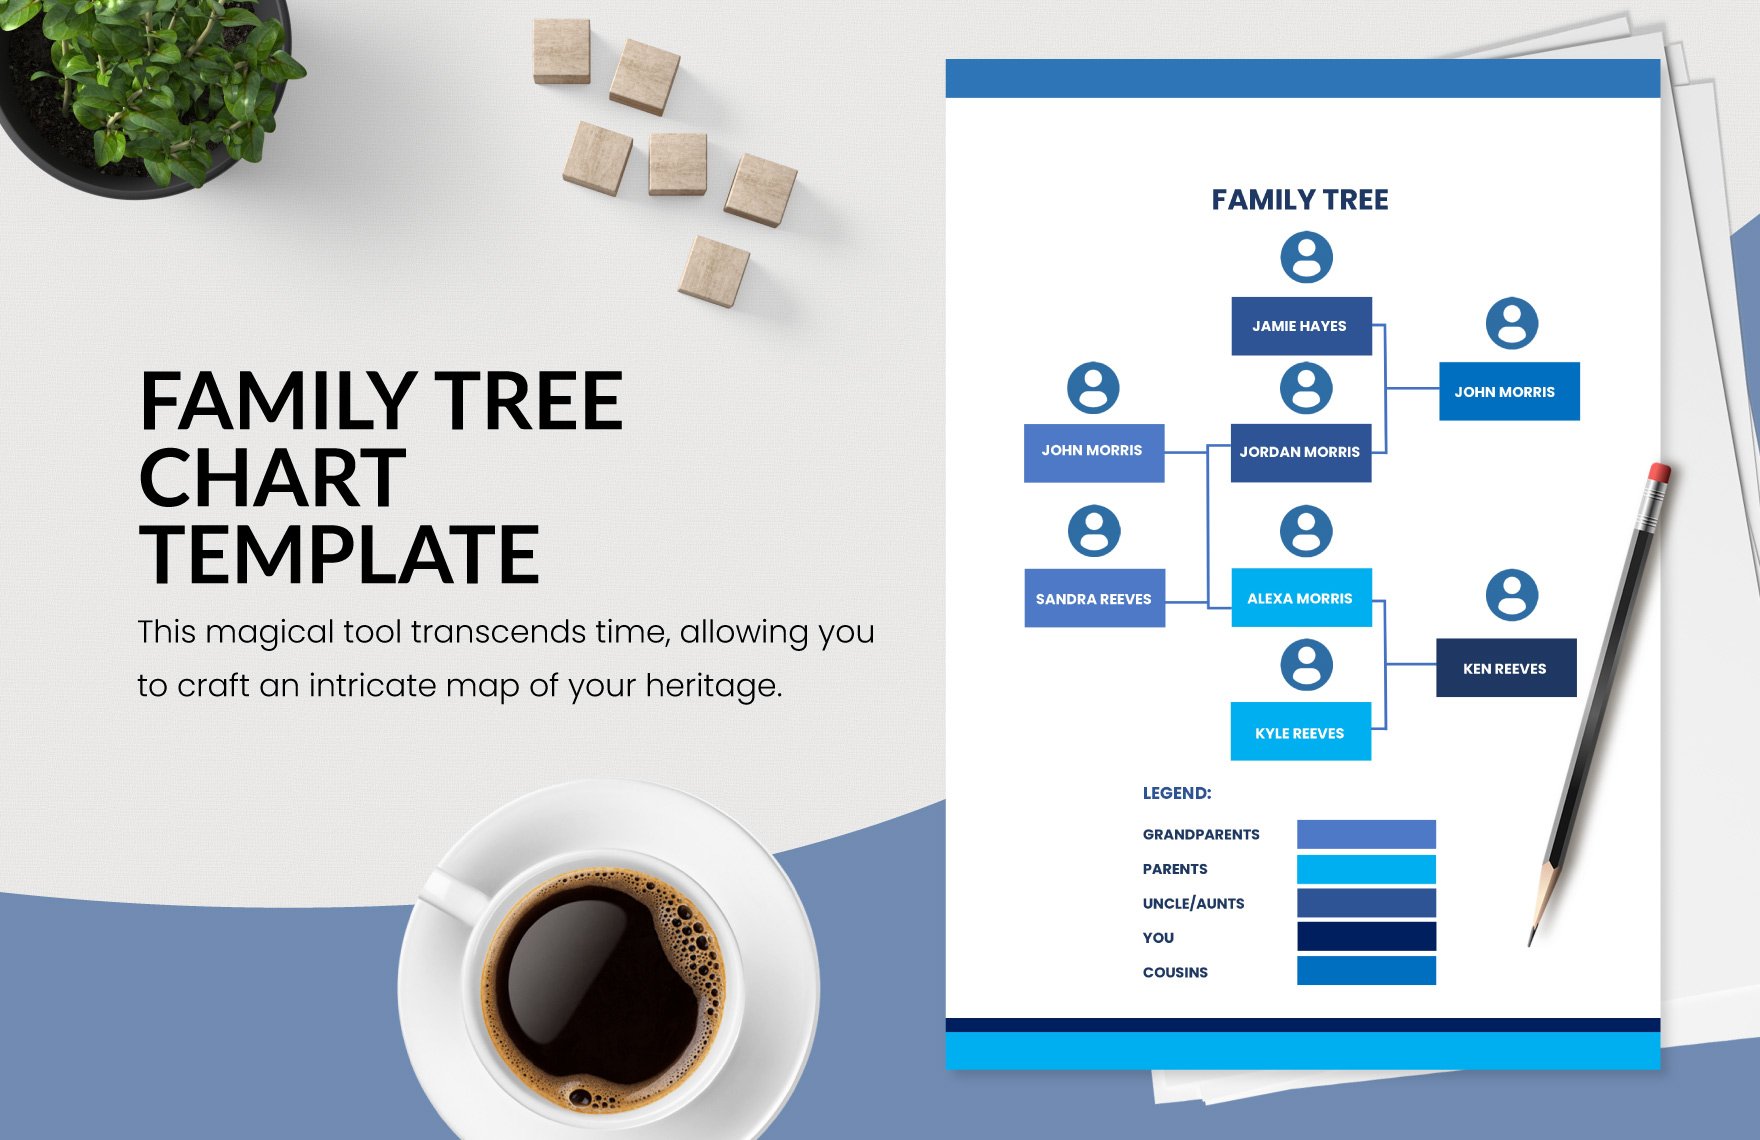
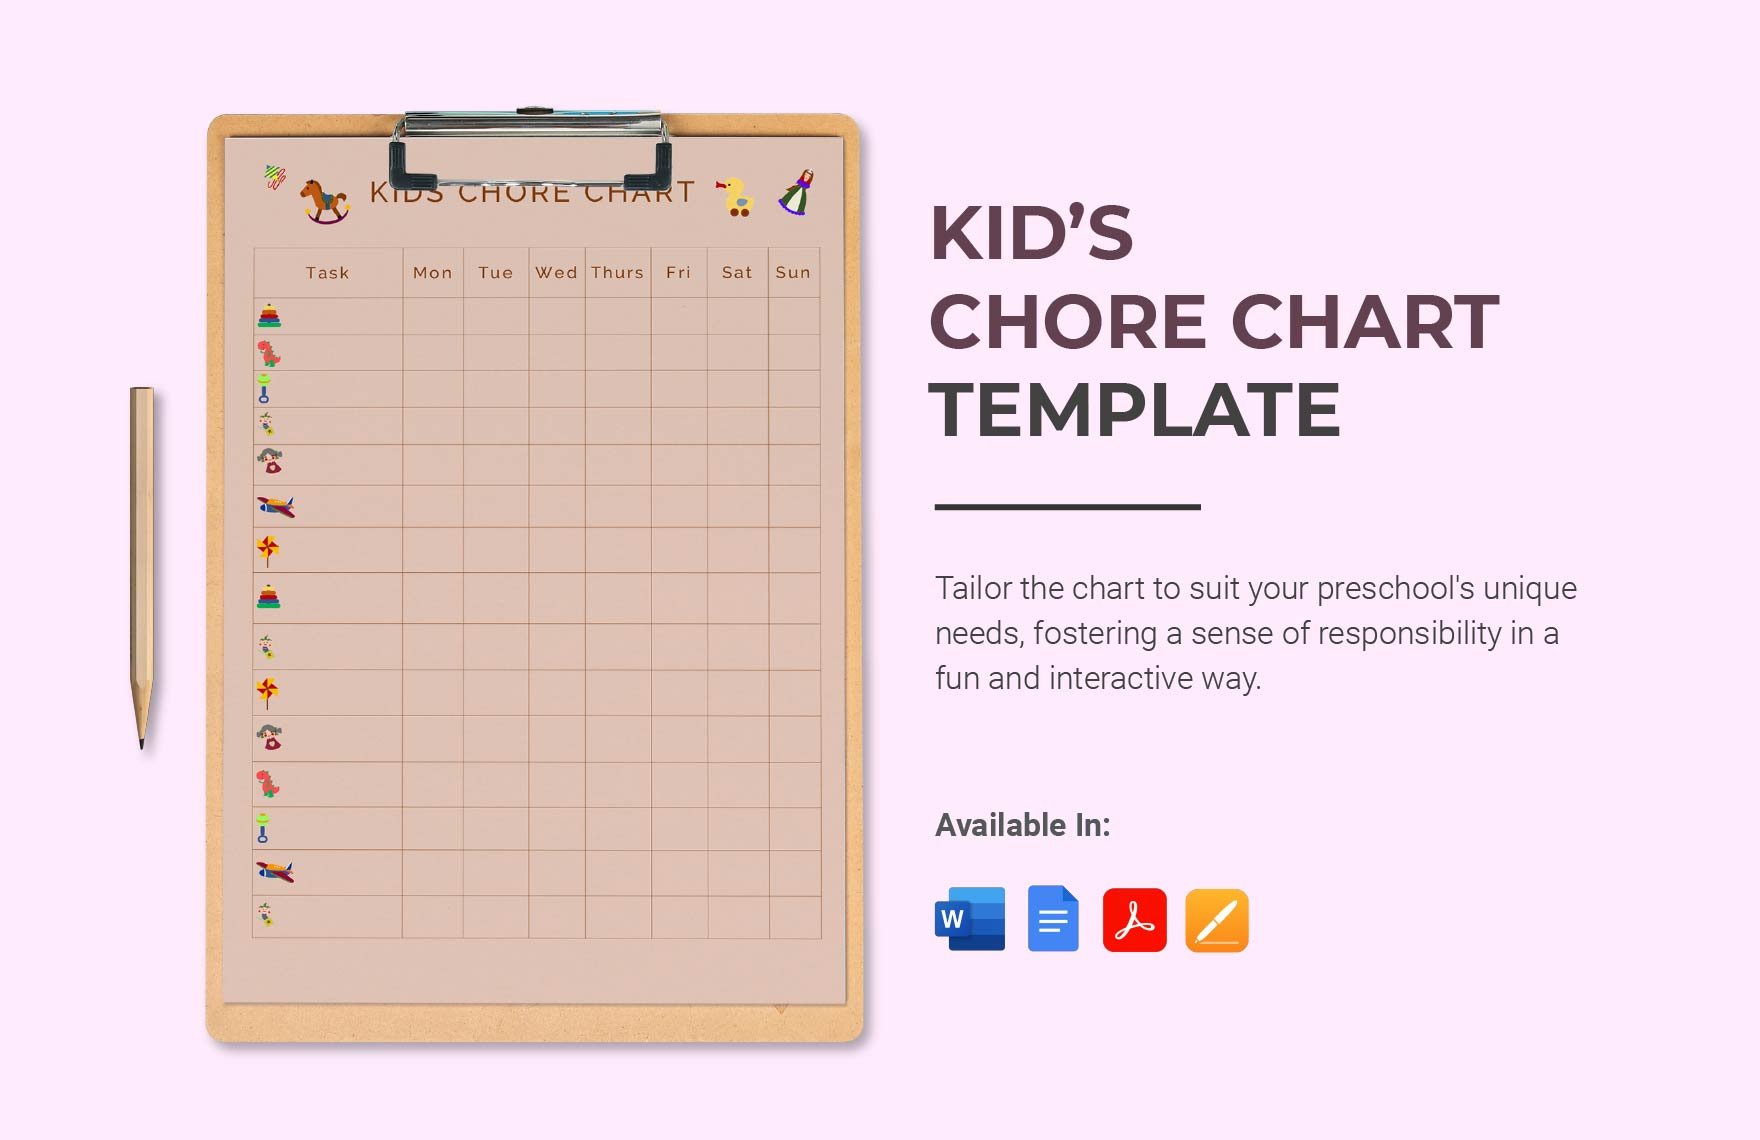
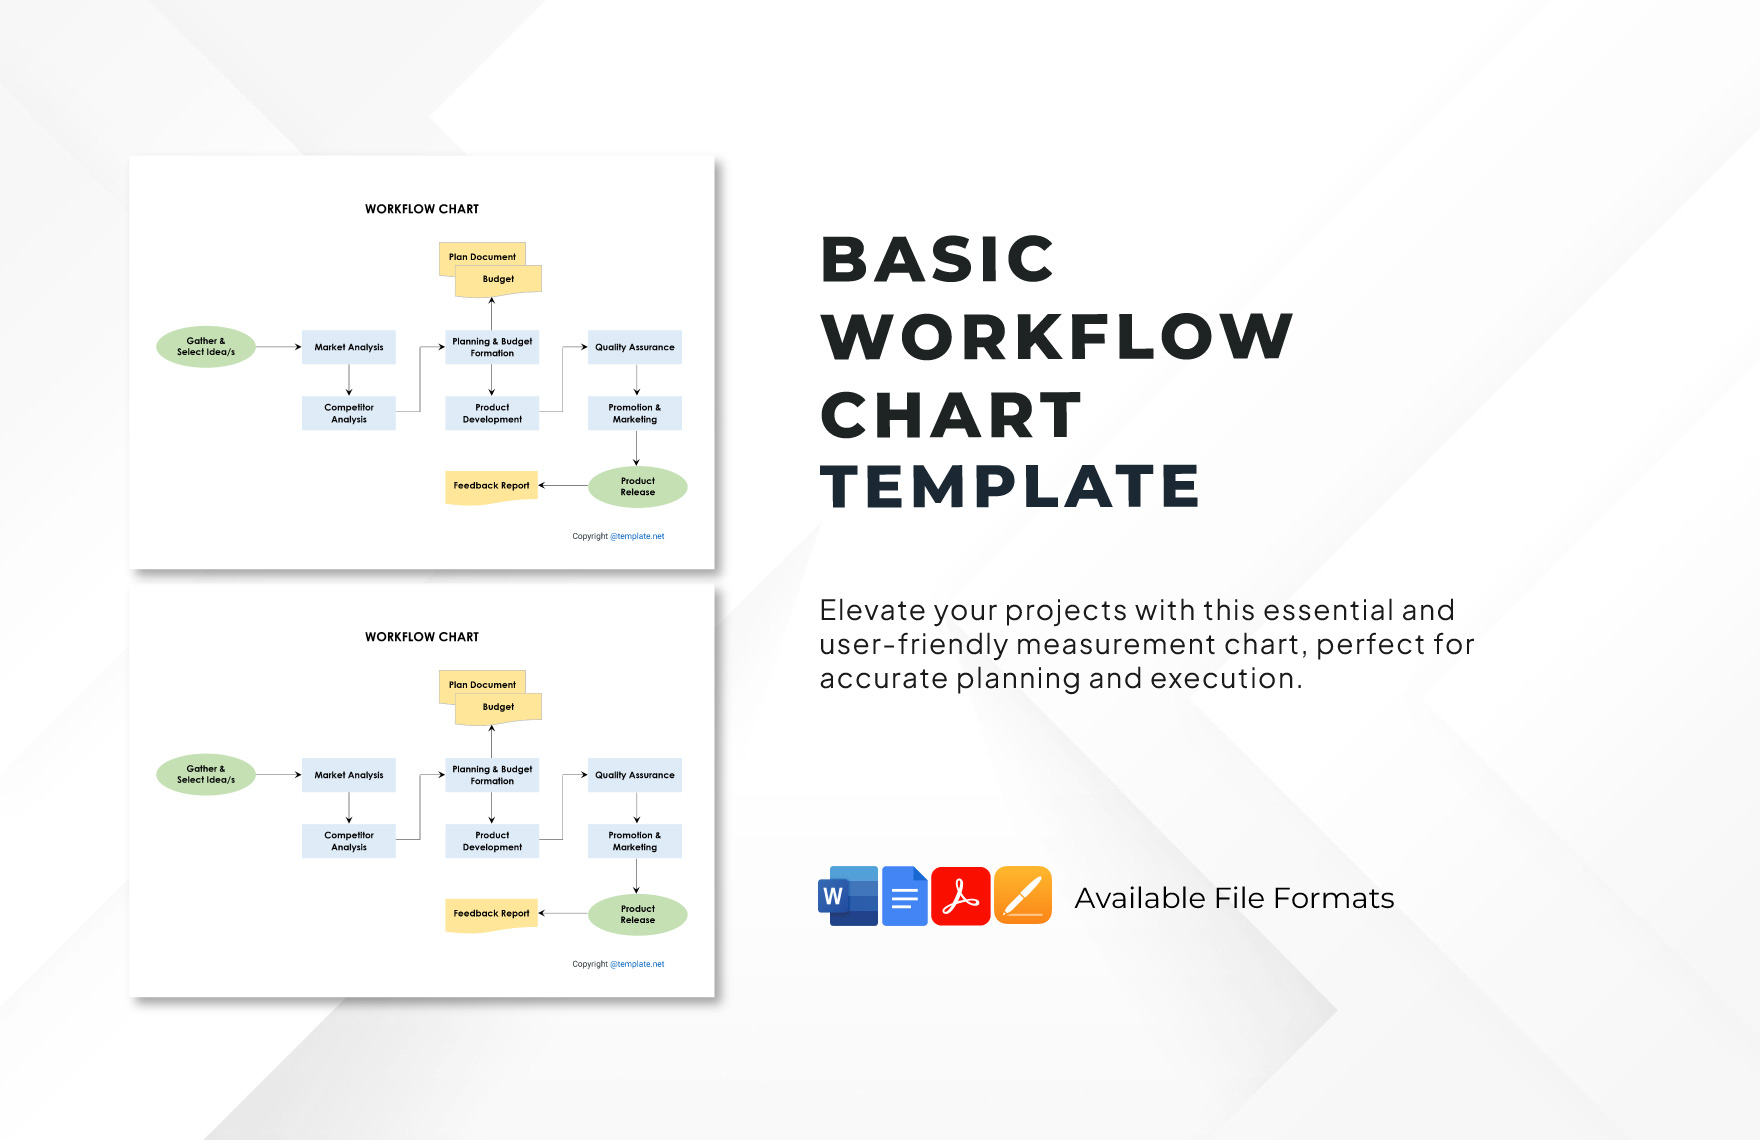
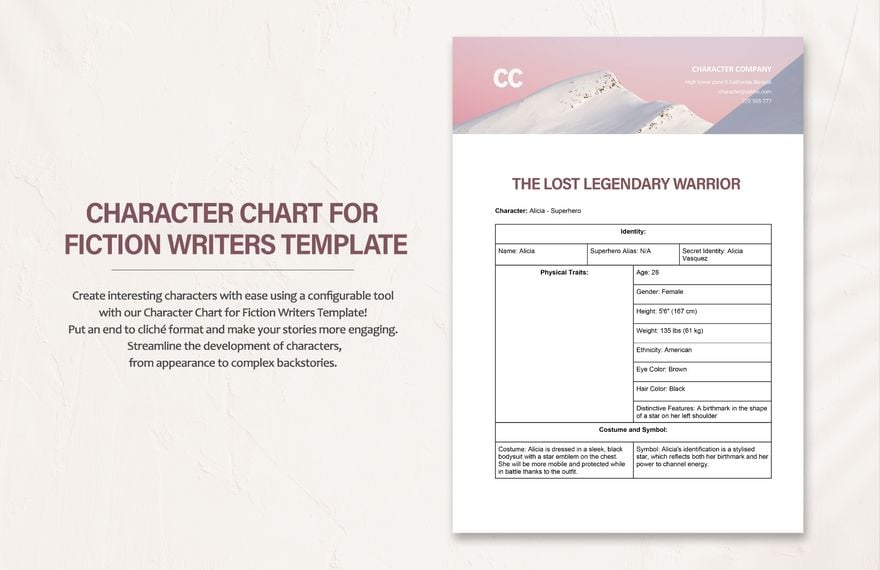
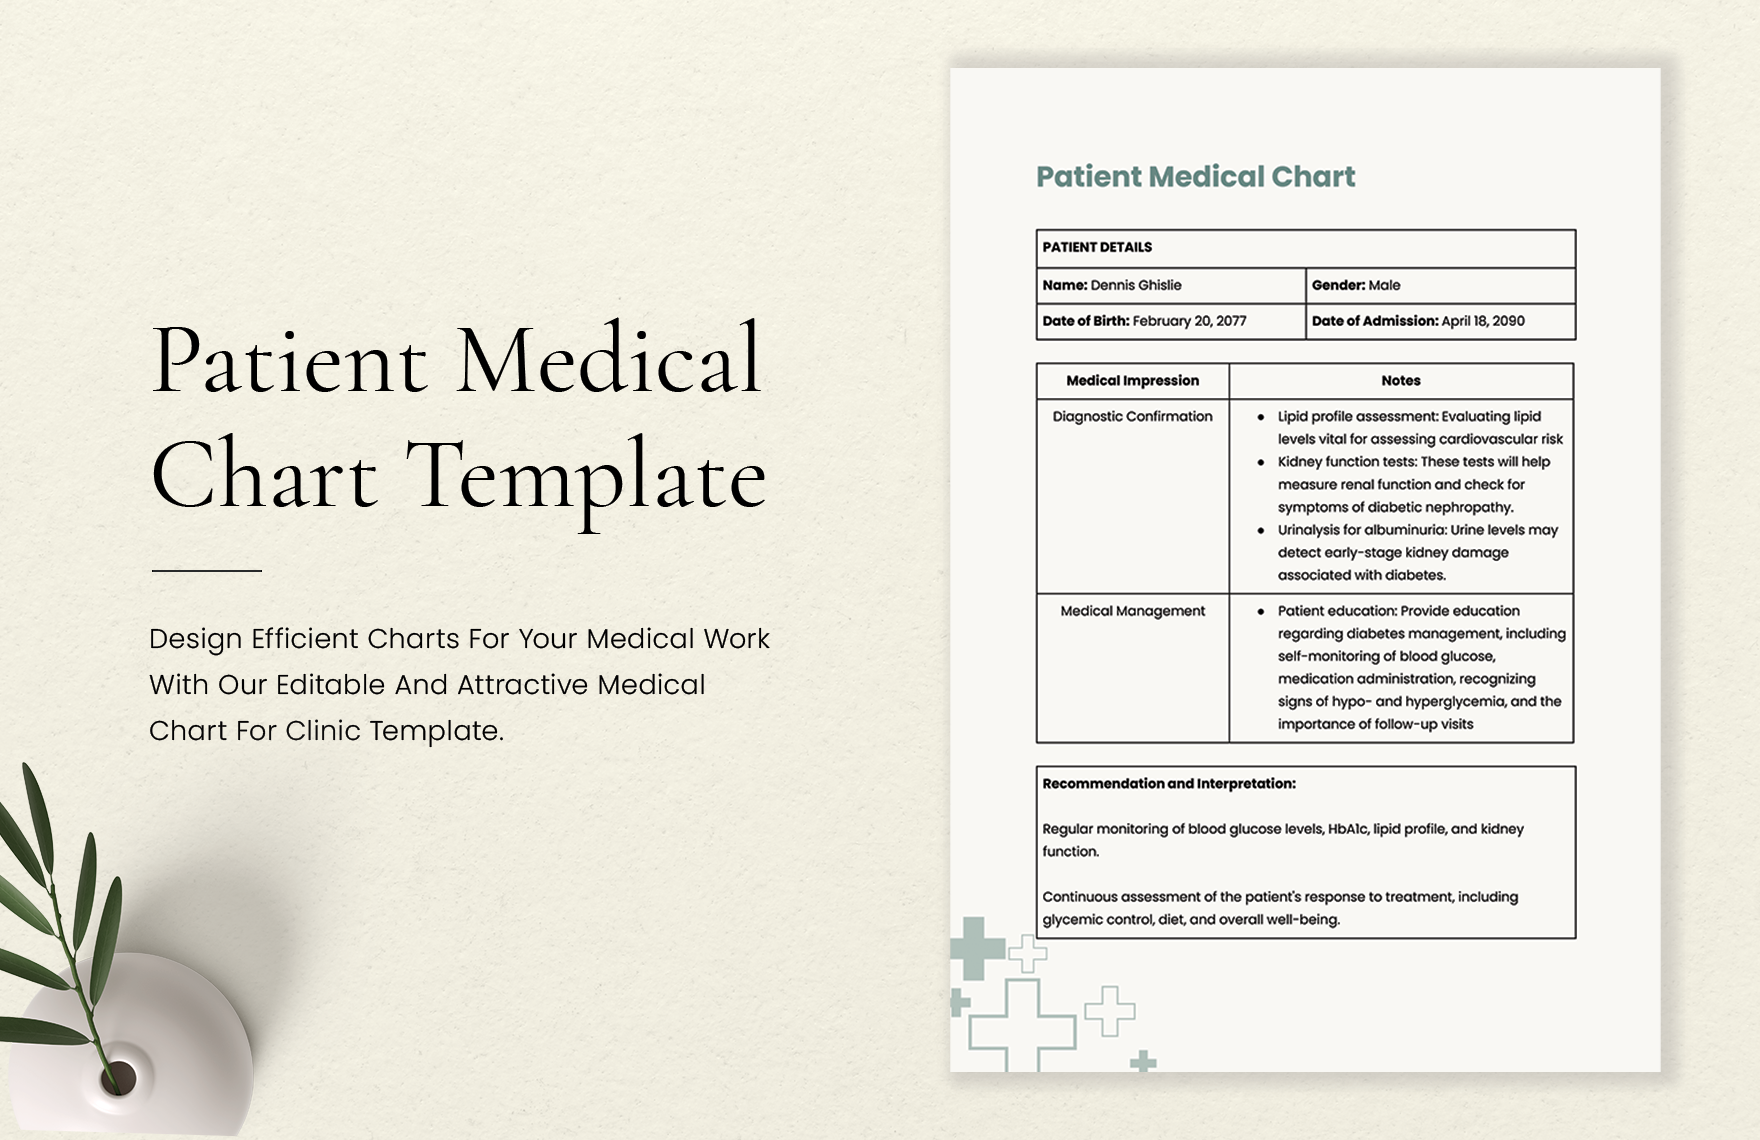
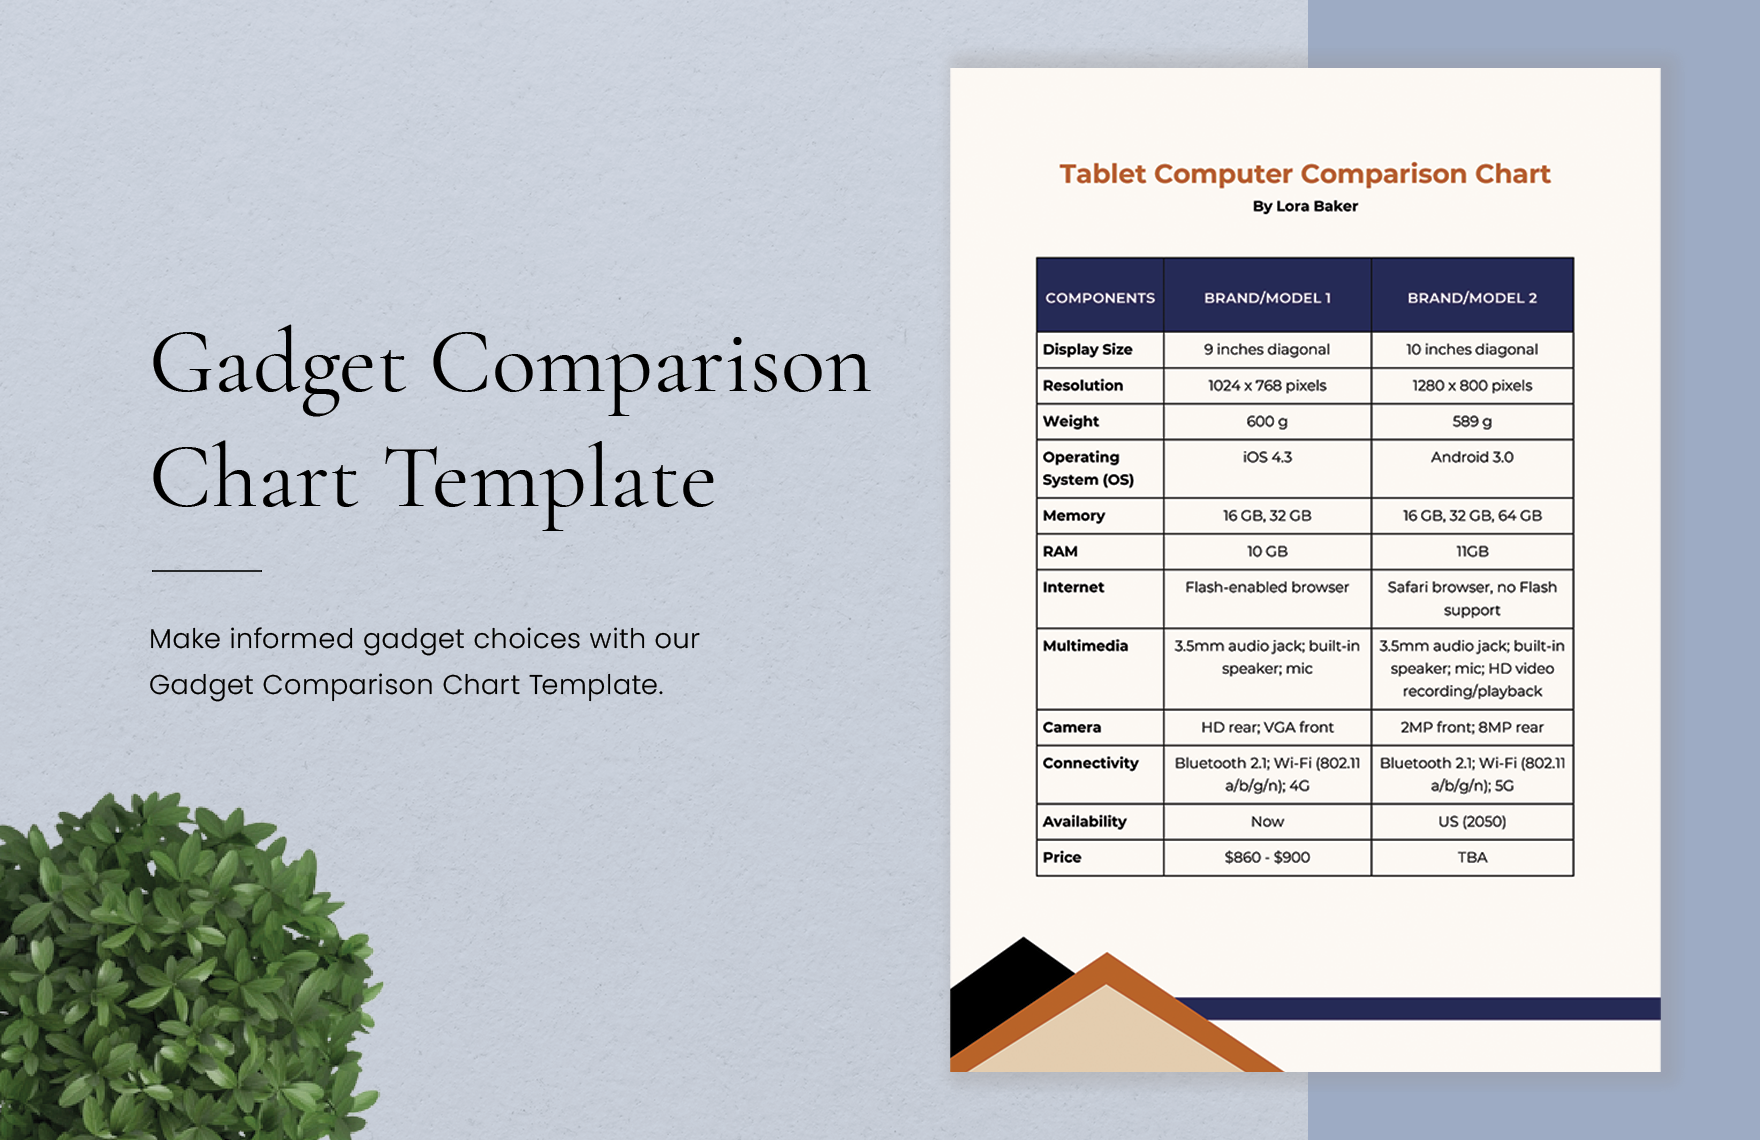
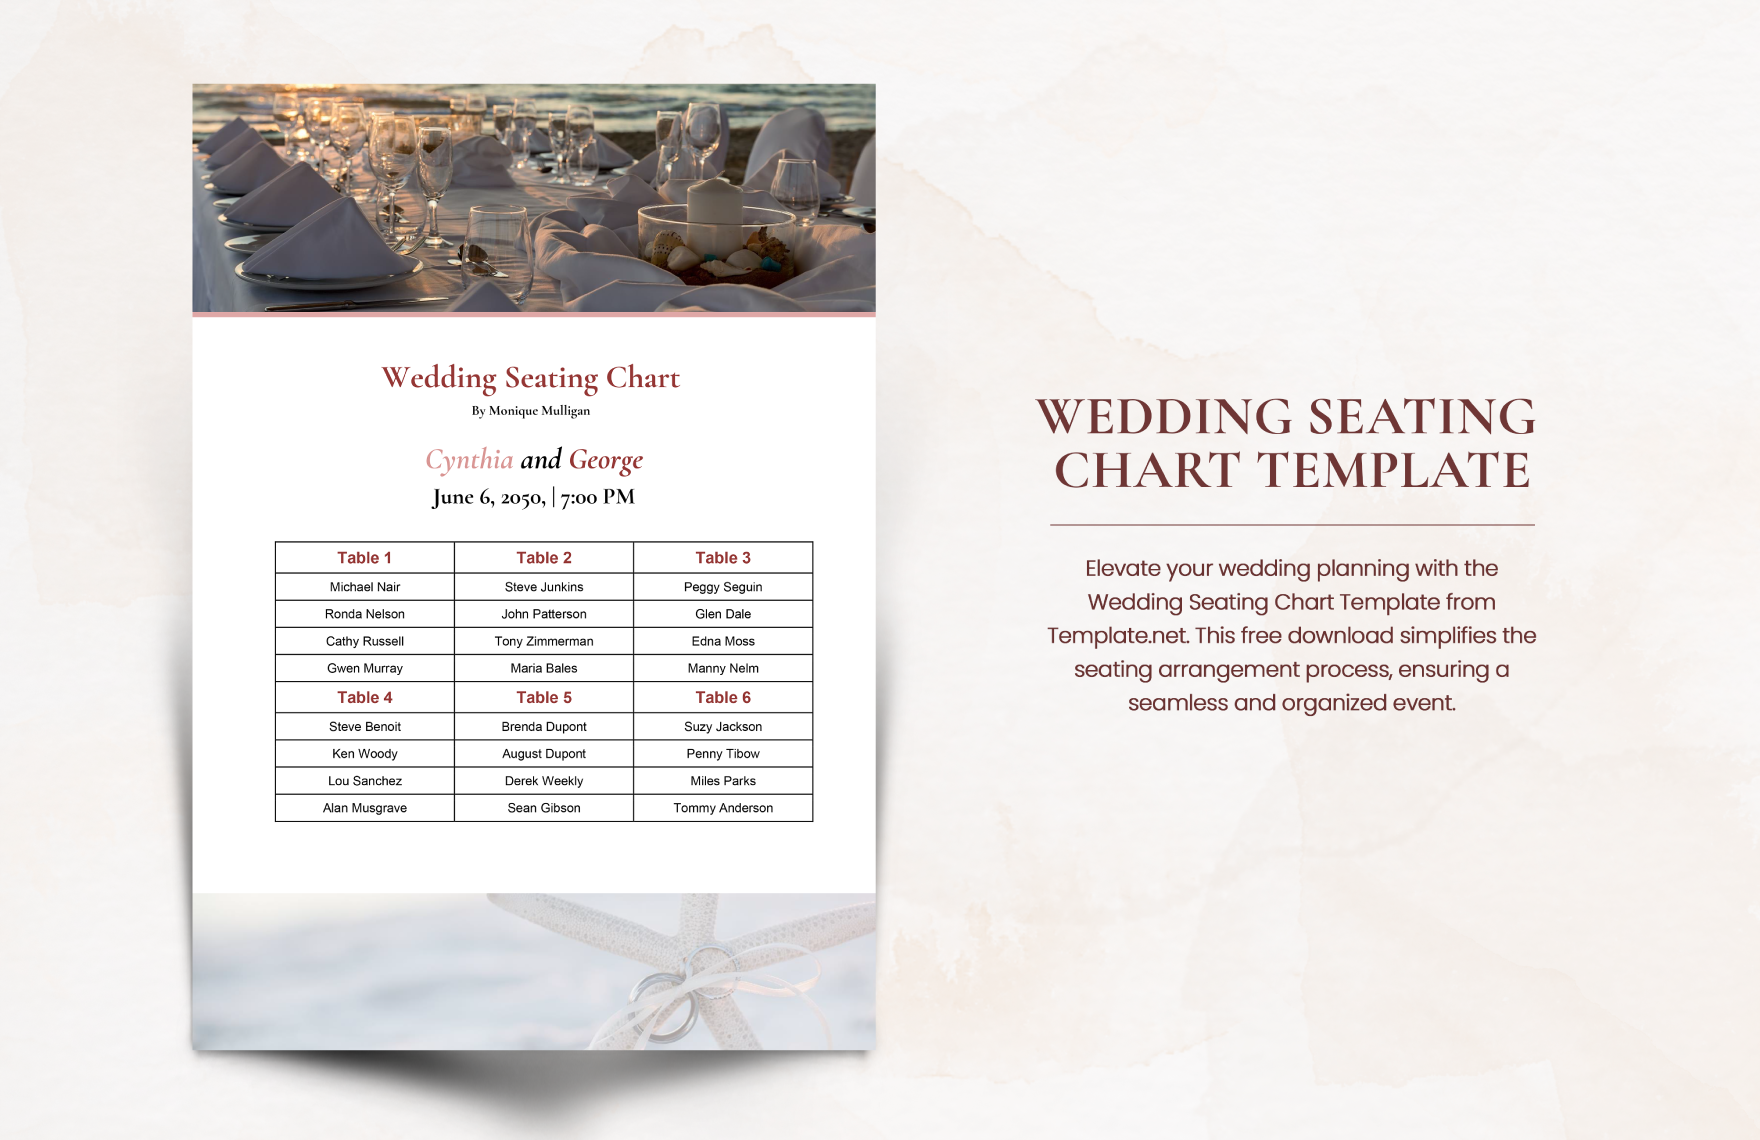
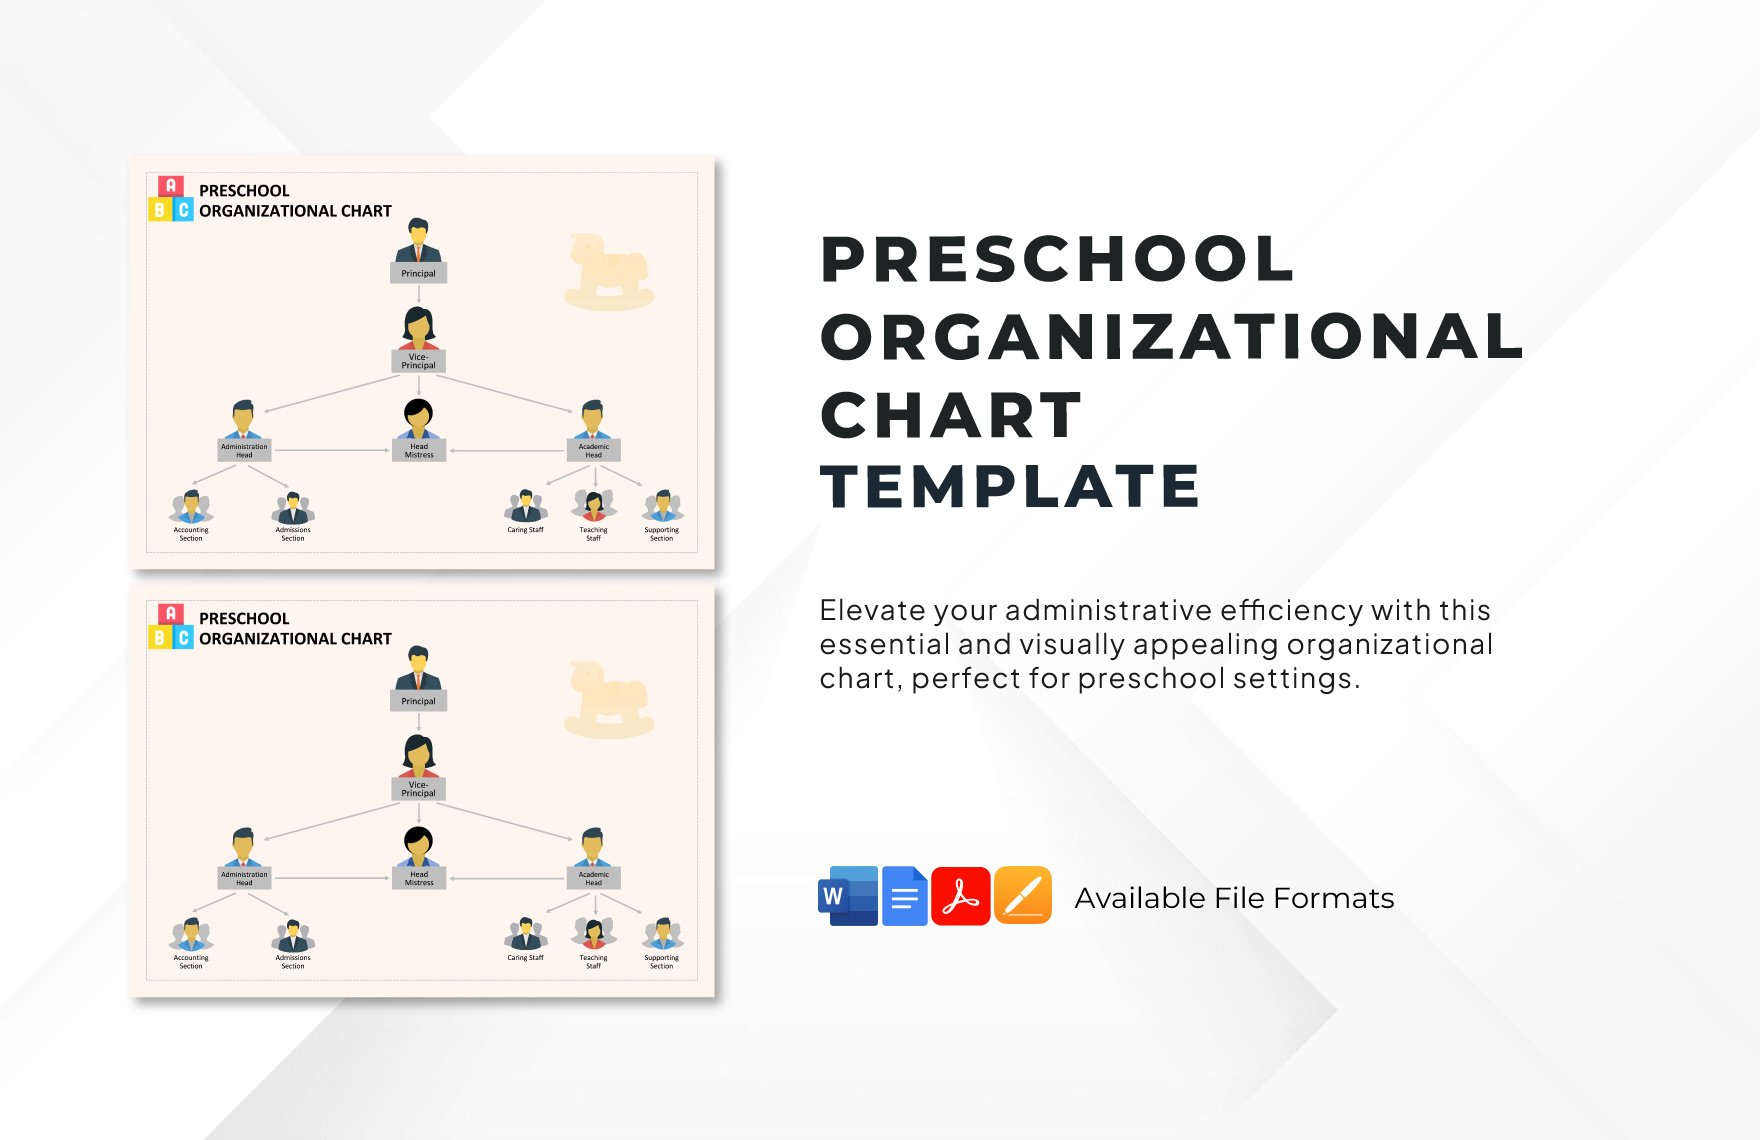
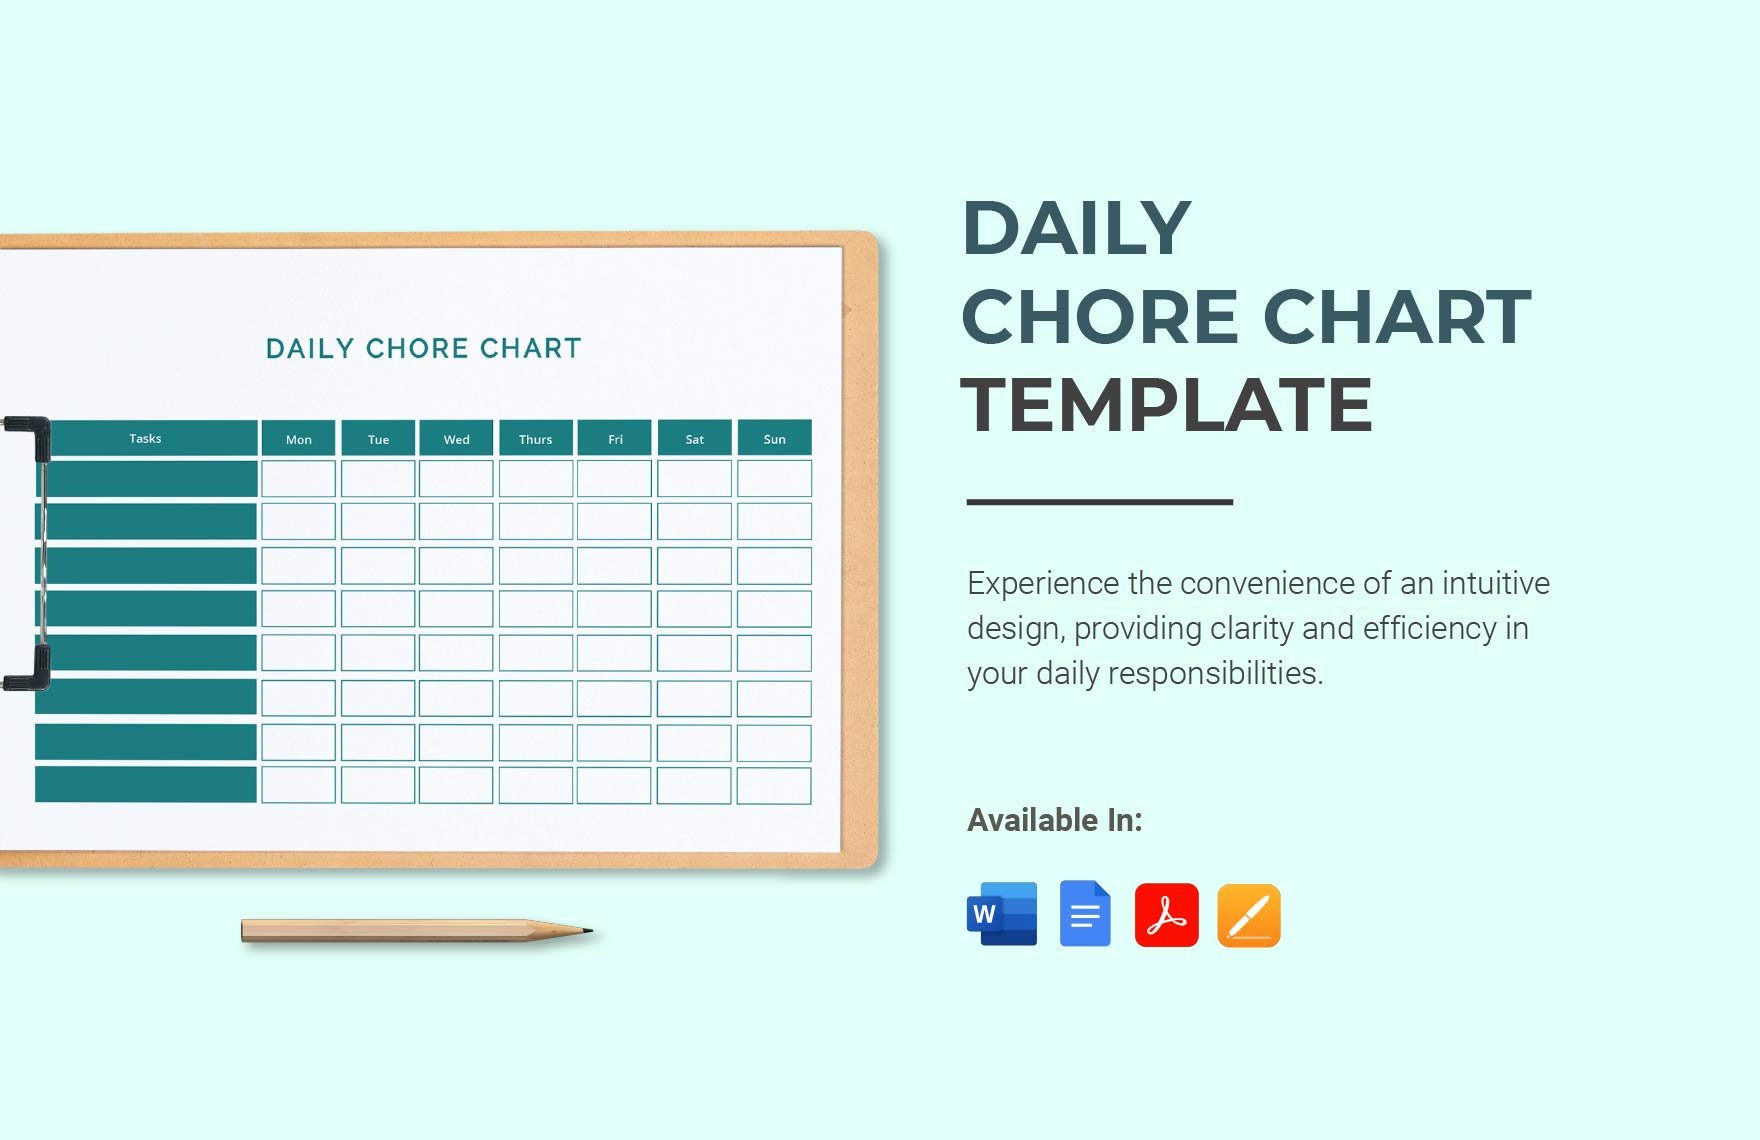
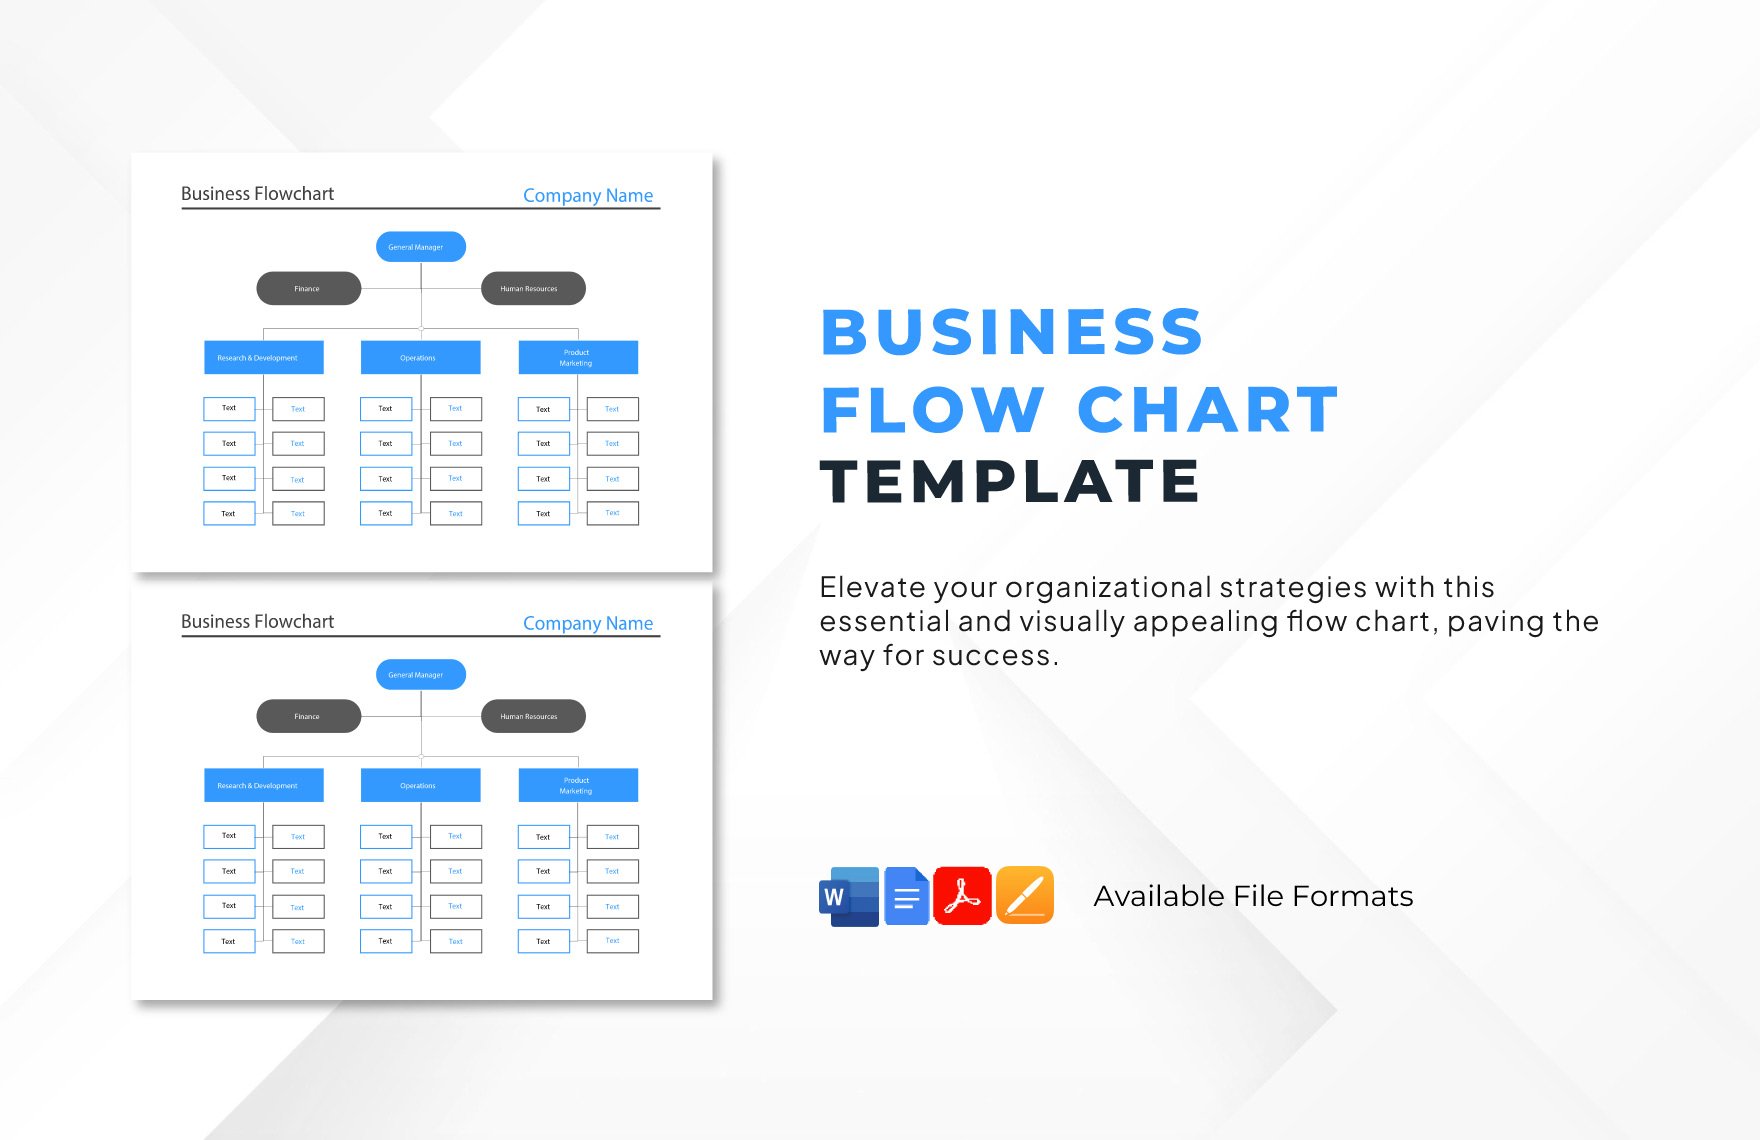
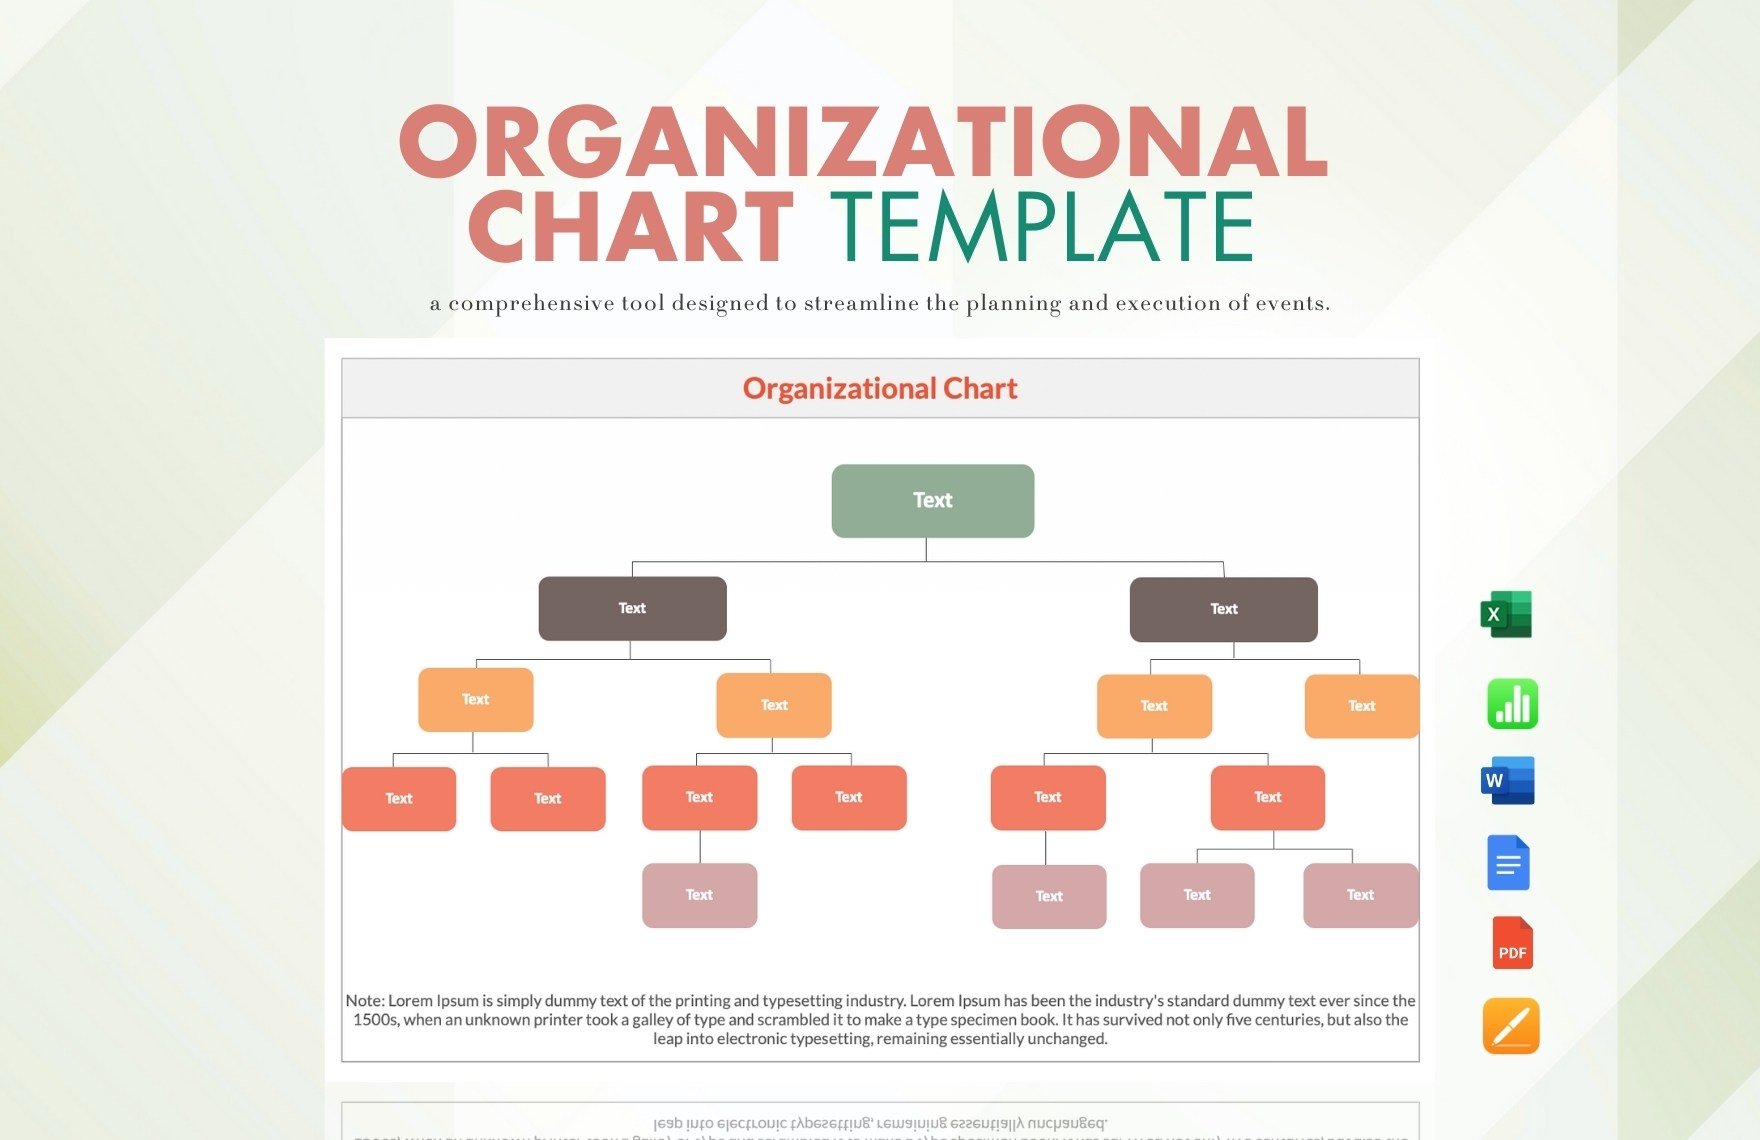
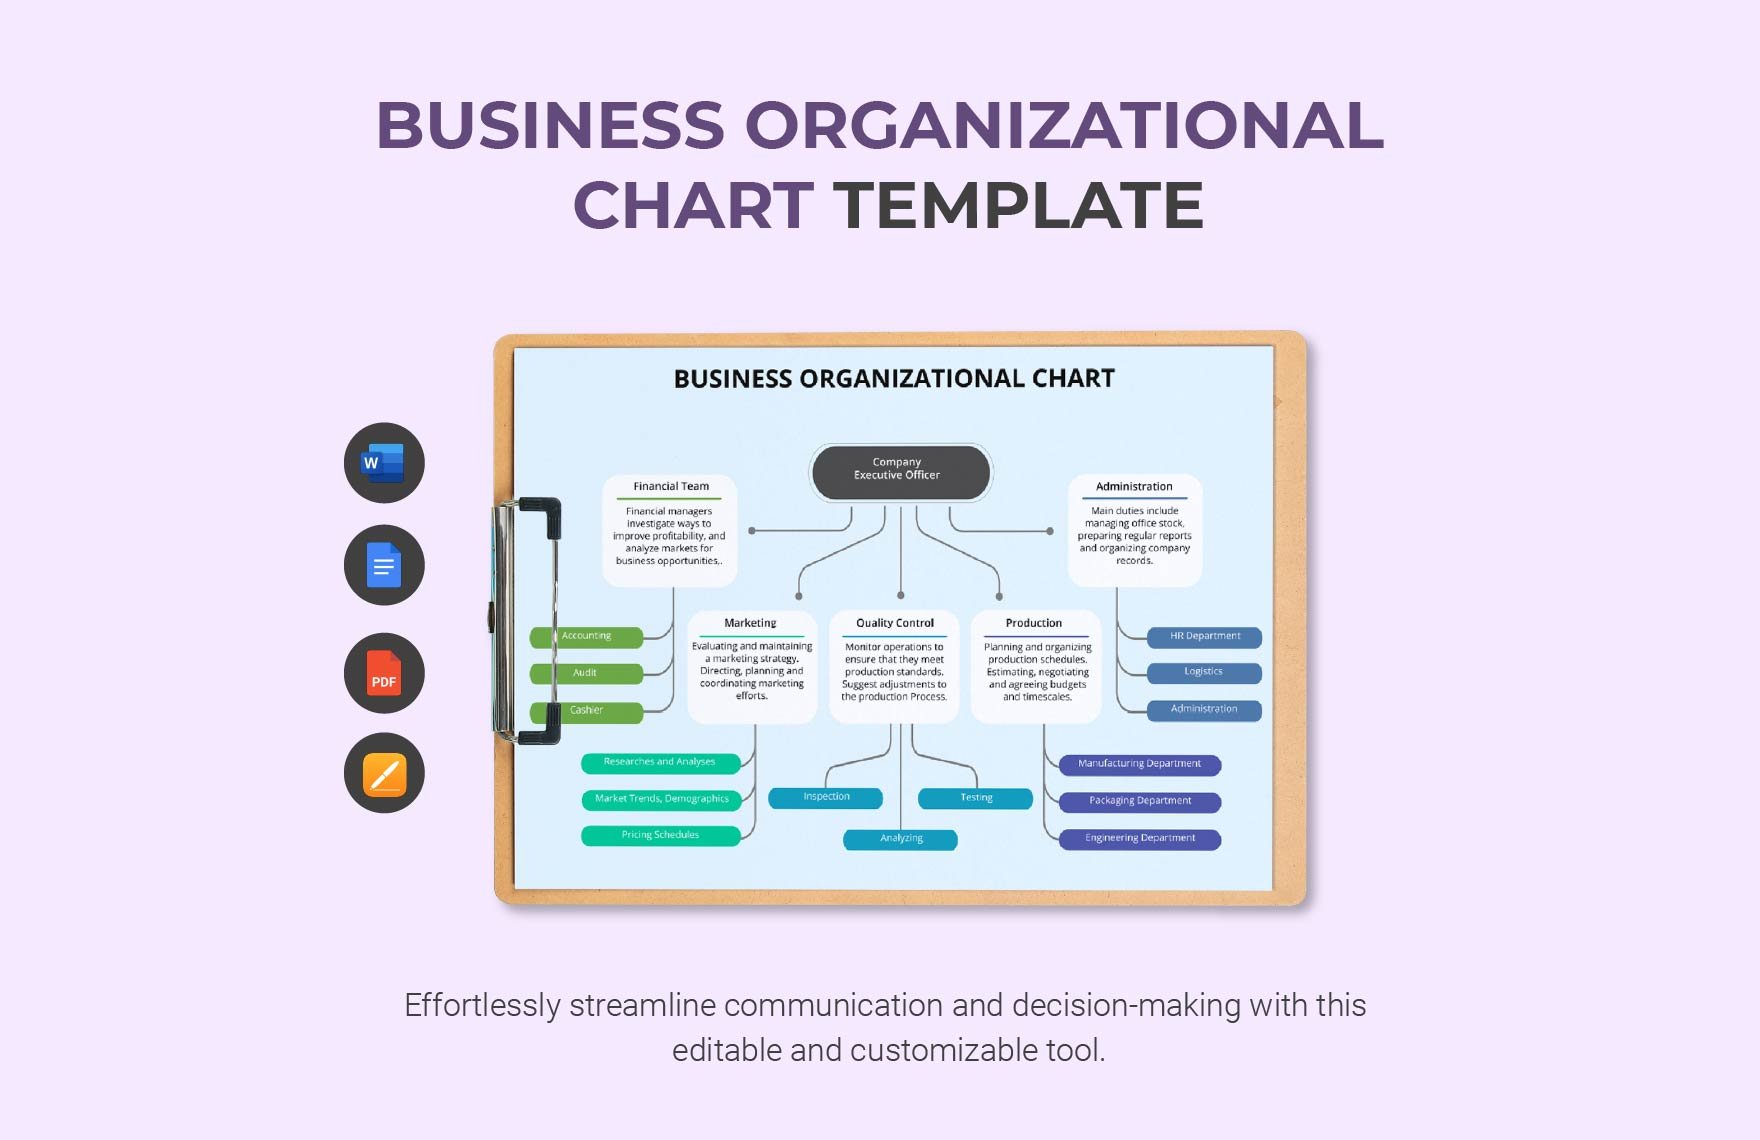
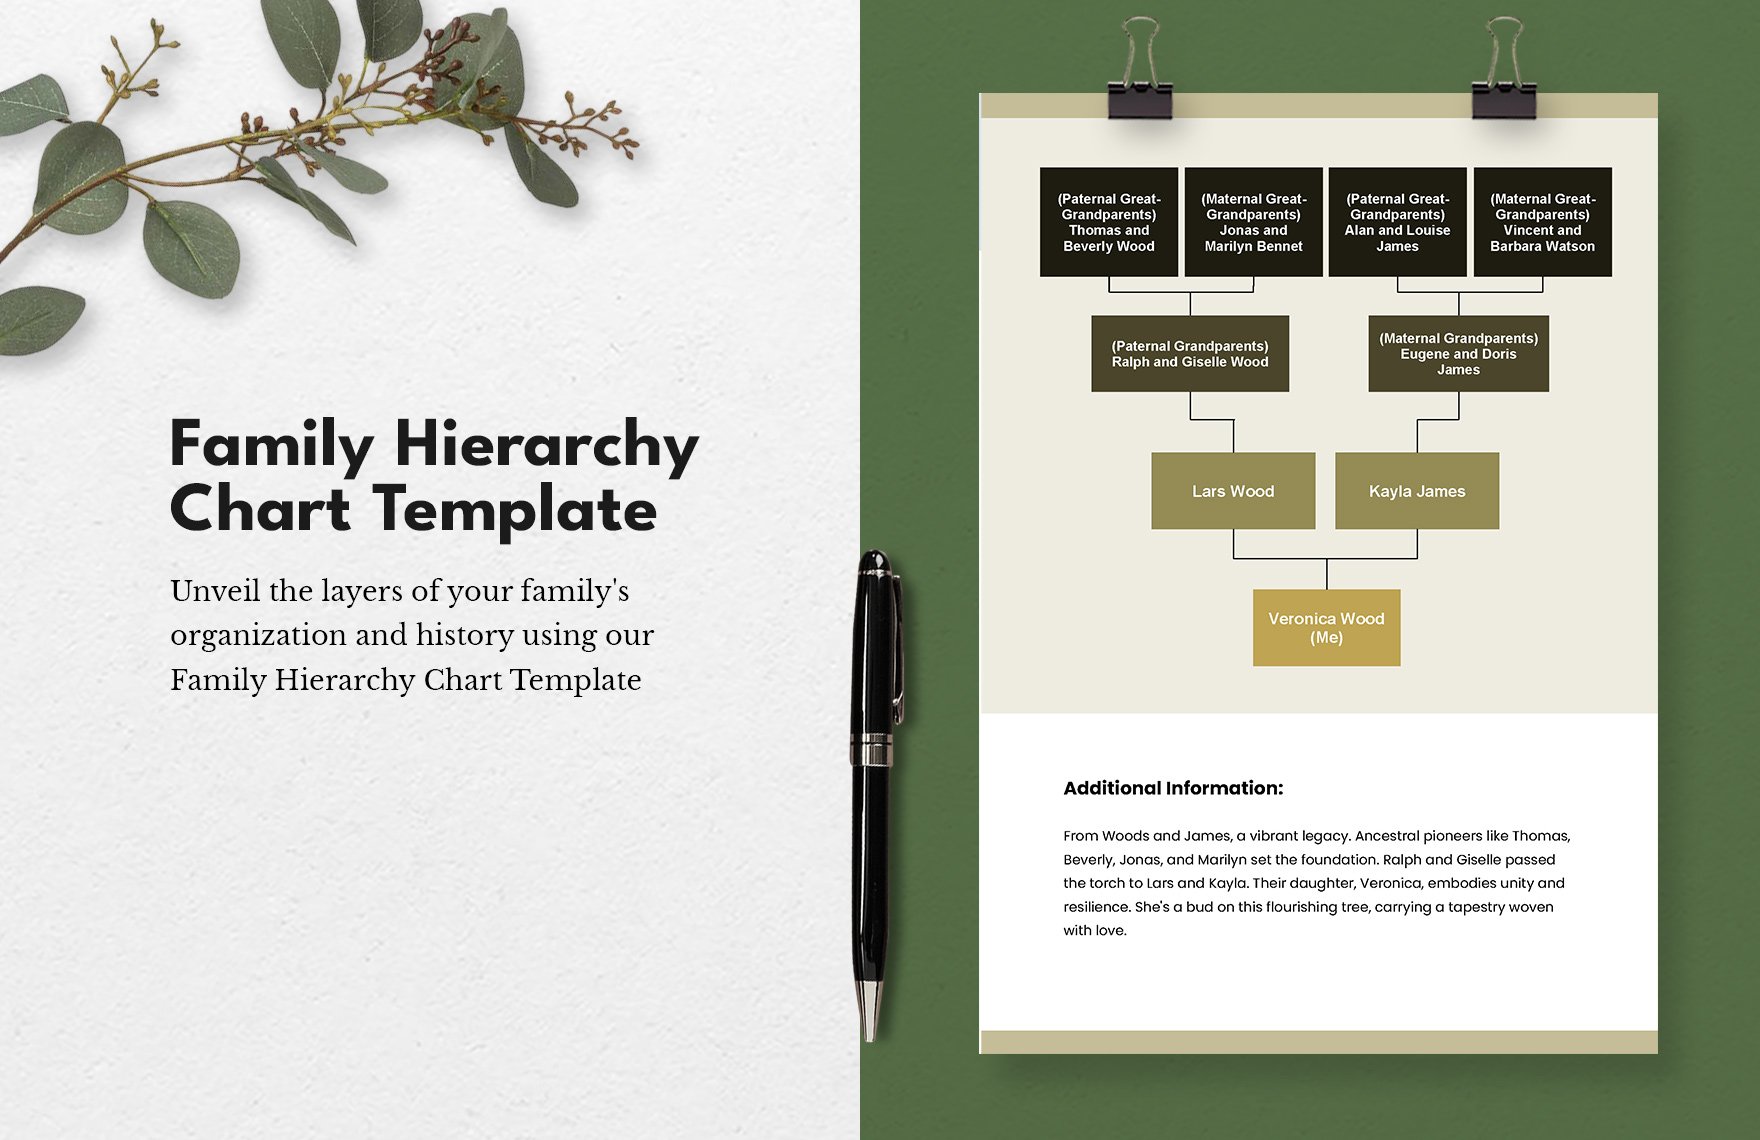
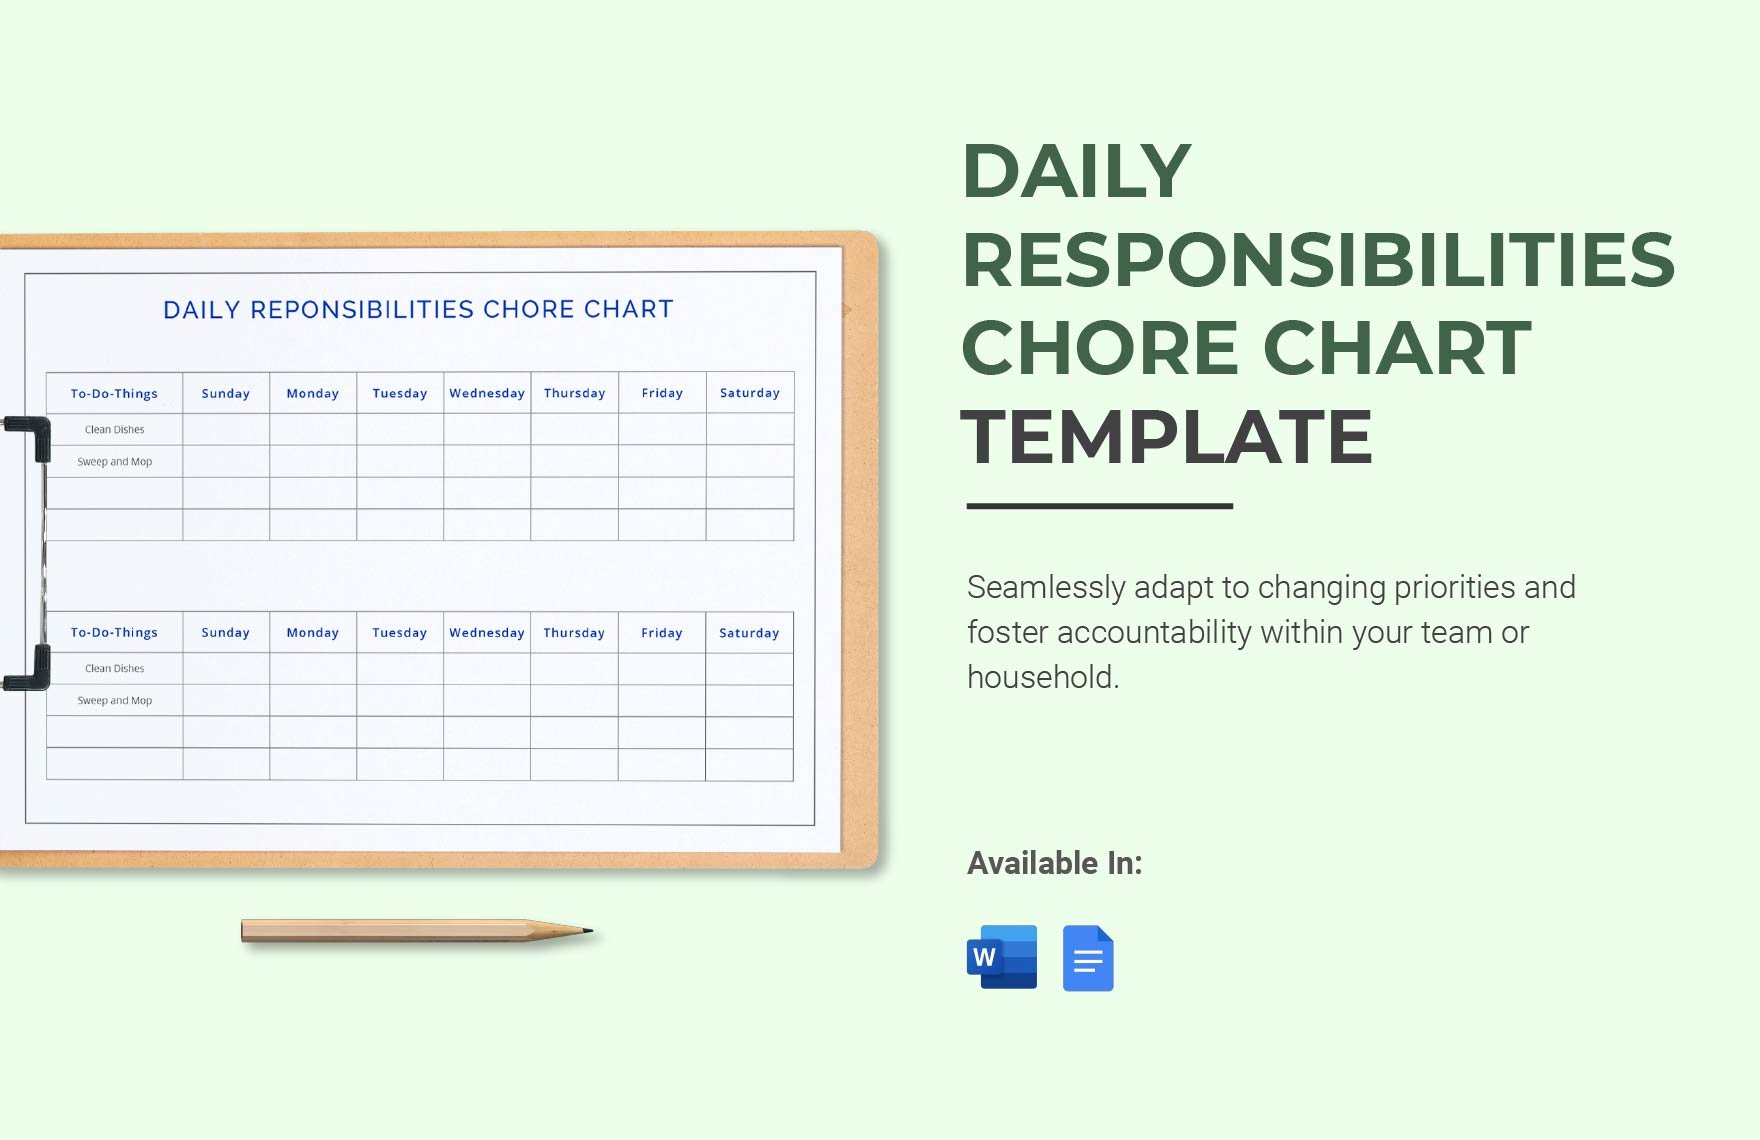
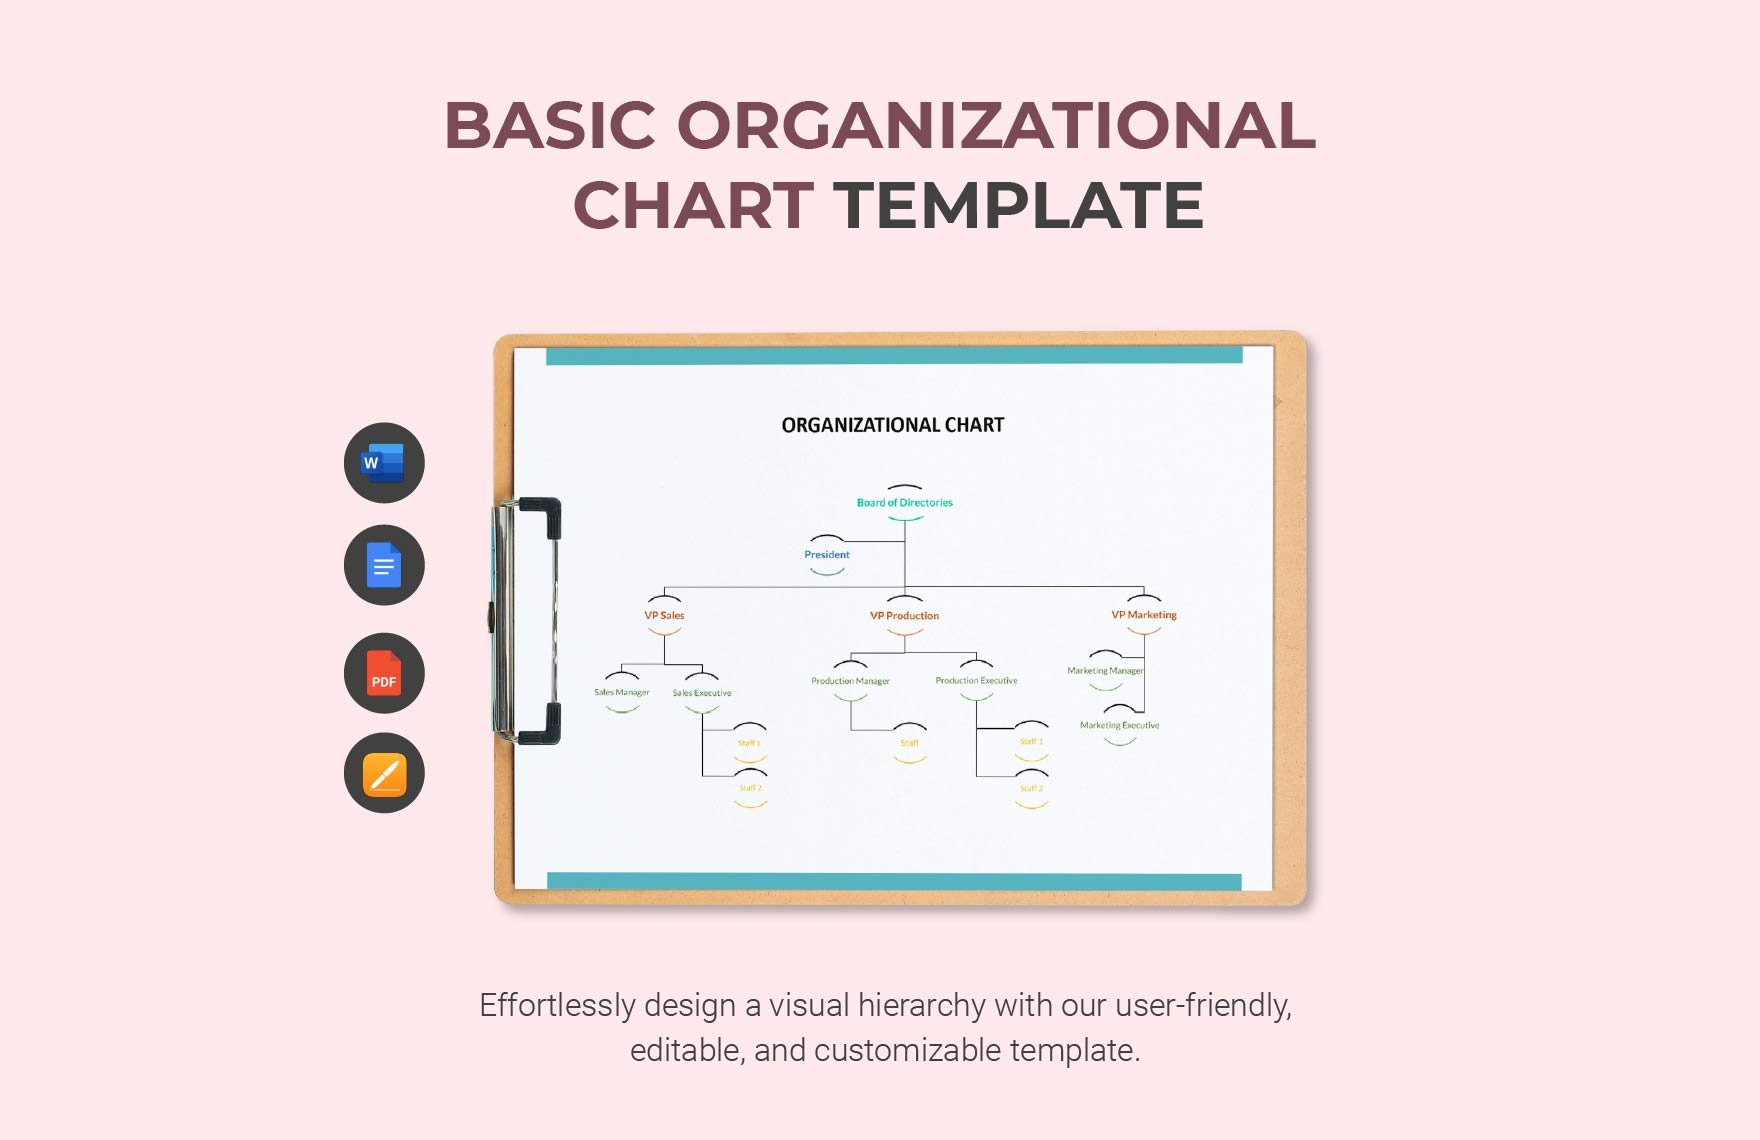
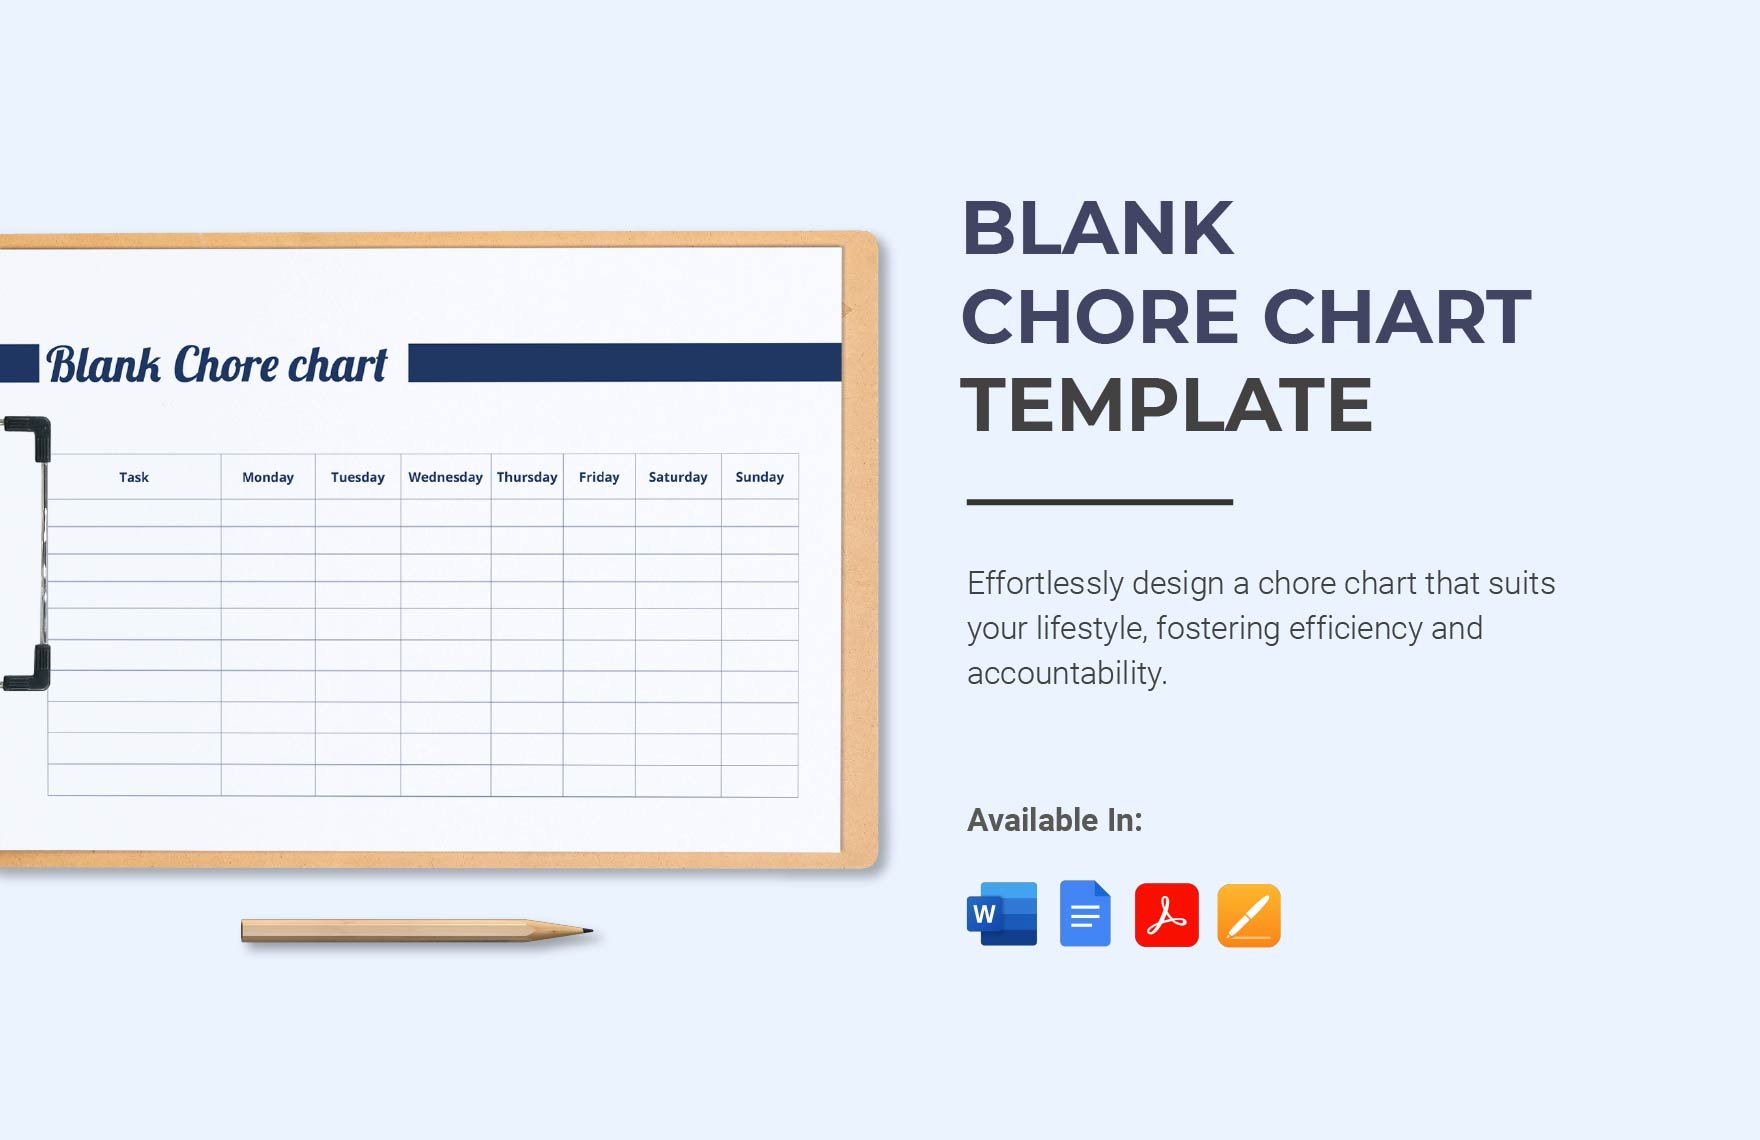
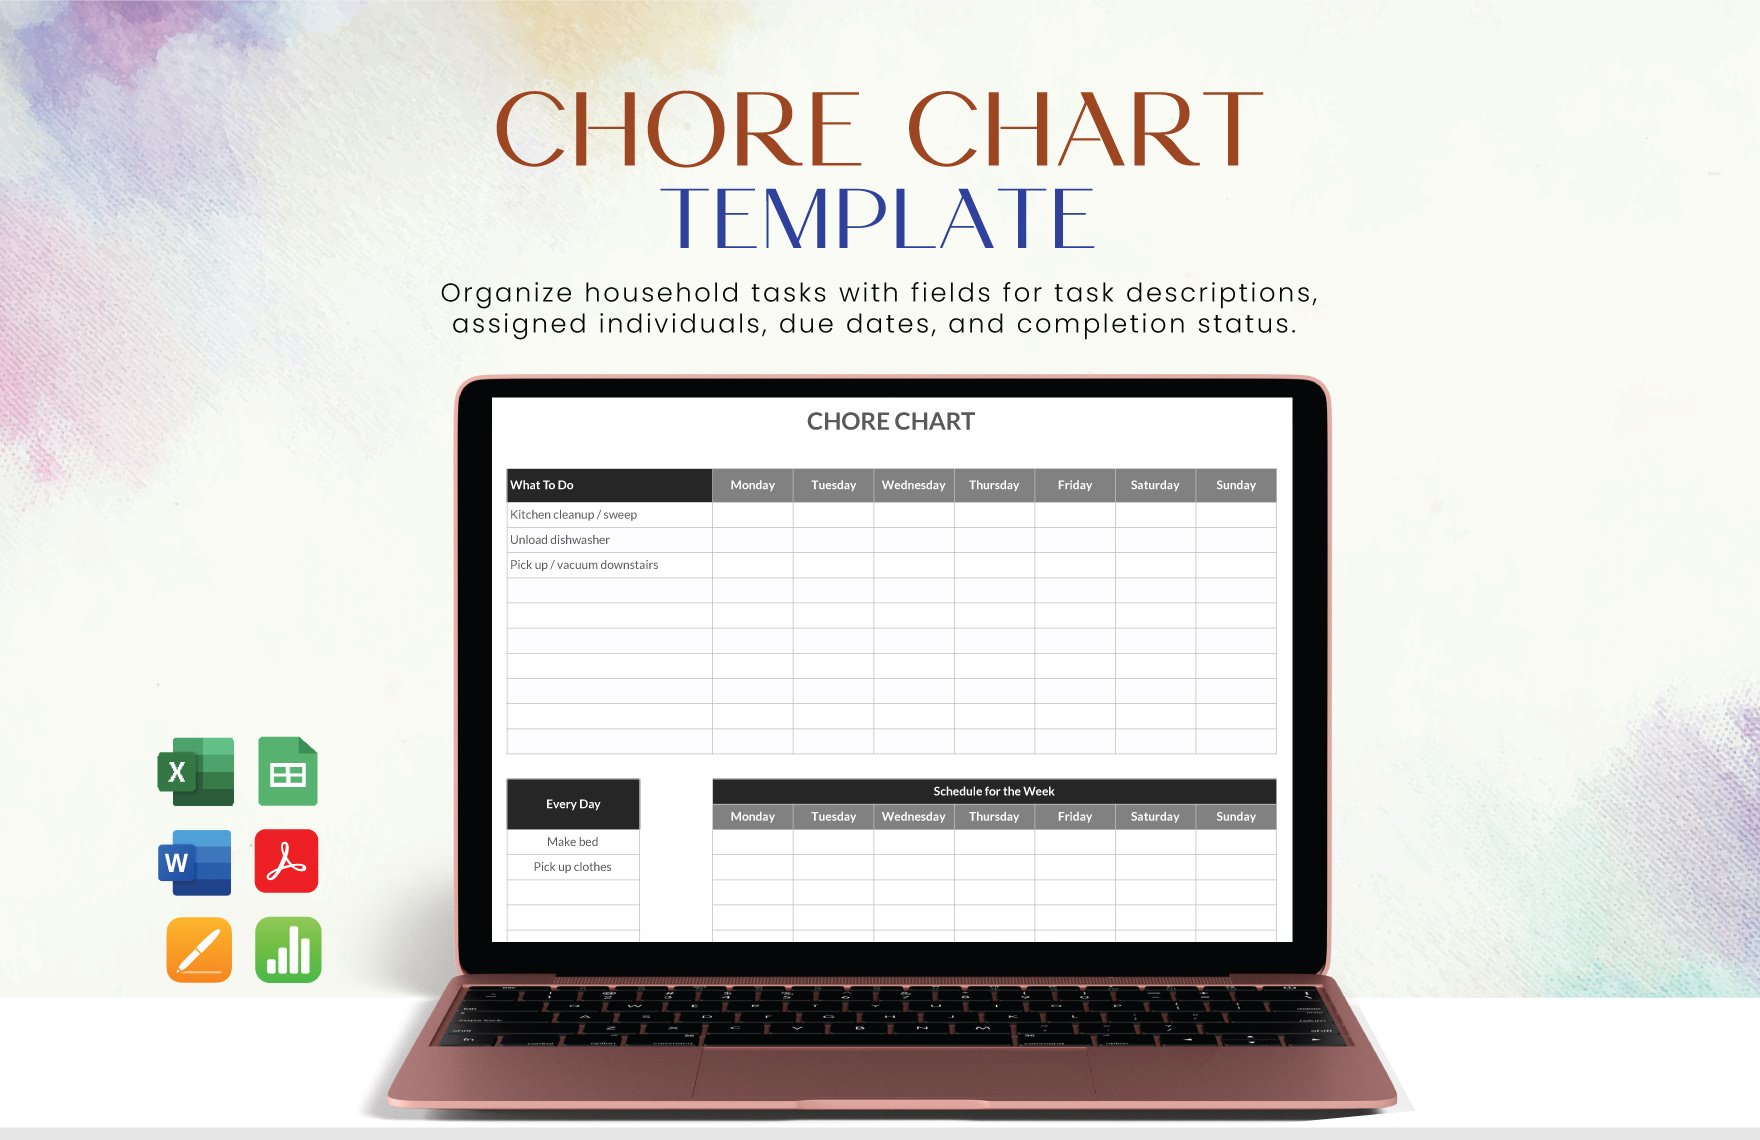
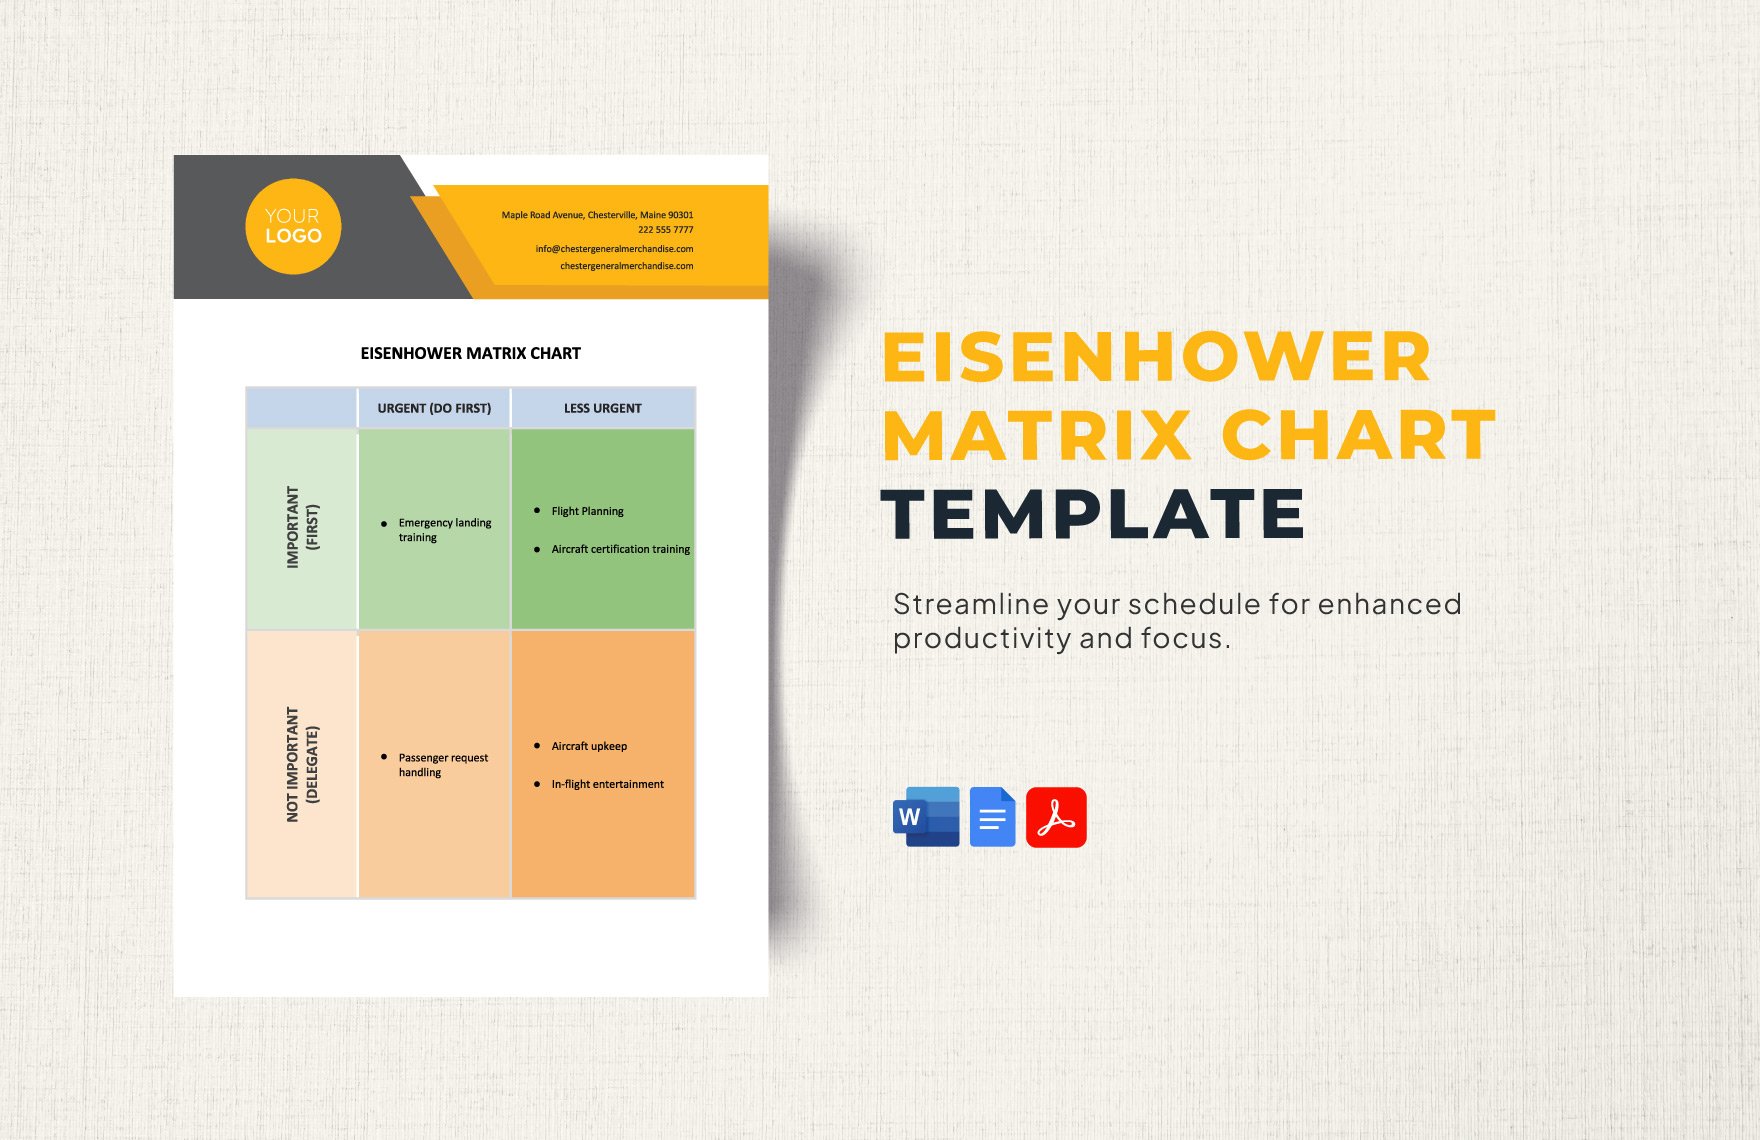
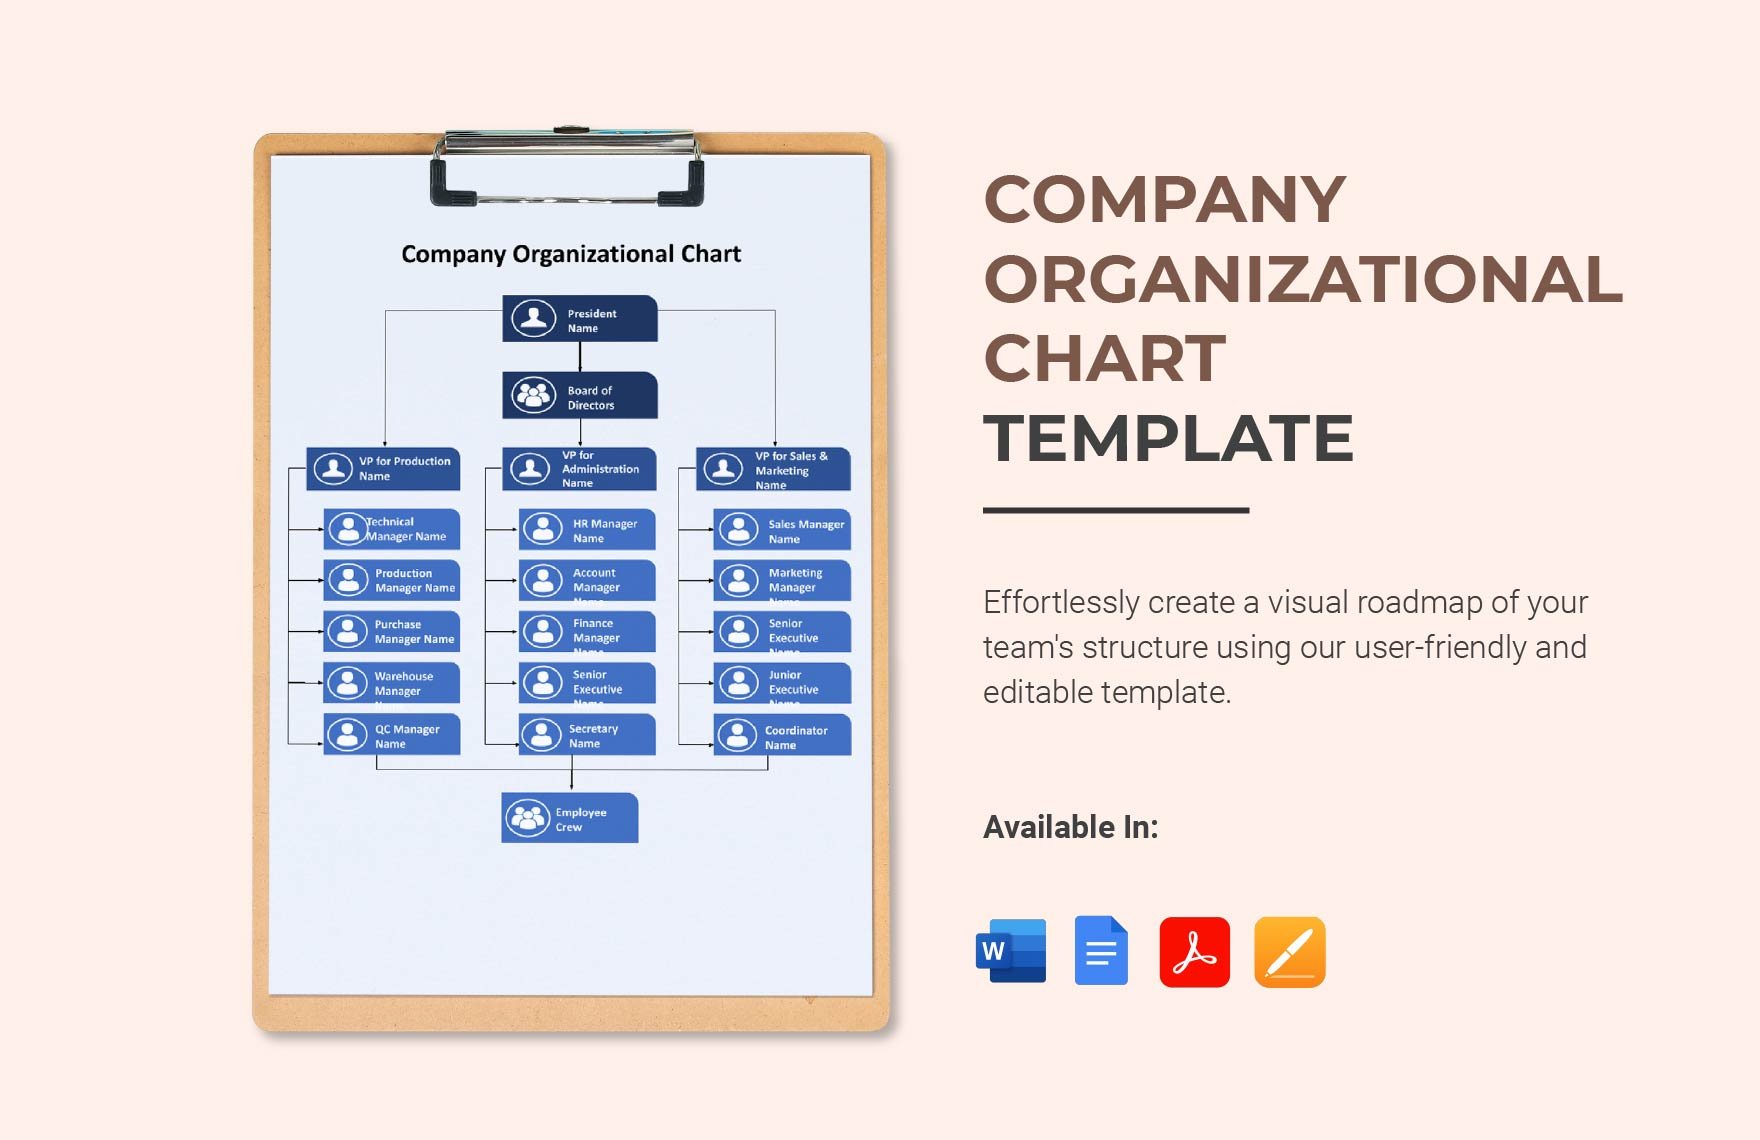
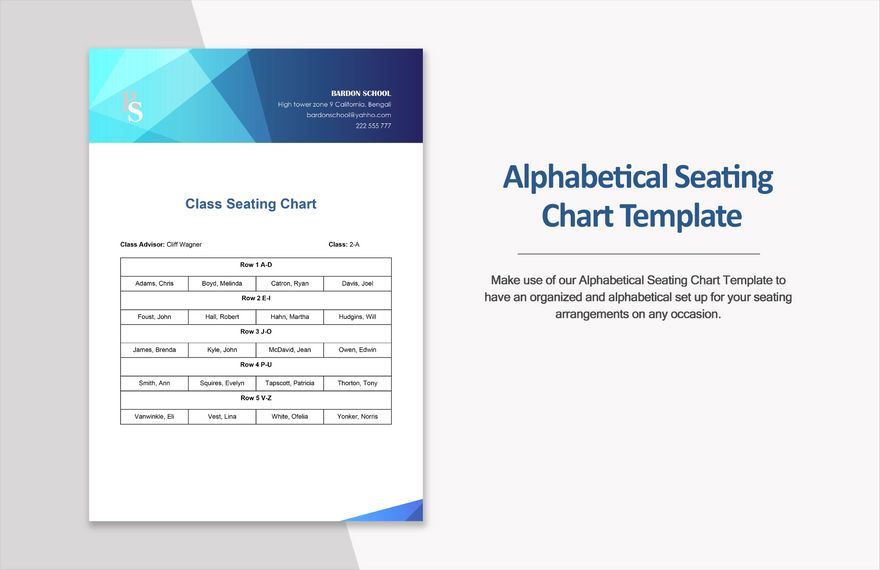
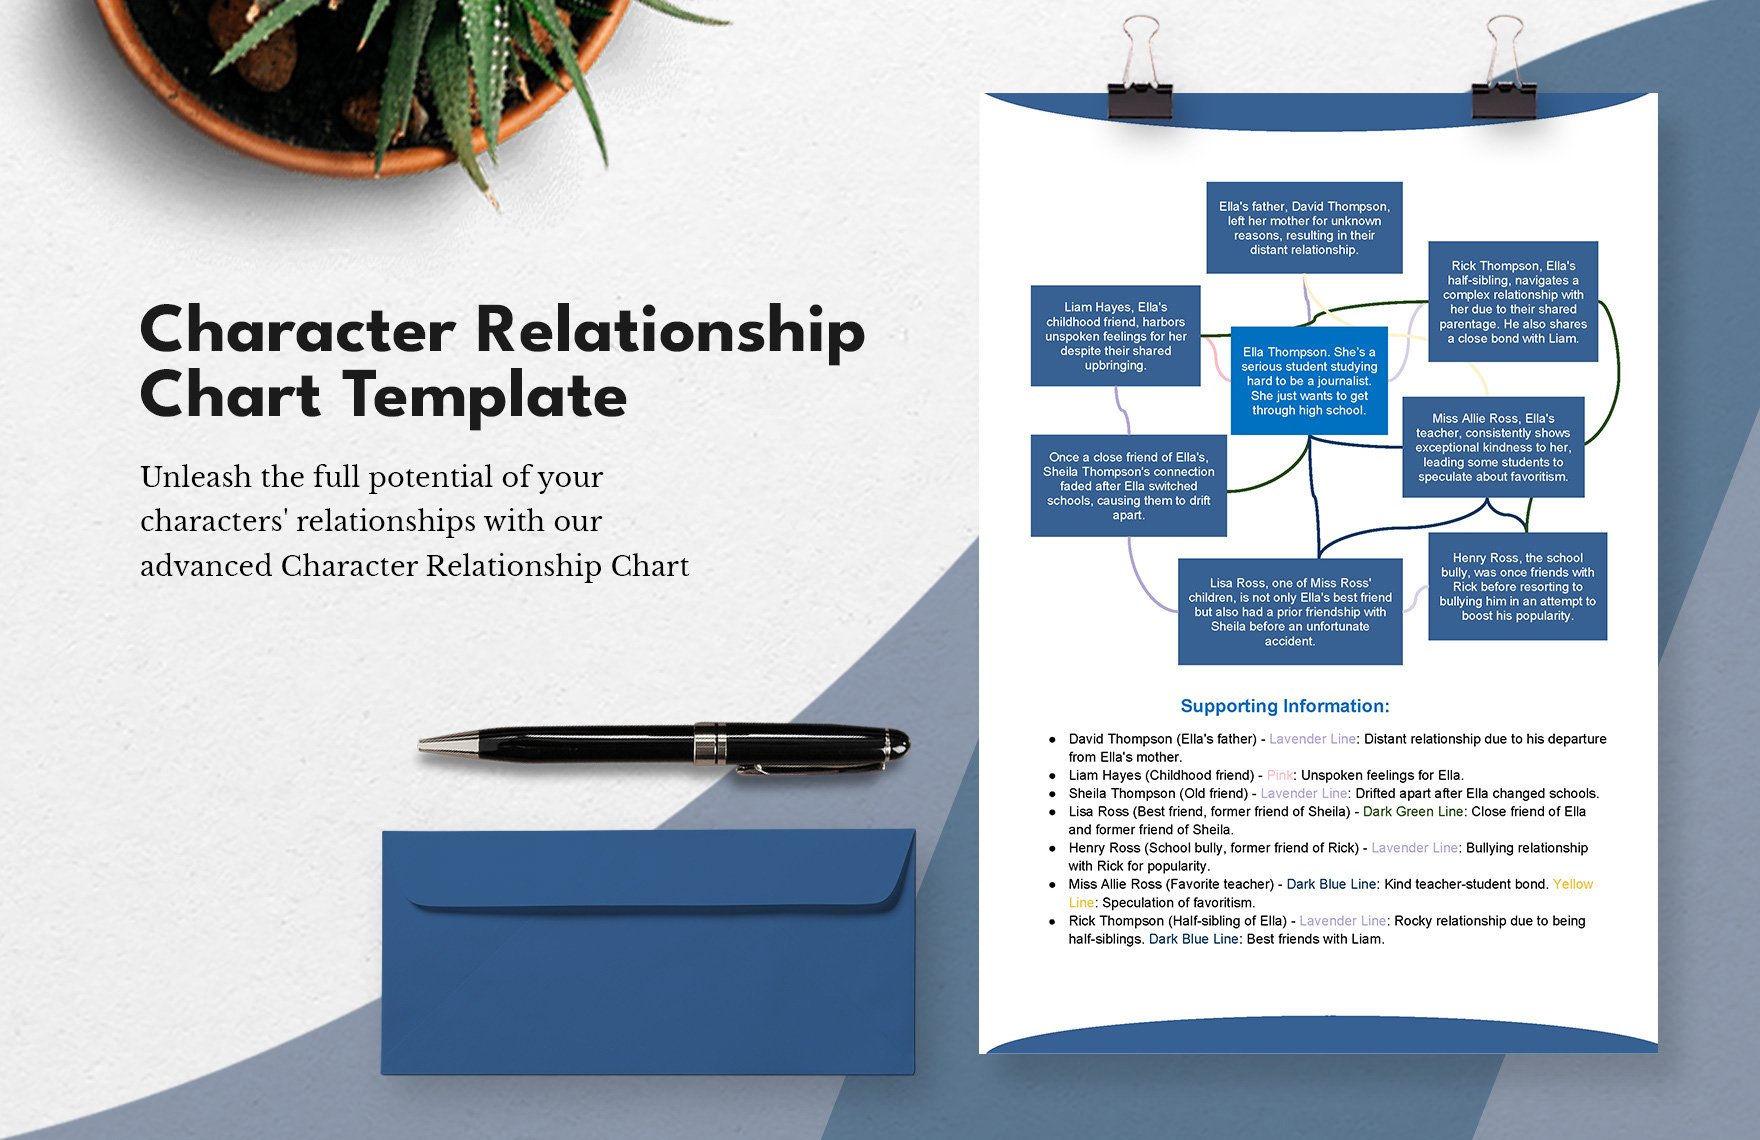
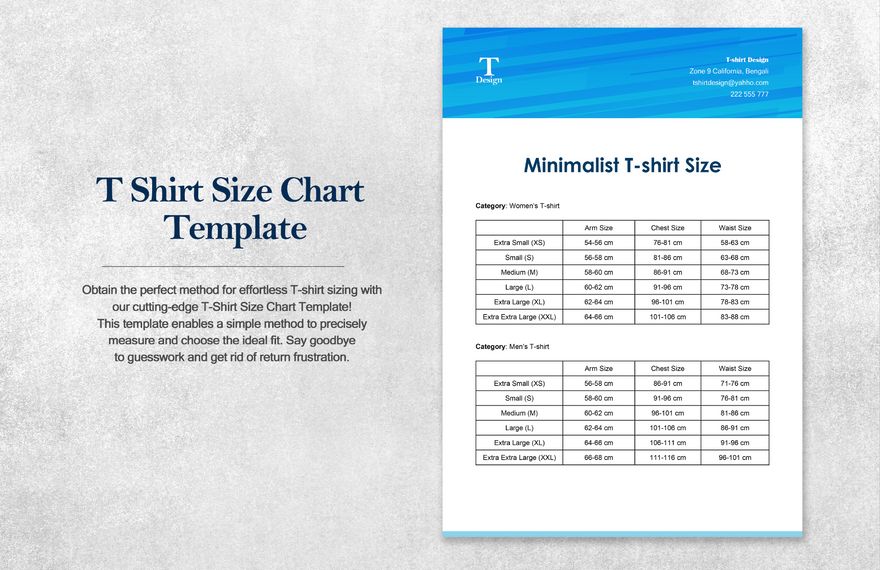
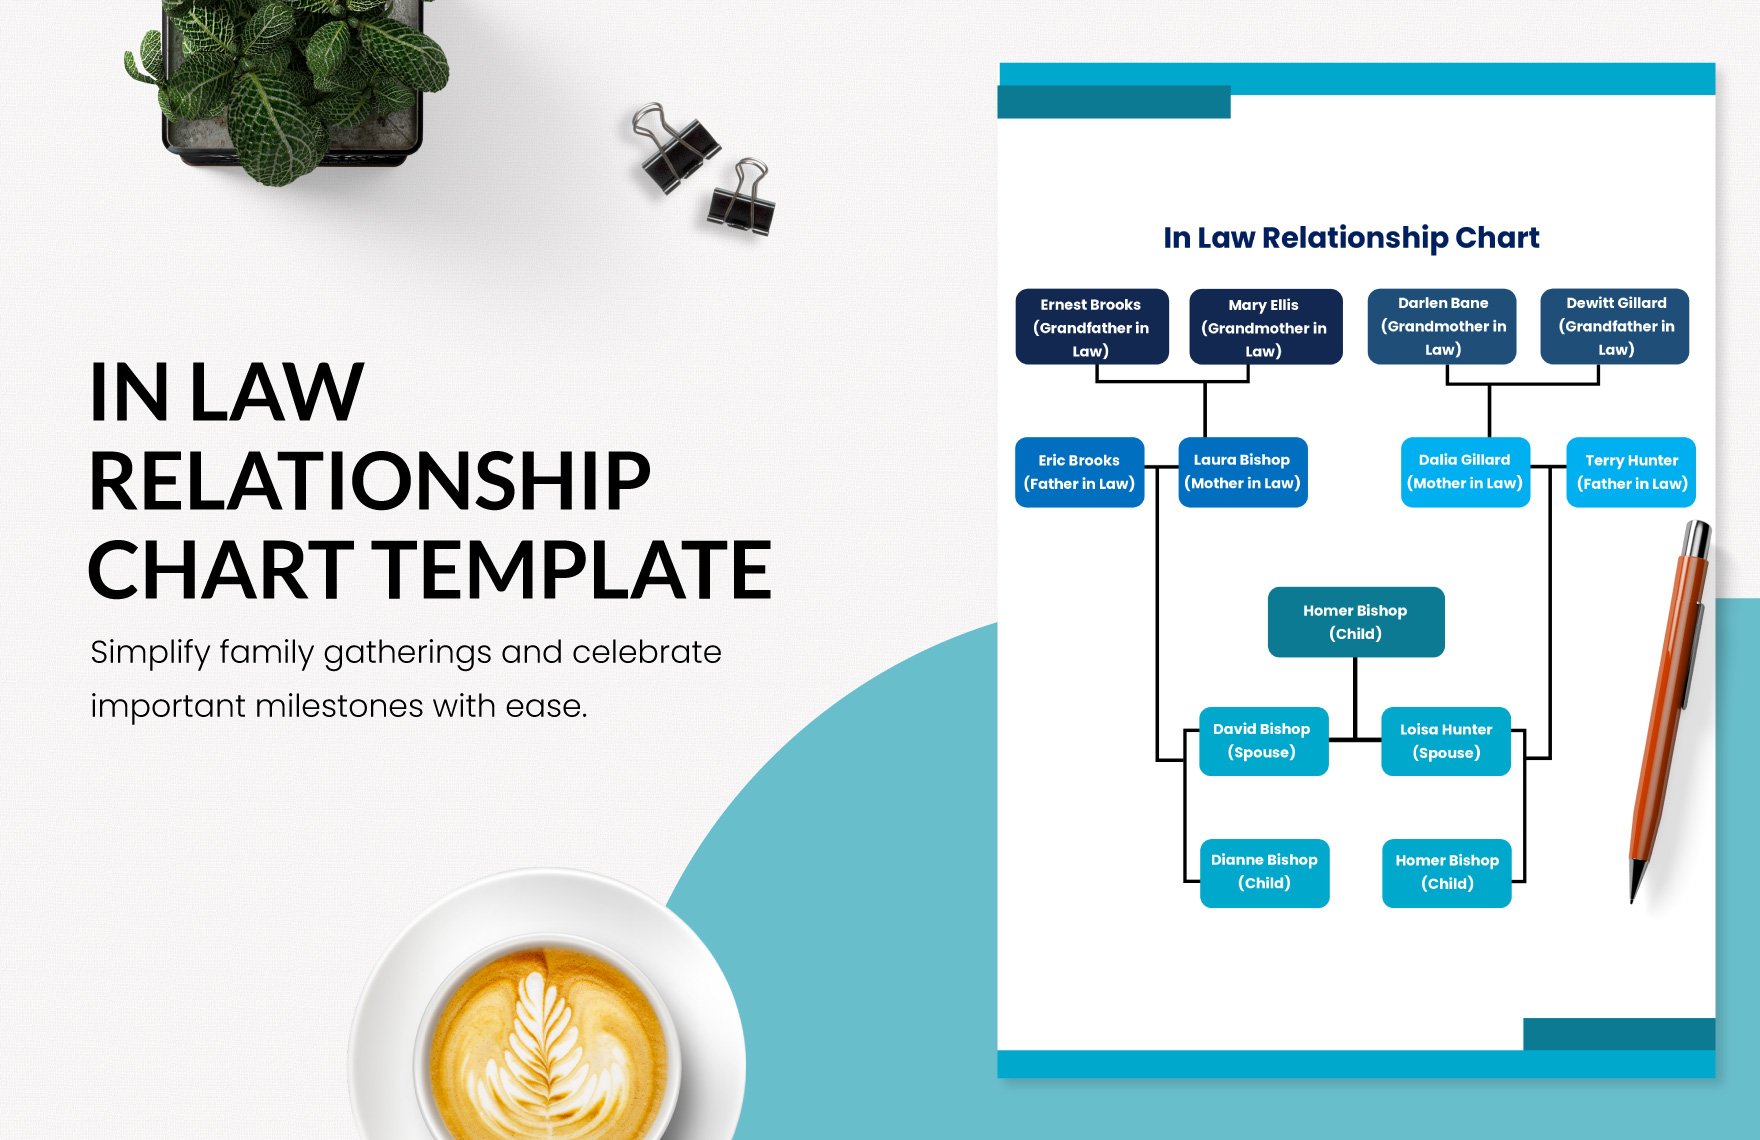
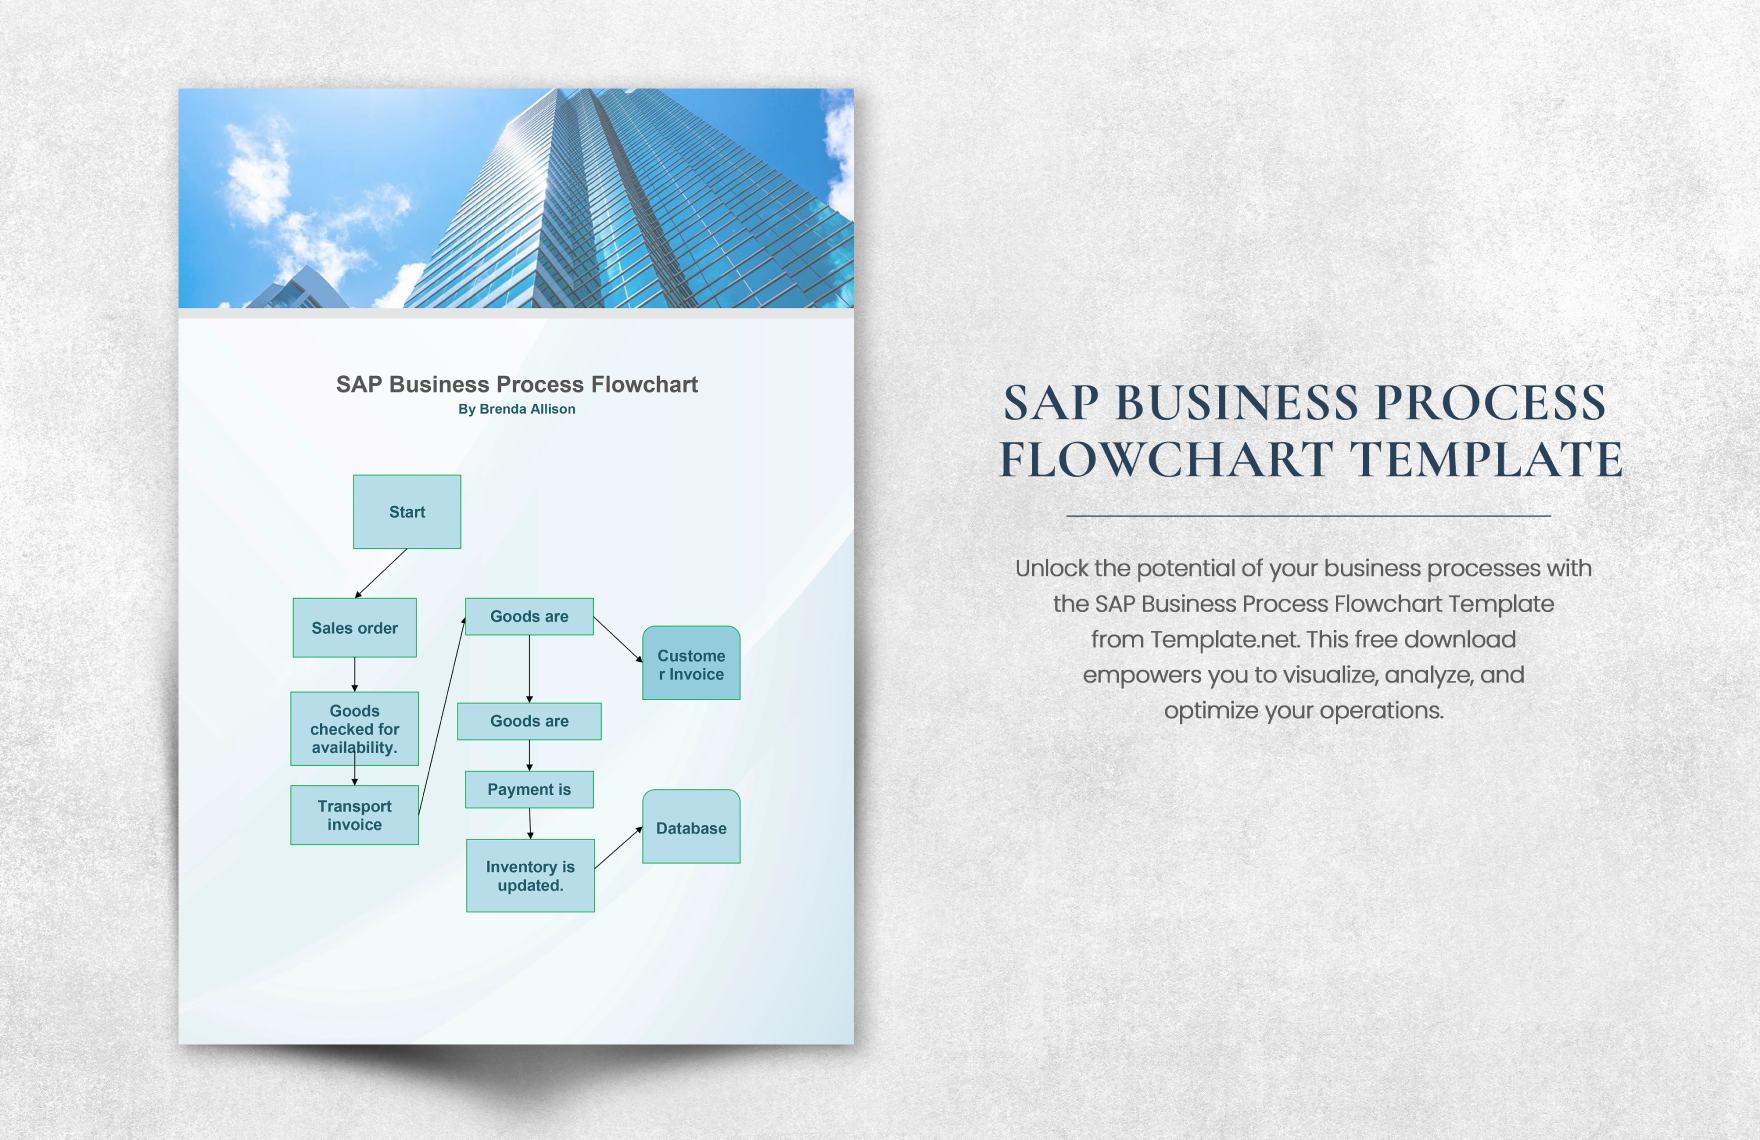
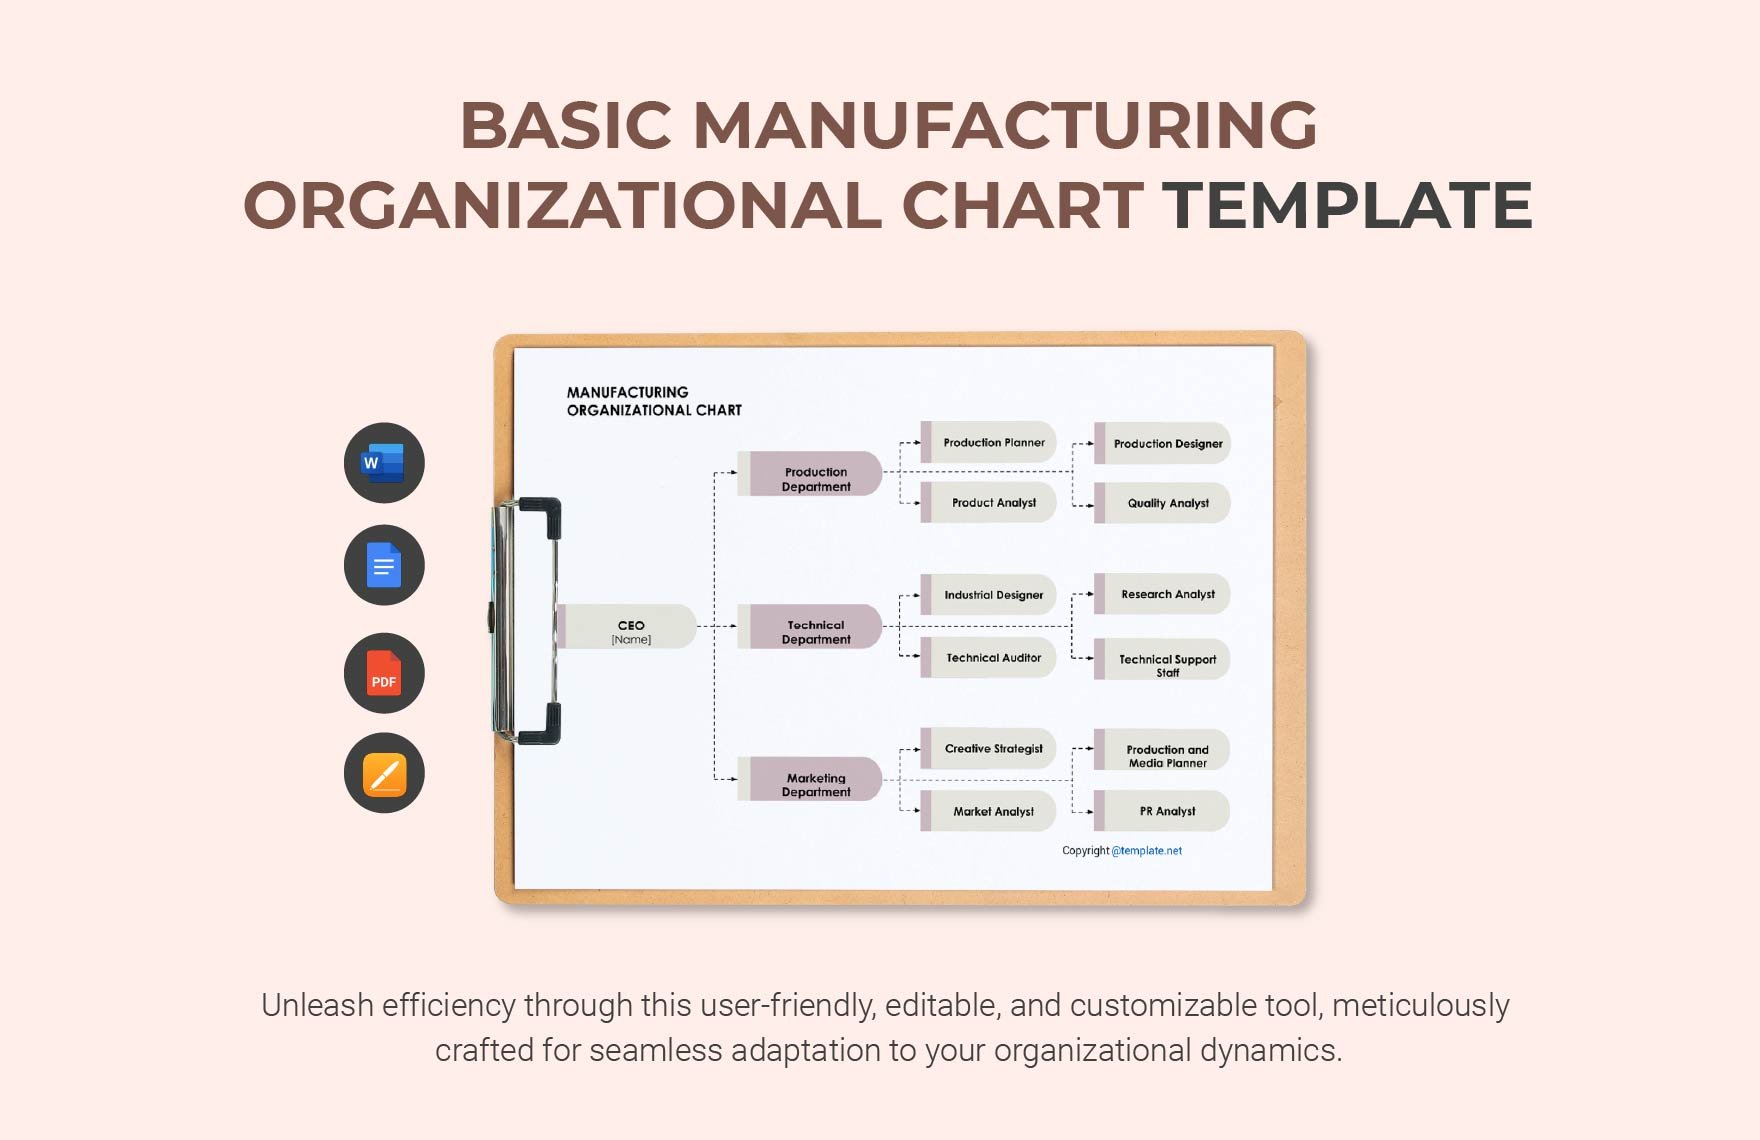
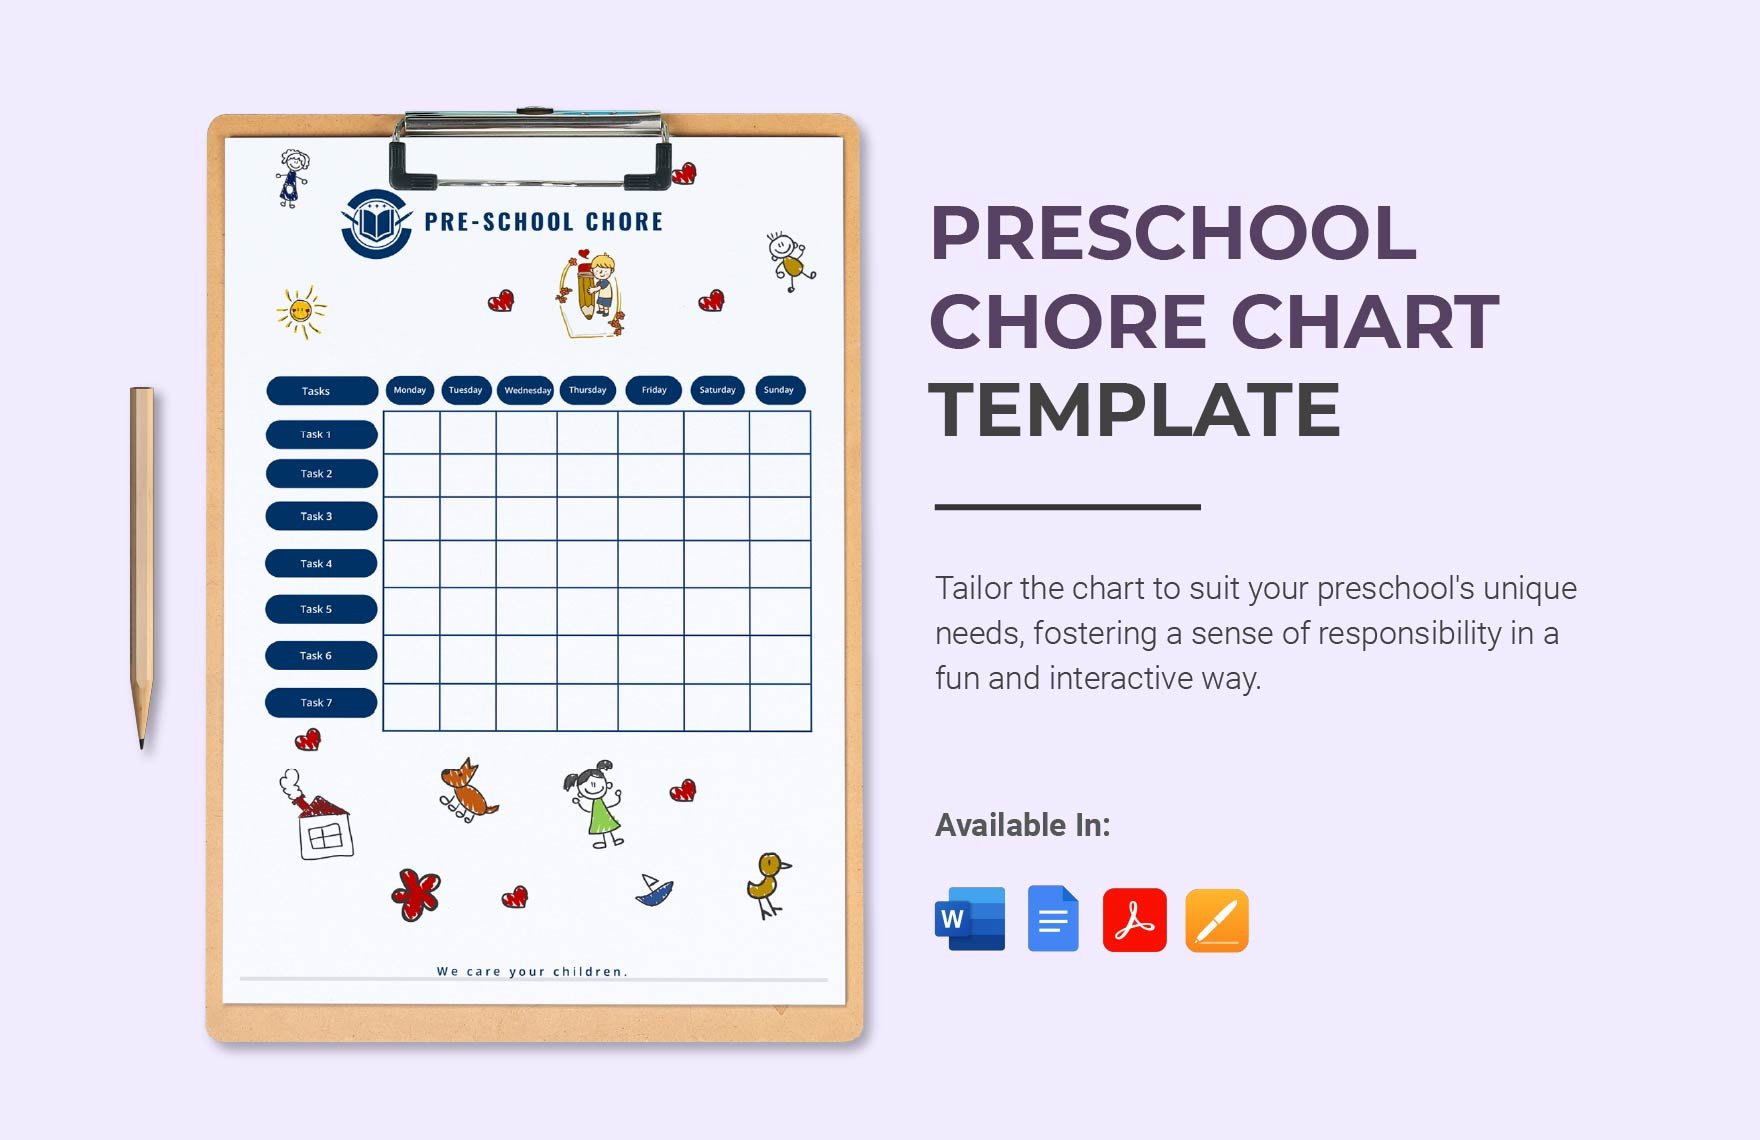
A chart presents the flow of data and is represented through symbols namely, lines in a line chart, bars in a bar chart, and slices in a pie chart. This can represent numeric data in tables, qualitative structure or functions in various information. A simple chart comes in multiple meanings. It can be a diagram for numerical and qualitative data and maps for extra information for a certain focus. This can also be but not limited to organizational charts (org), seating, medical, chore, and comparison form of a chart. This is widely used as an alternative to presenting raw data.
How To Create A Chart in Google Docs?
If you are comfortable in using Google Docs for editing editable charts, provided herein are chart and drawing features that you can utilize no matter what is your reason for making it. Charts are usually used to ease the presentation of data and the interrelation between any components. Thus, as you make it, you make sure that you included details concisely and precisely. These can be created by hand usually in a graph paper or through computers using any compatible application.
This is preferred mostly by users since humans are perceived to infer meaning from illustrations faster than mere descriptions. Since charts are used to ease the way of understanding, make sure that you will comprehensively present it.
1. Identify The Type Of Chart To Use
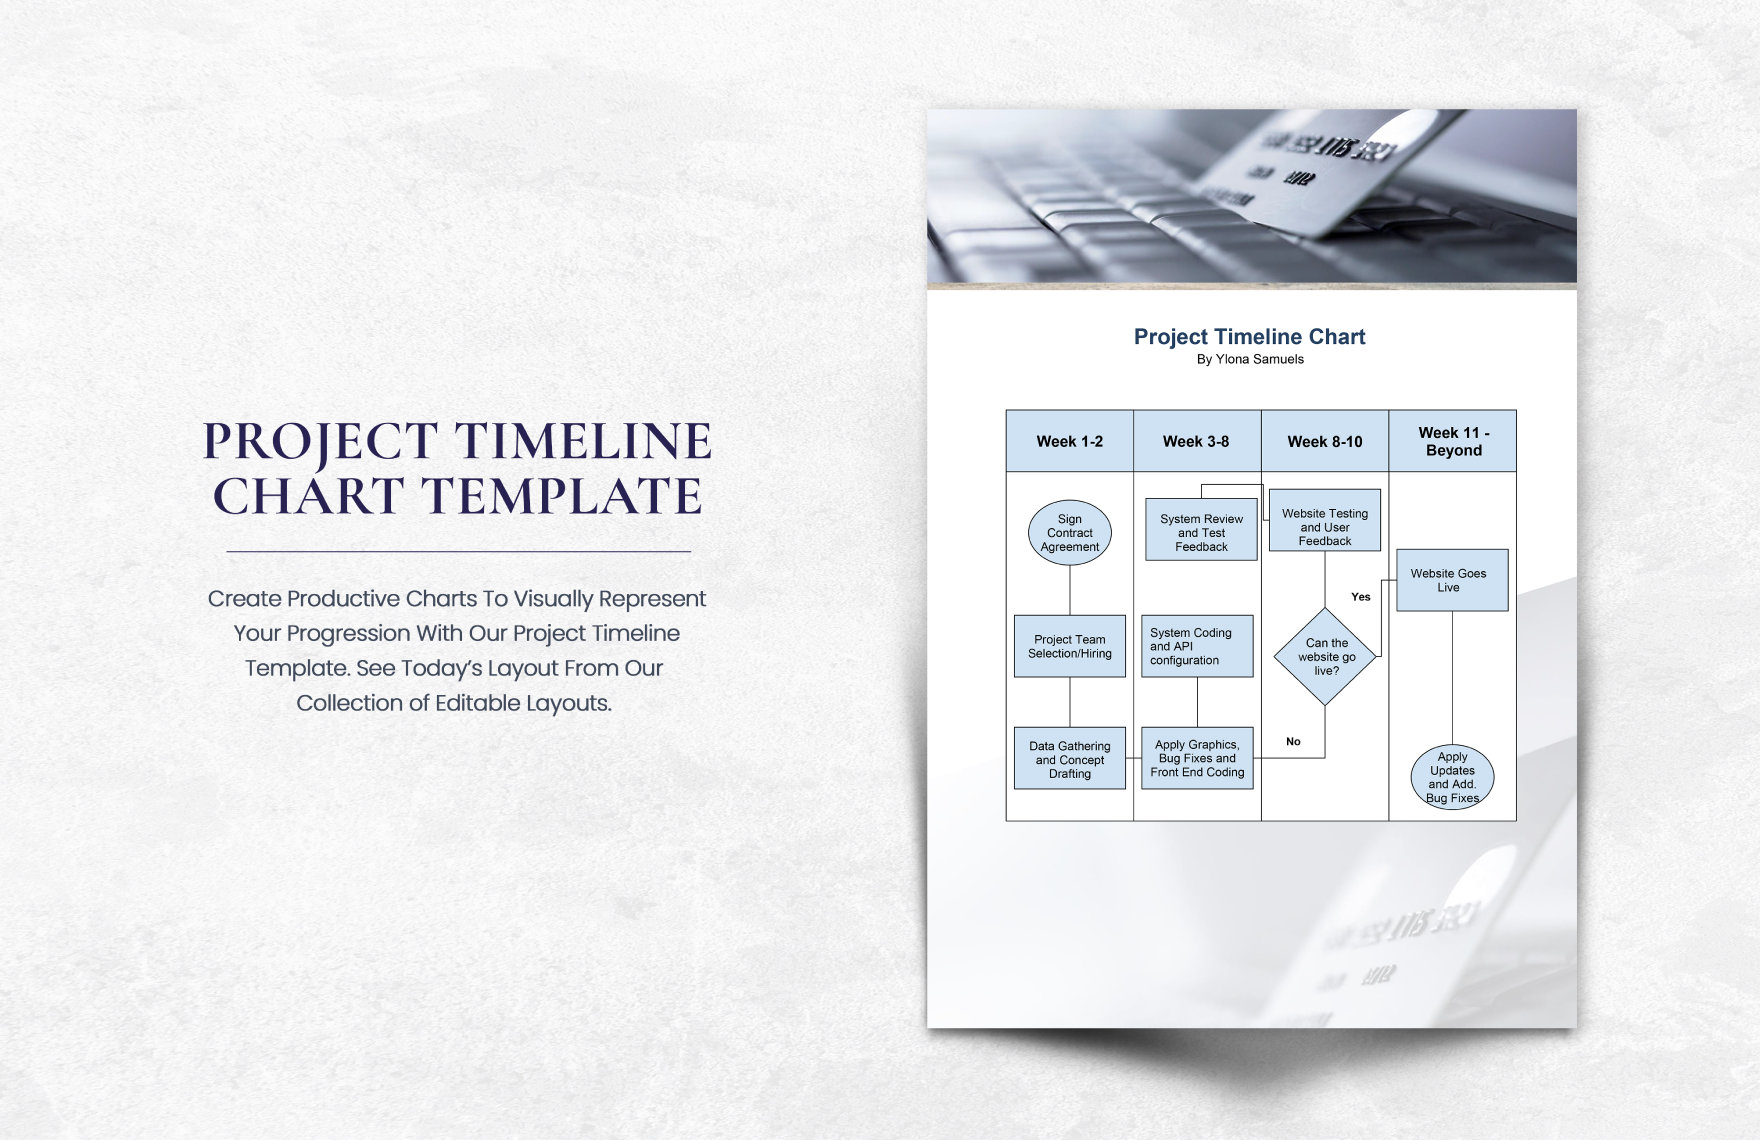
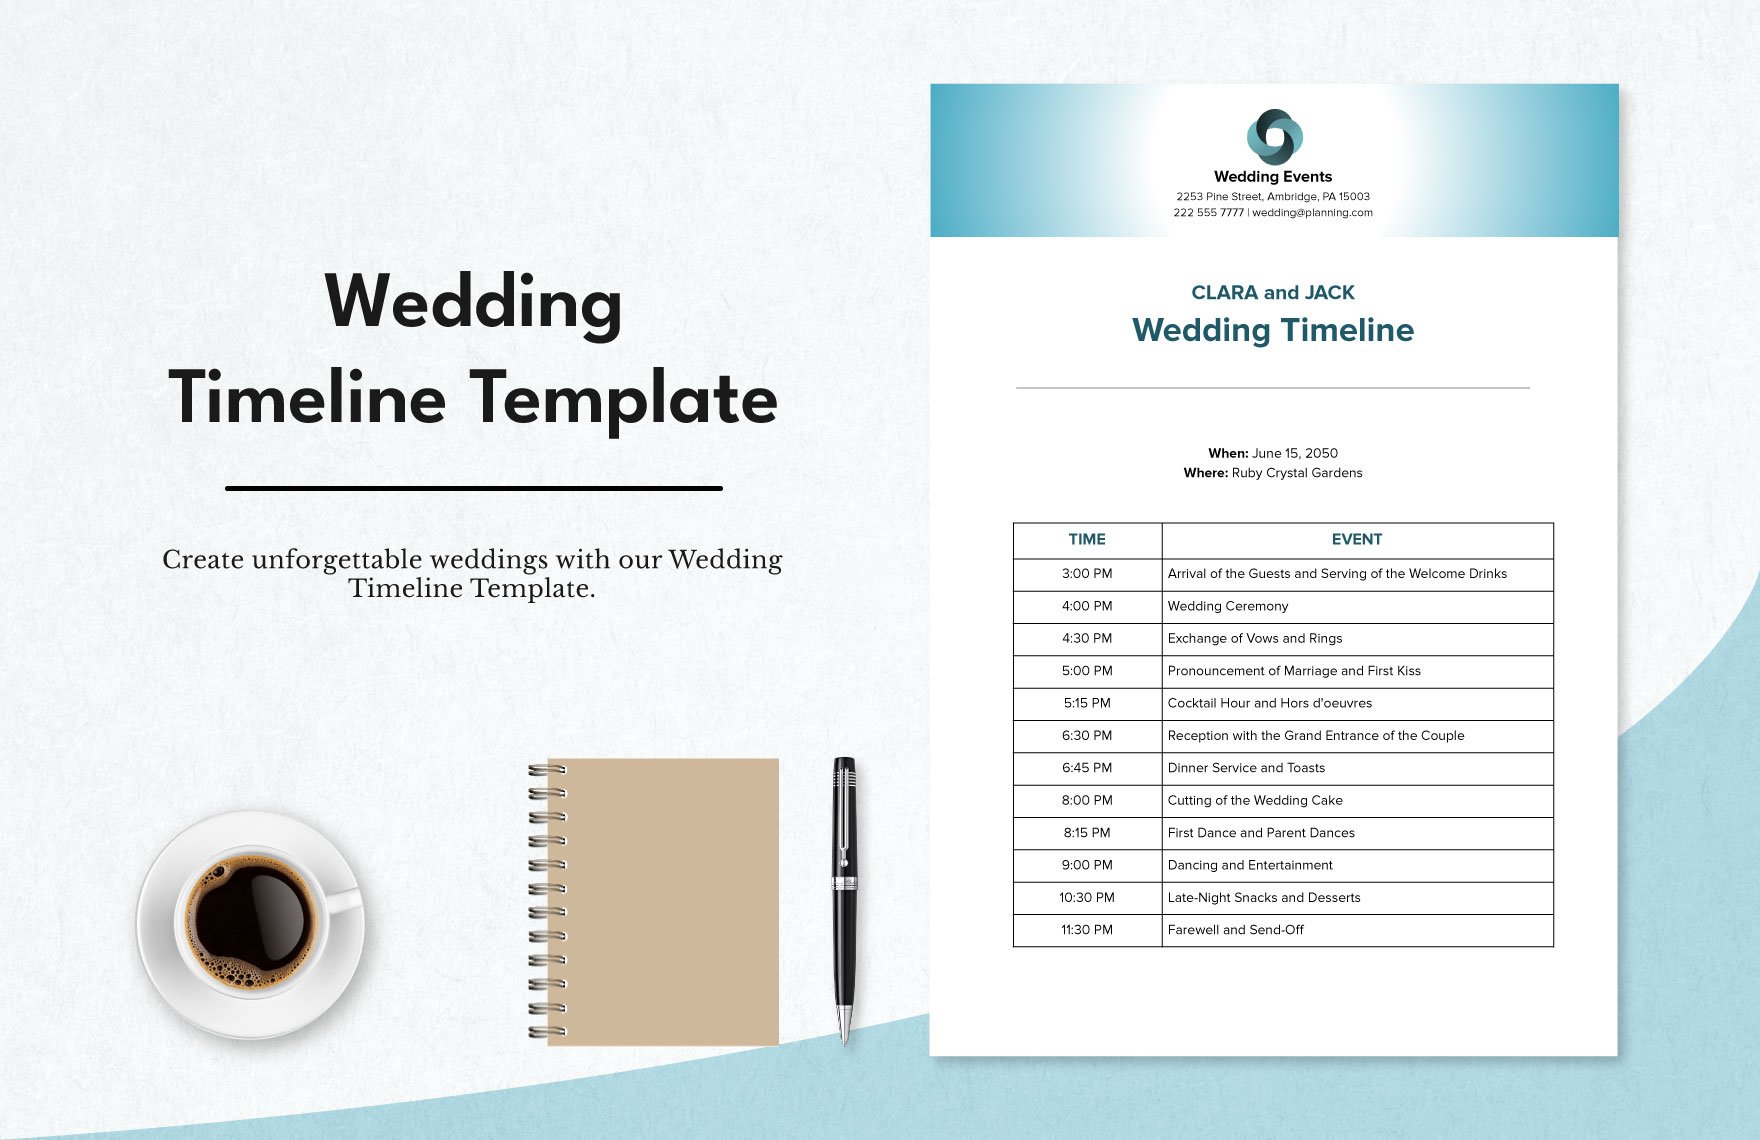
There are various types of charts that you can use in presenting your data. You have the right to choose what chart suits your purpose. There are many common but the ones mostly used include histogram, bar chart, pie chart, and timeline chart. Know your cause of making, then identify what chart type to use.
2. Input Your Needed Detail
Texts aren't dominant in basic charts. These are more on graphics. Right after you identified your chart type, gradually jot down the contents that are necessary and useful in your data presentation.
3. Choose Templates and Customize
If you don't have enough time to create your data chart, immediately look for your required chart from our free chart templates in Google Docs presented above and download it so that you can customize it according to your needs. We have here simple charts with basic graphics and content in it.
4. Recheck All Your Inputs
If you are done making your own chart or customizing your downloaded file, reevaluate your inputs if you have presented what you all need. Check if your pieces of information are all factual. This is to guarantee that the chore charts you made as tasked by your company are credible and helpful in determining the progress and shortcomings of your business cards
5. Print Out Your Chart
If you are confident enough with the chart that you made, you are now ready to print it out. Make sure that you used the right printer that fits on your paper choice. High-quality print outs are pleasing in the eye and more understandable especially if your chart includes colors.


