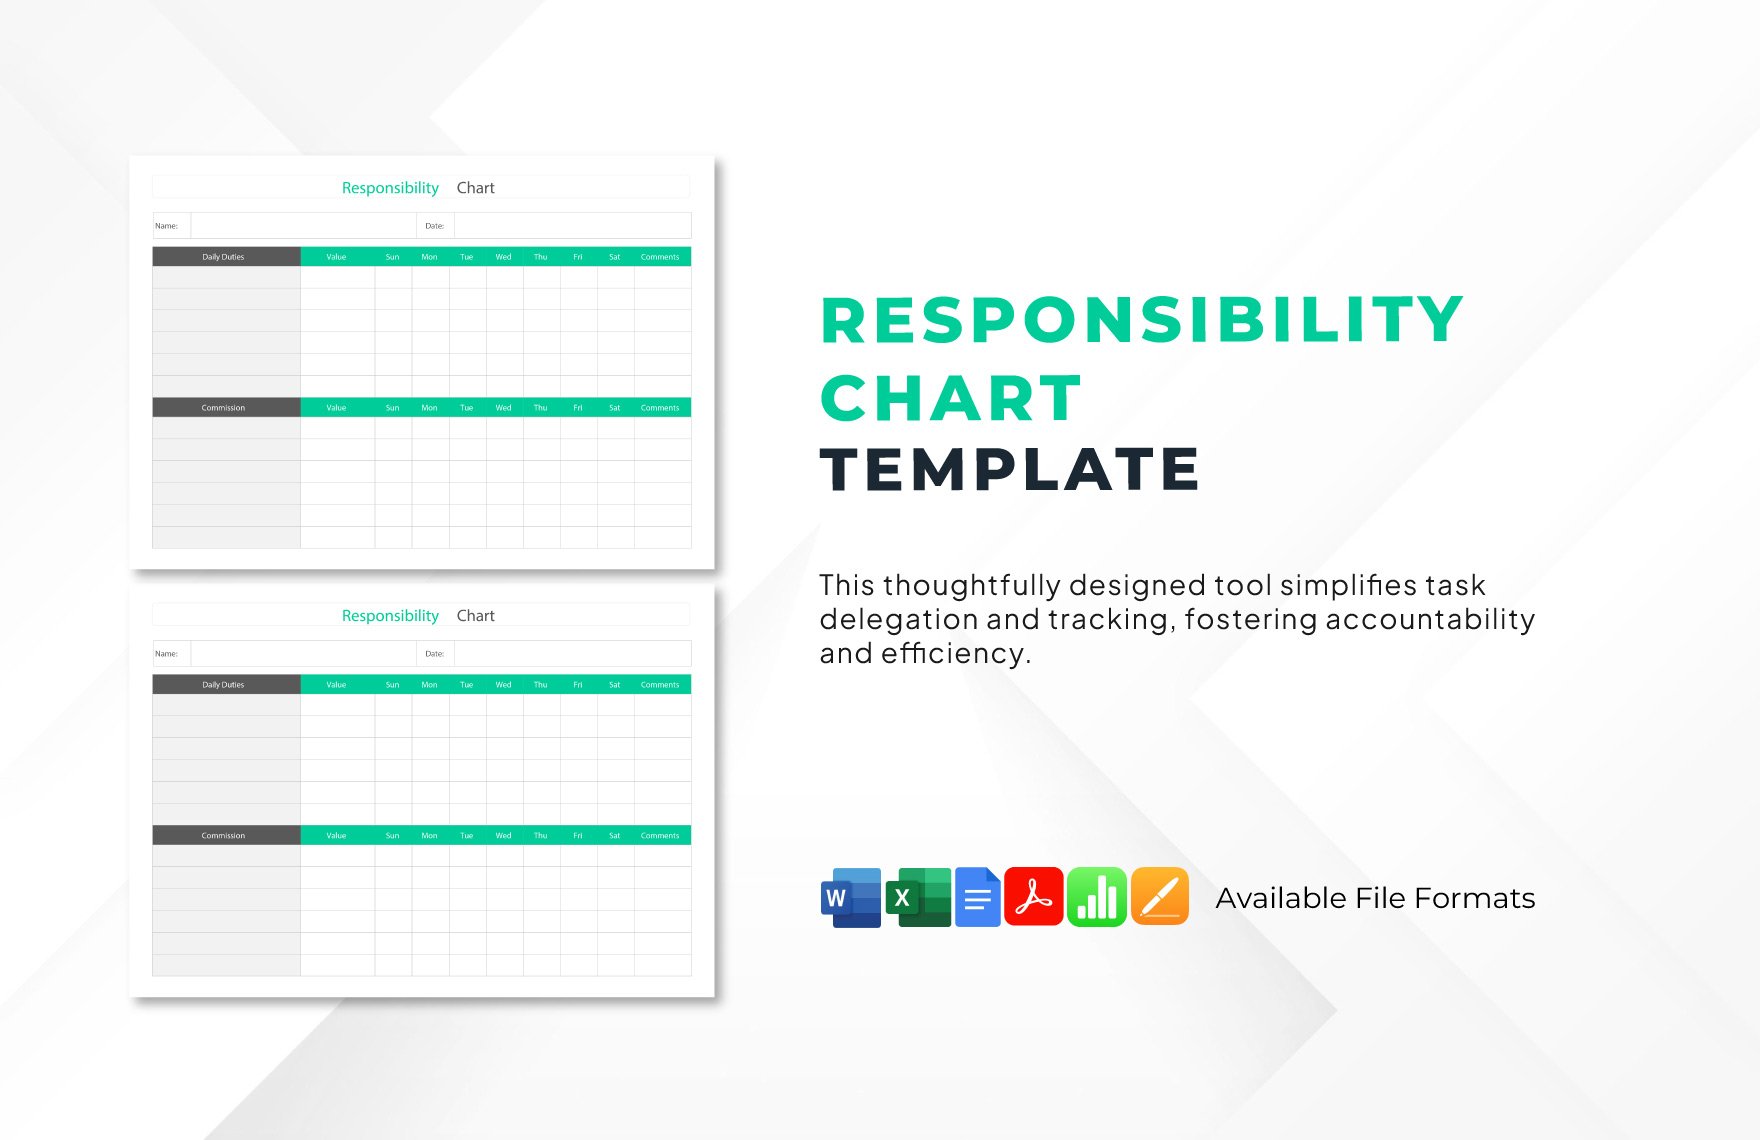
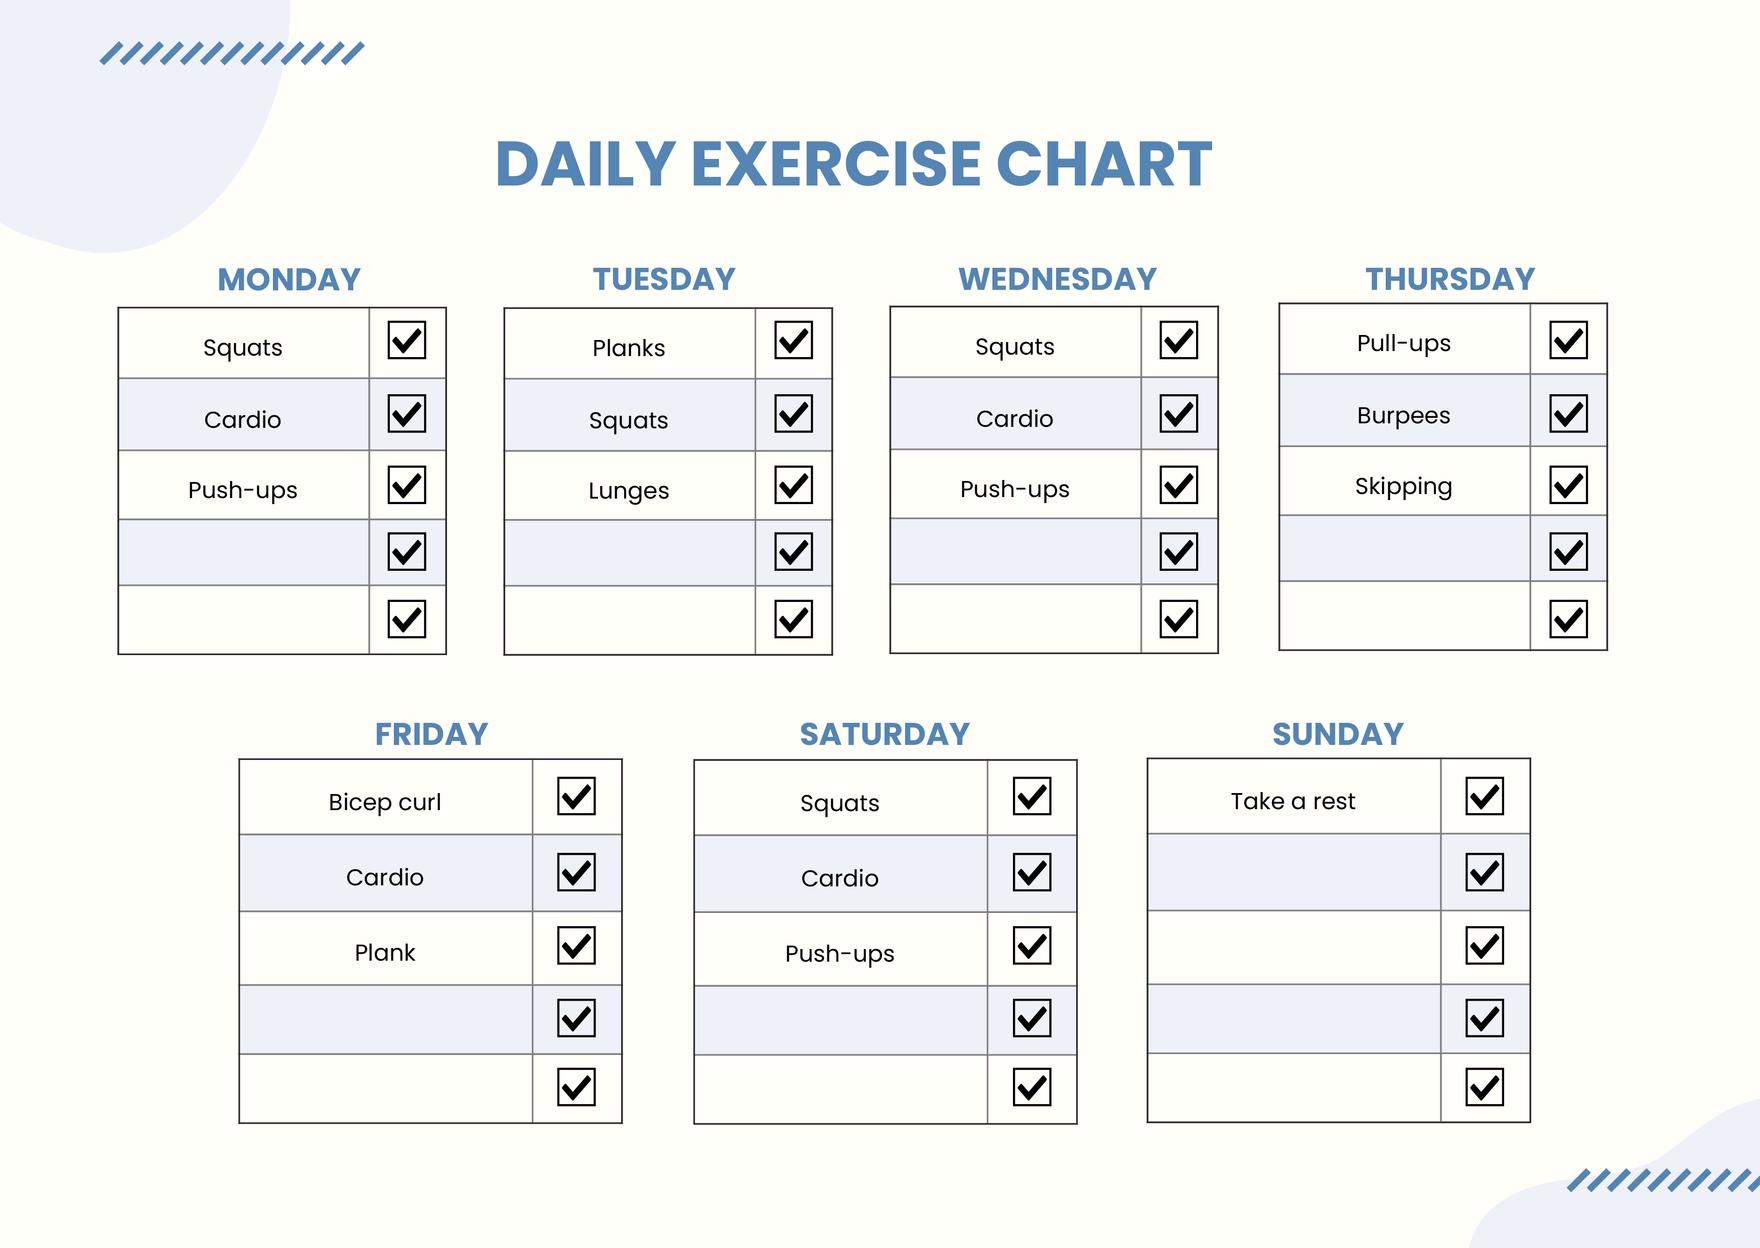
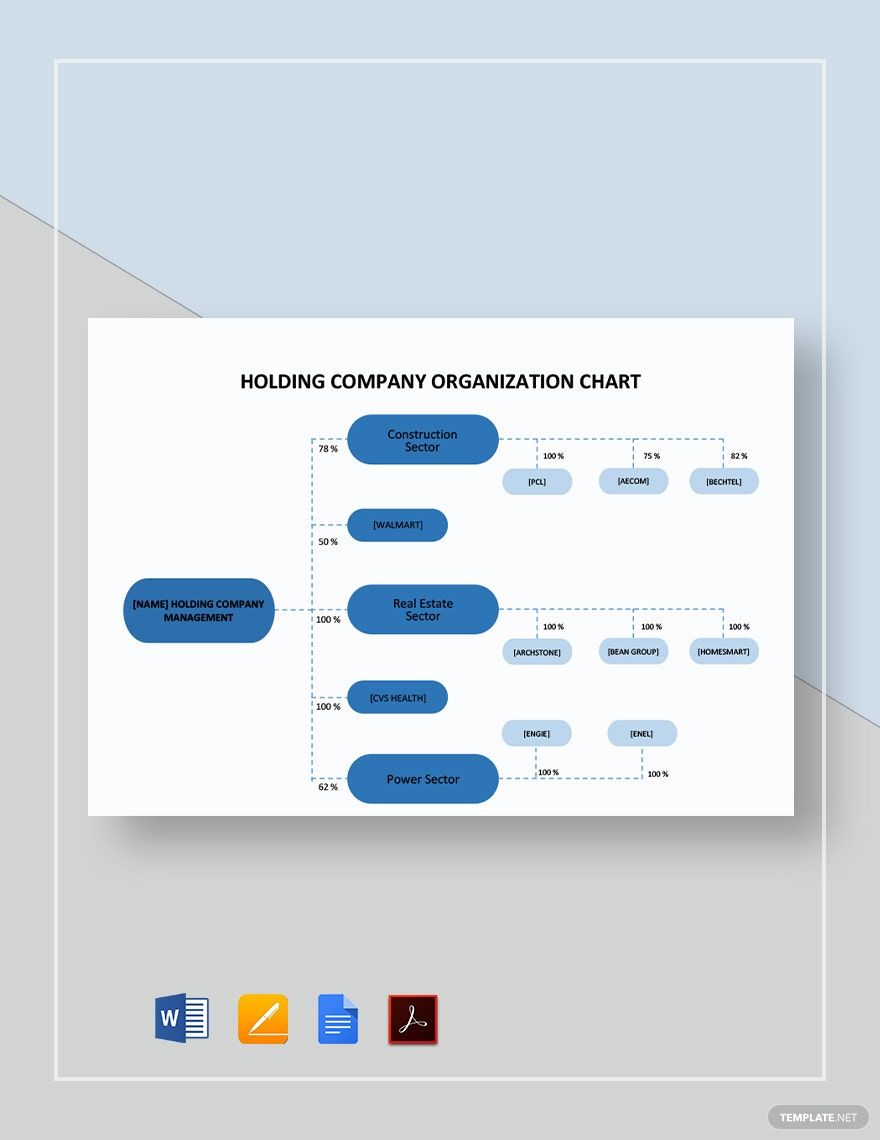
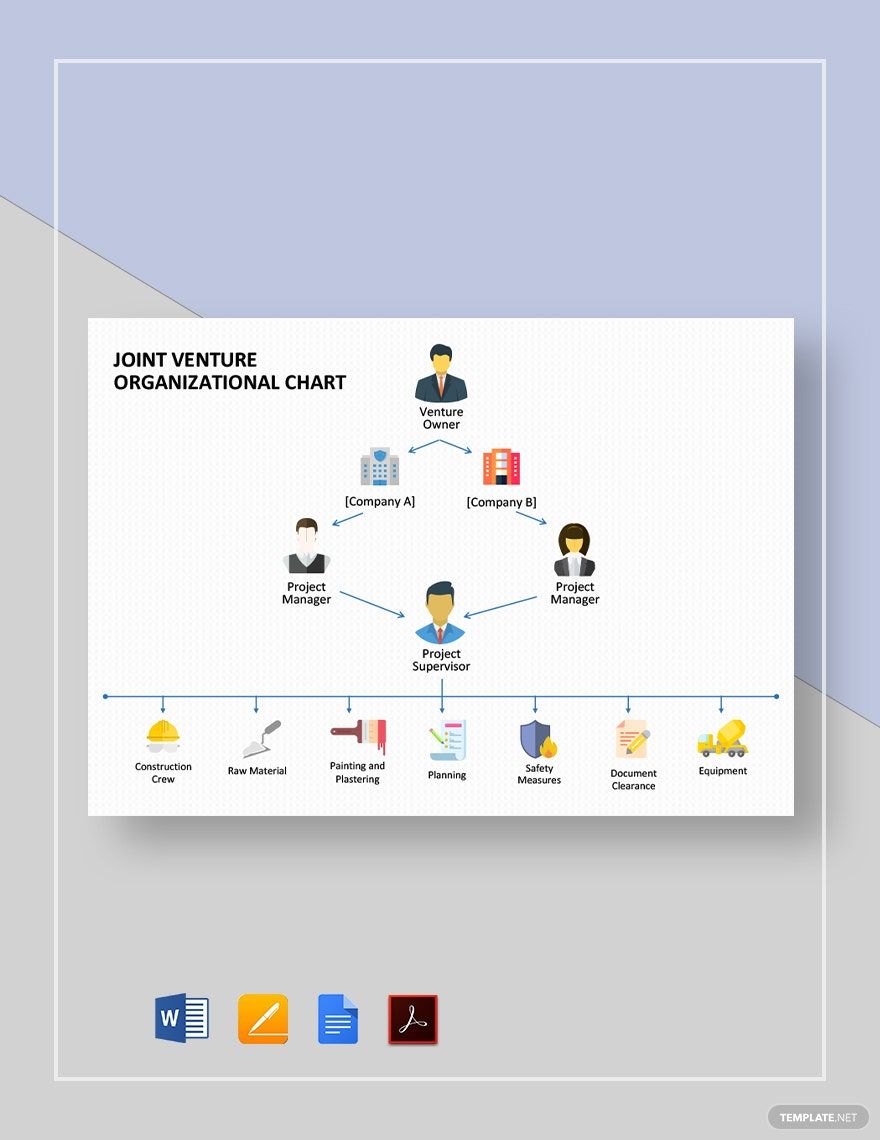
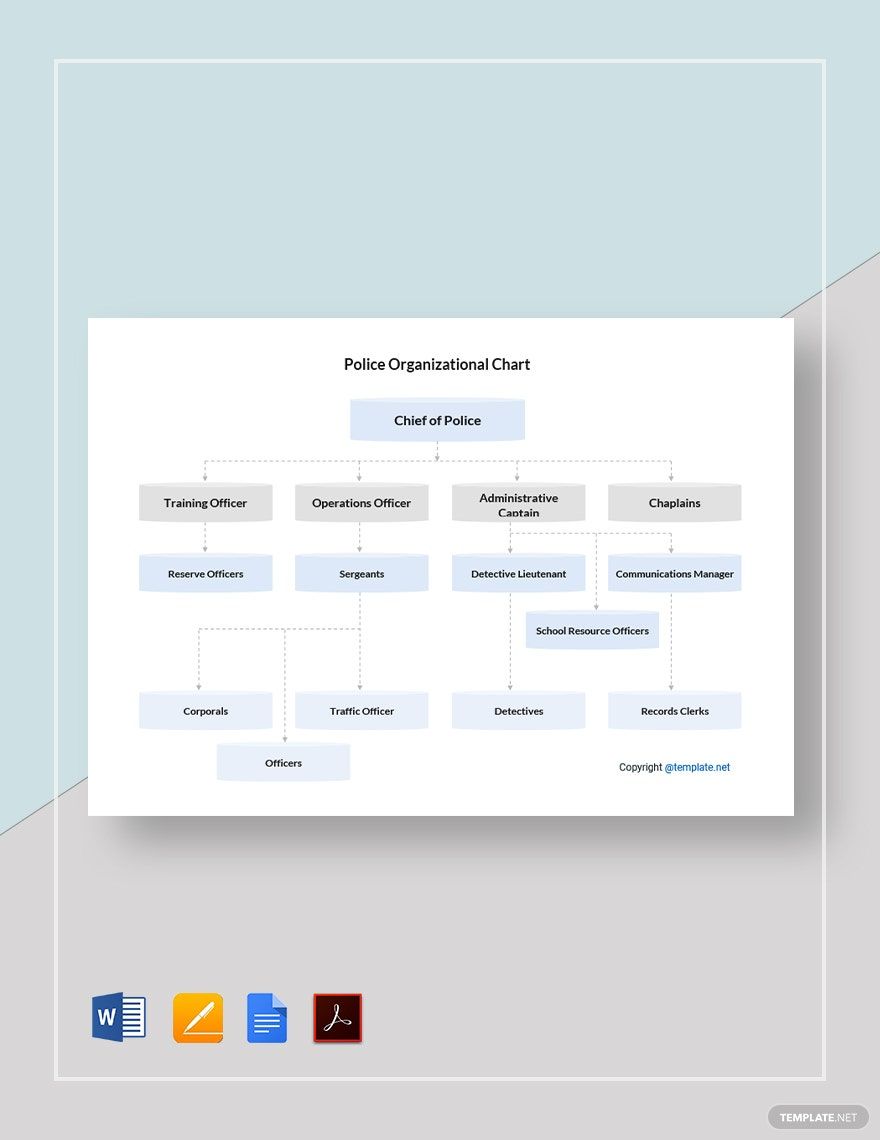
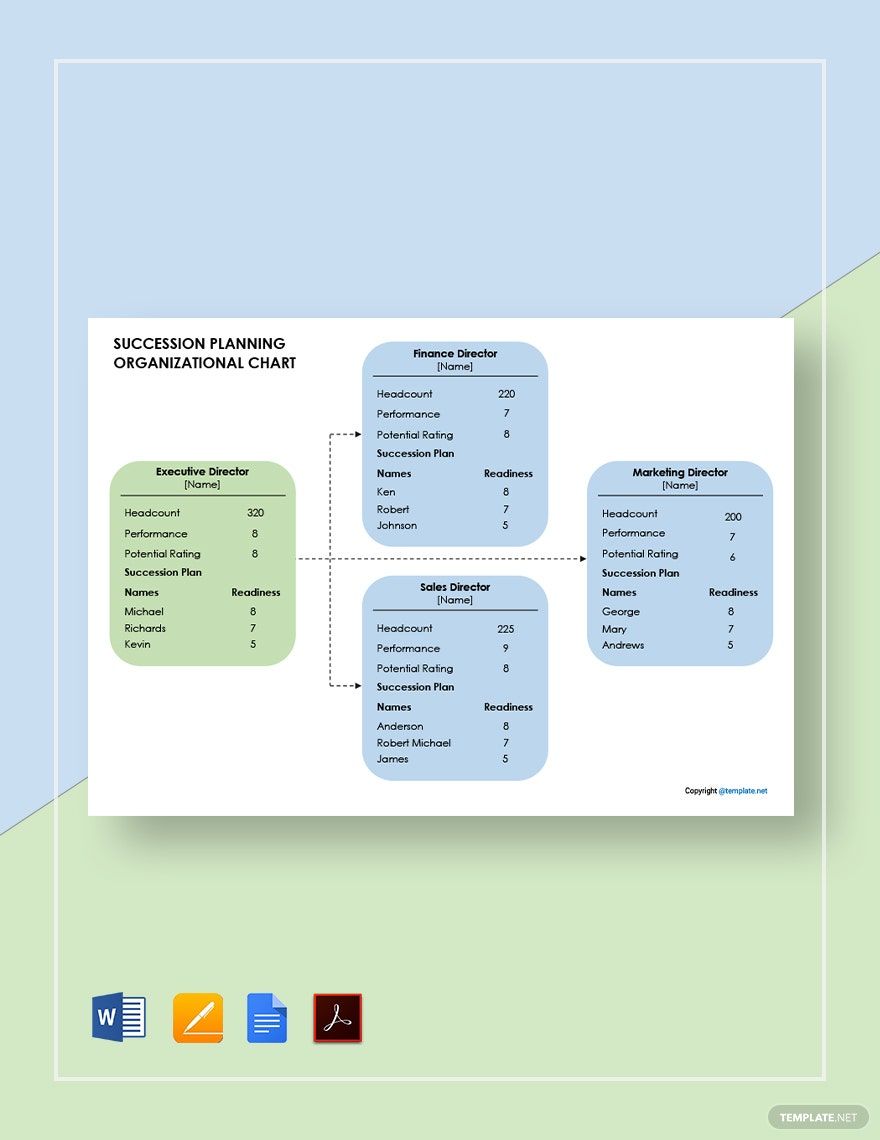
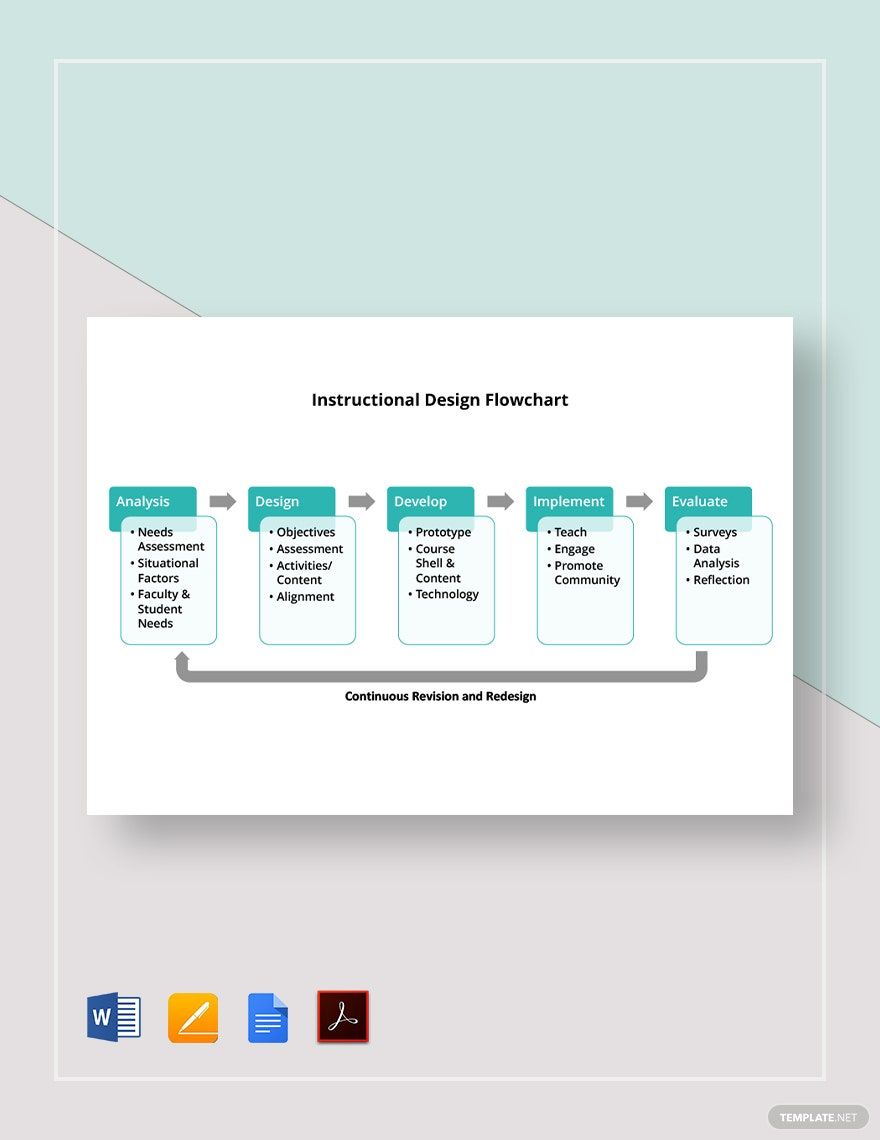
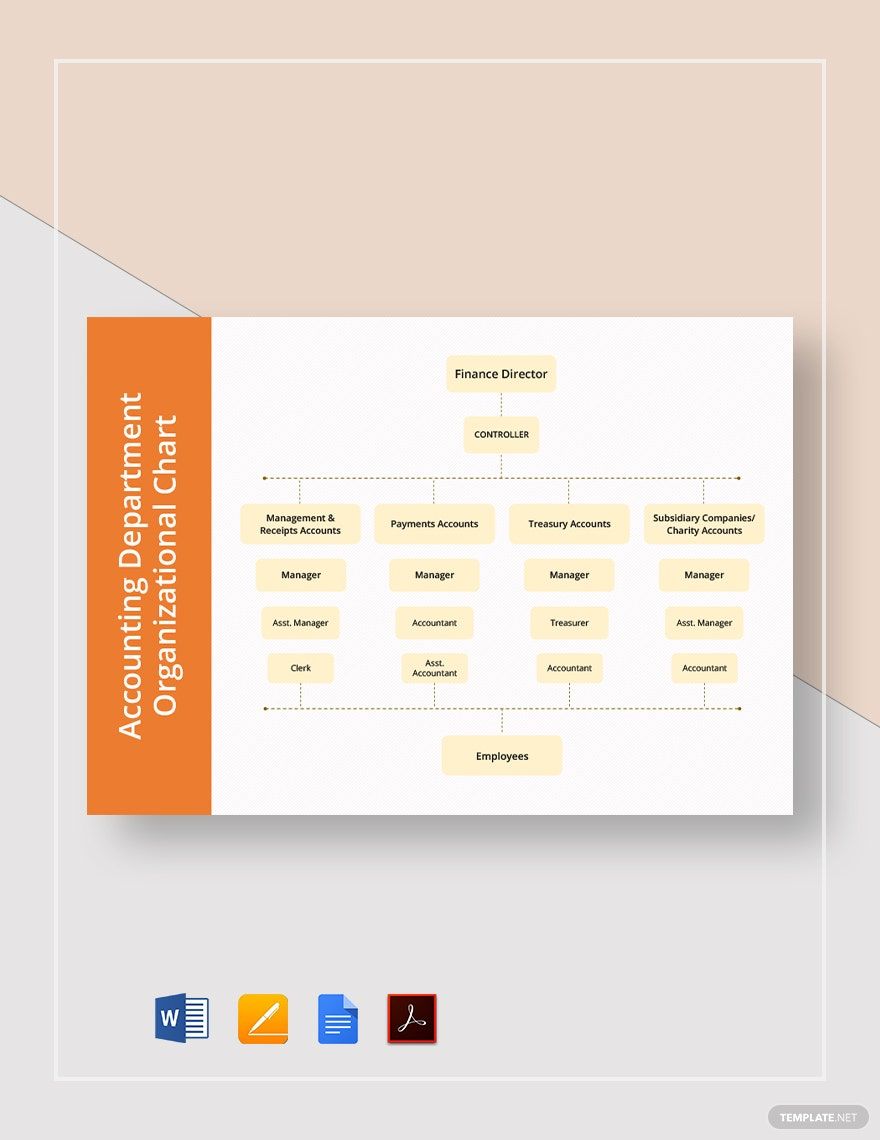
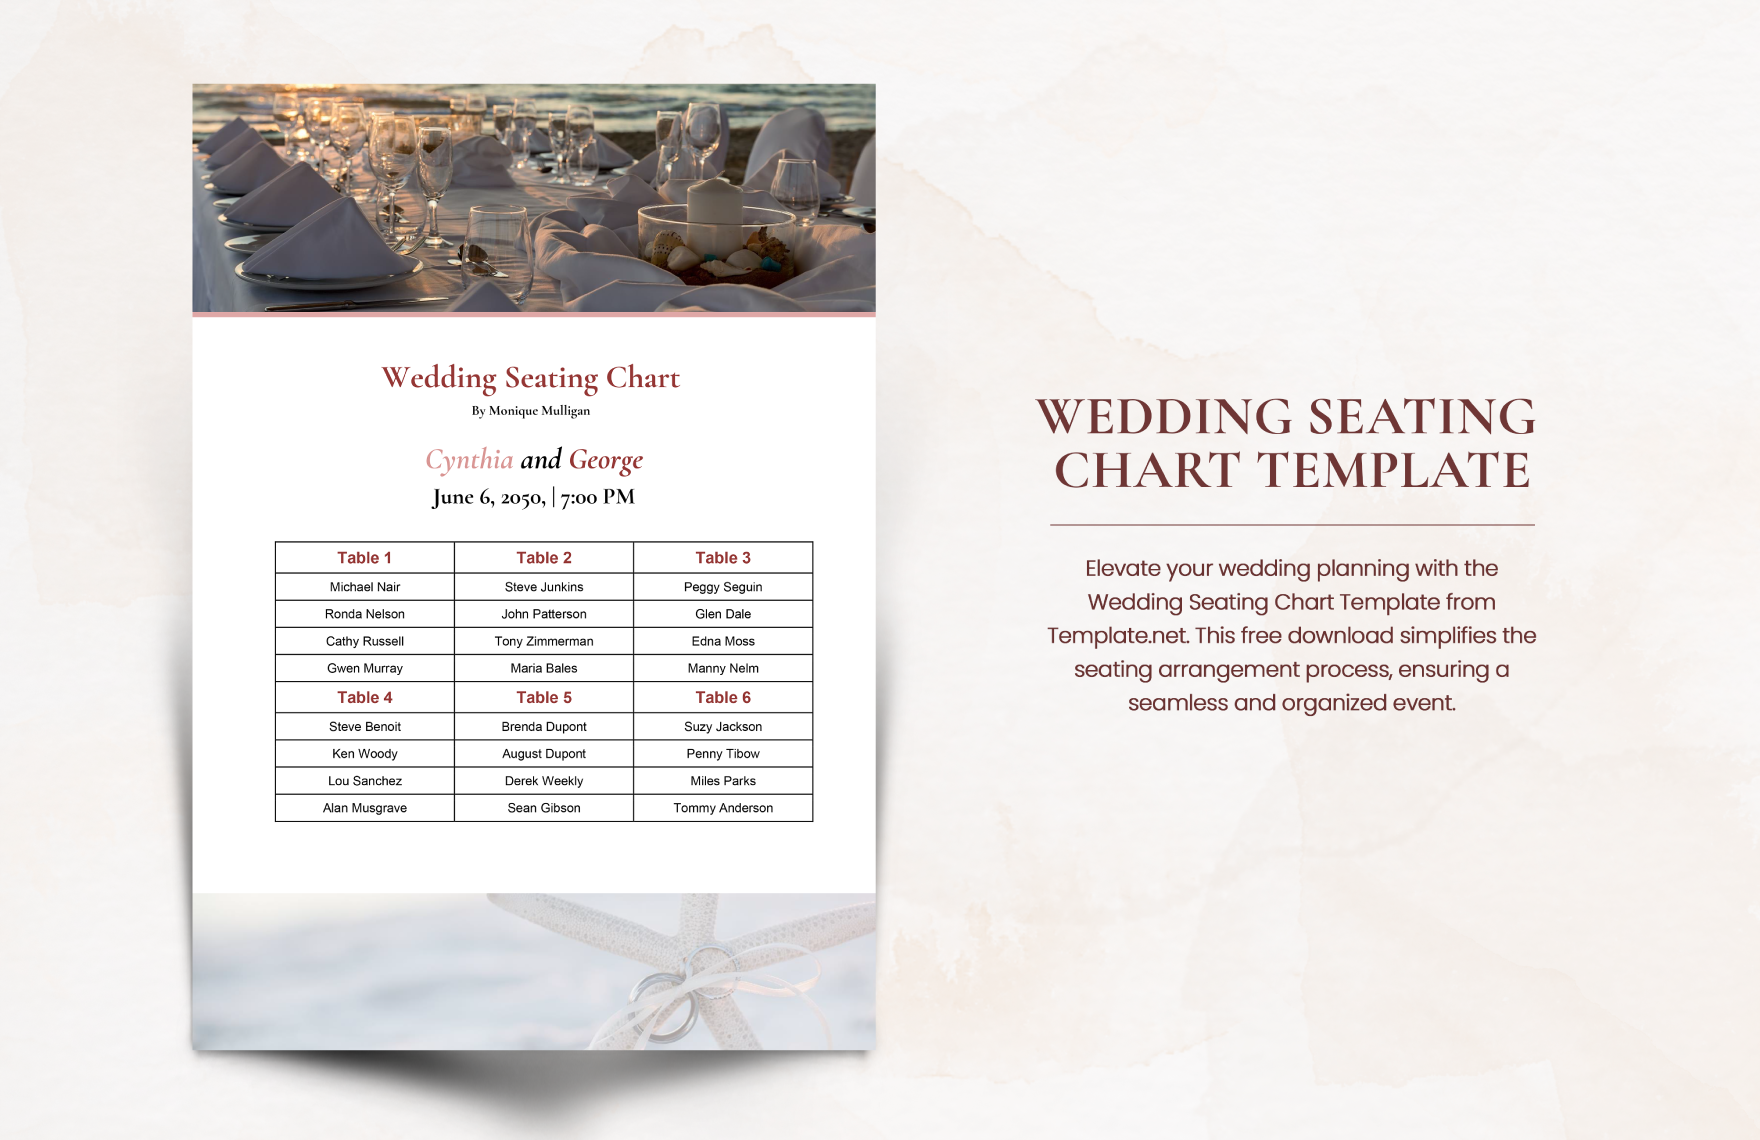
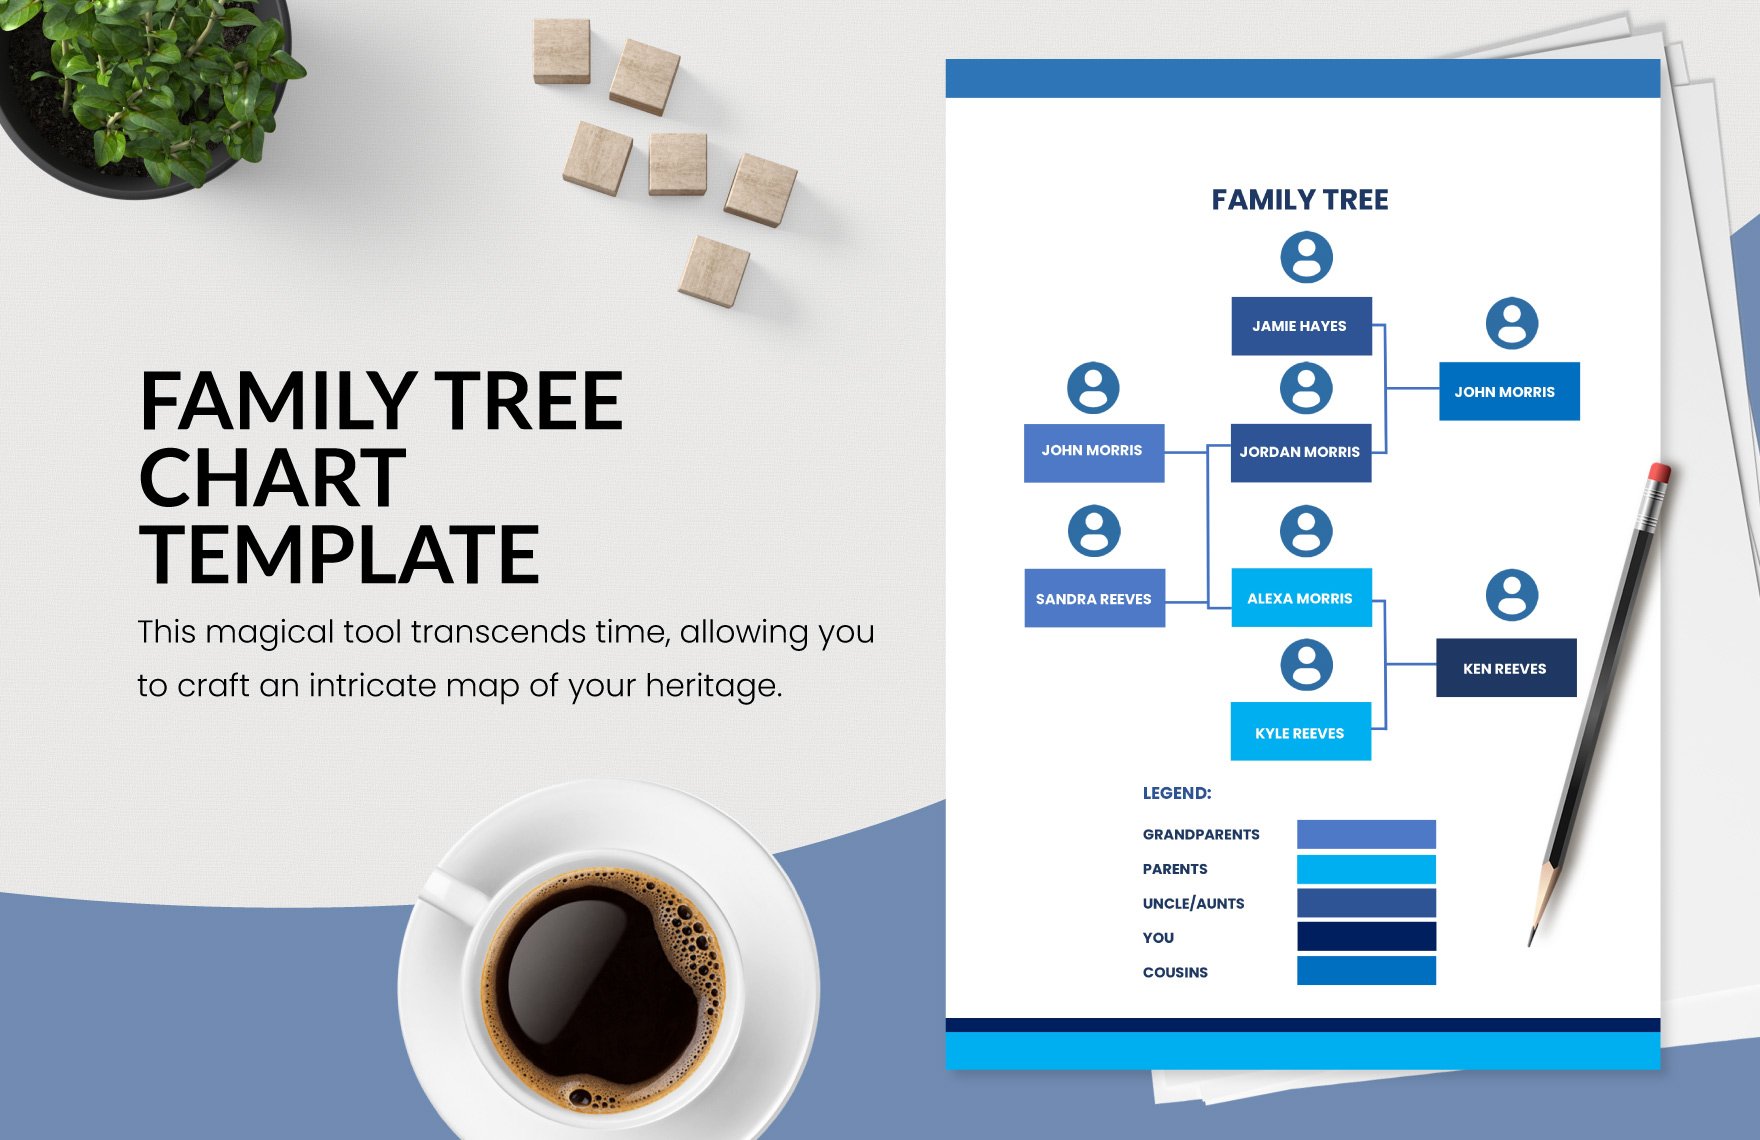
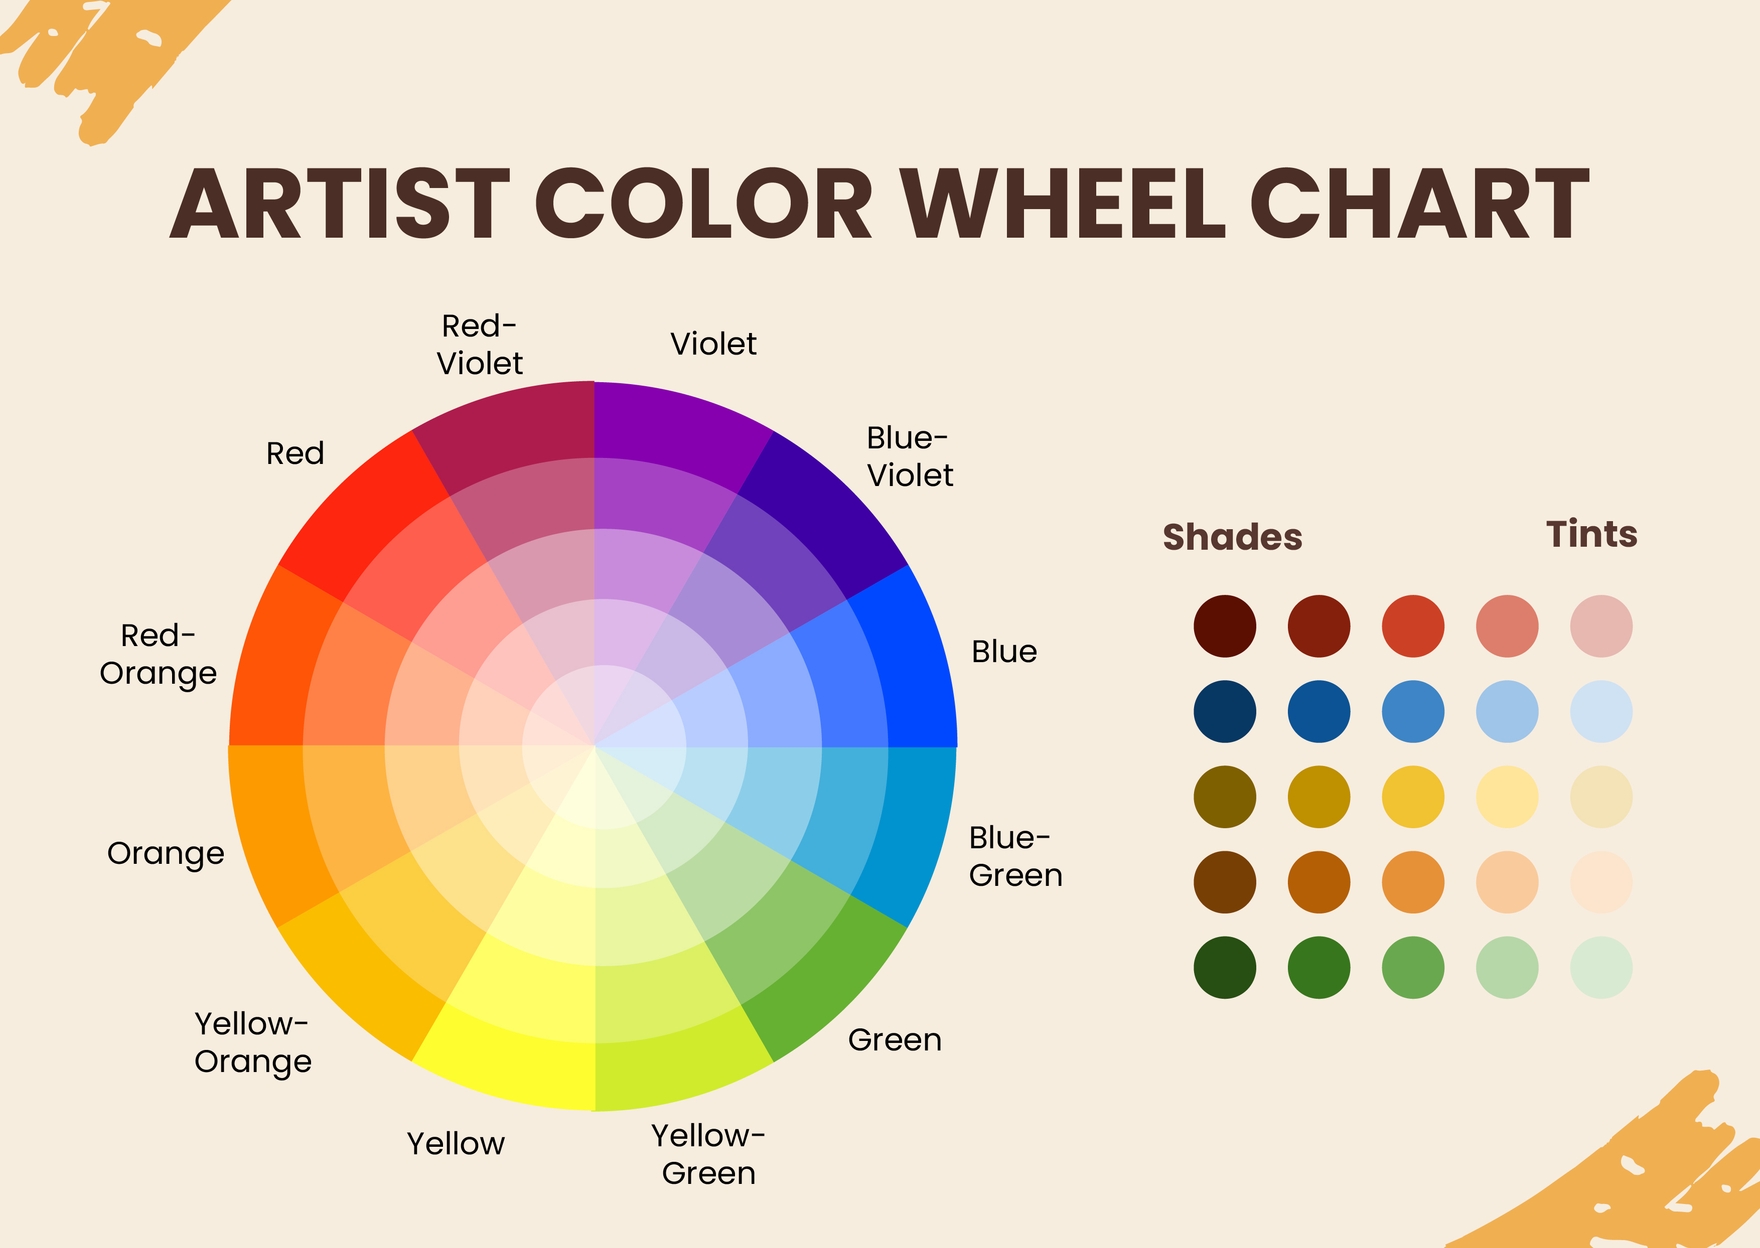
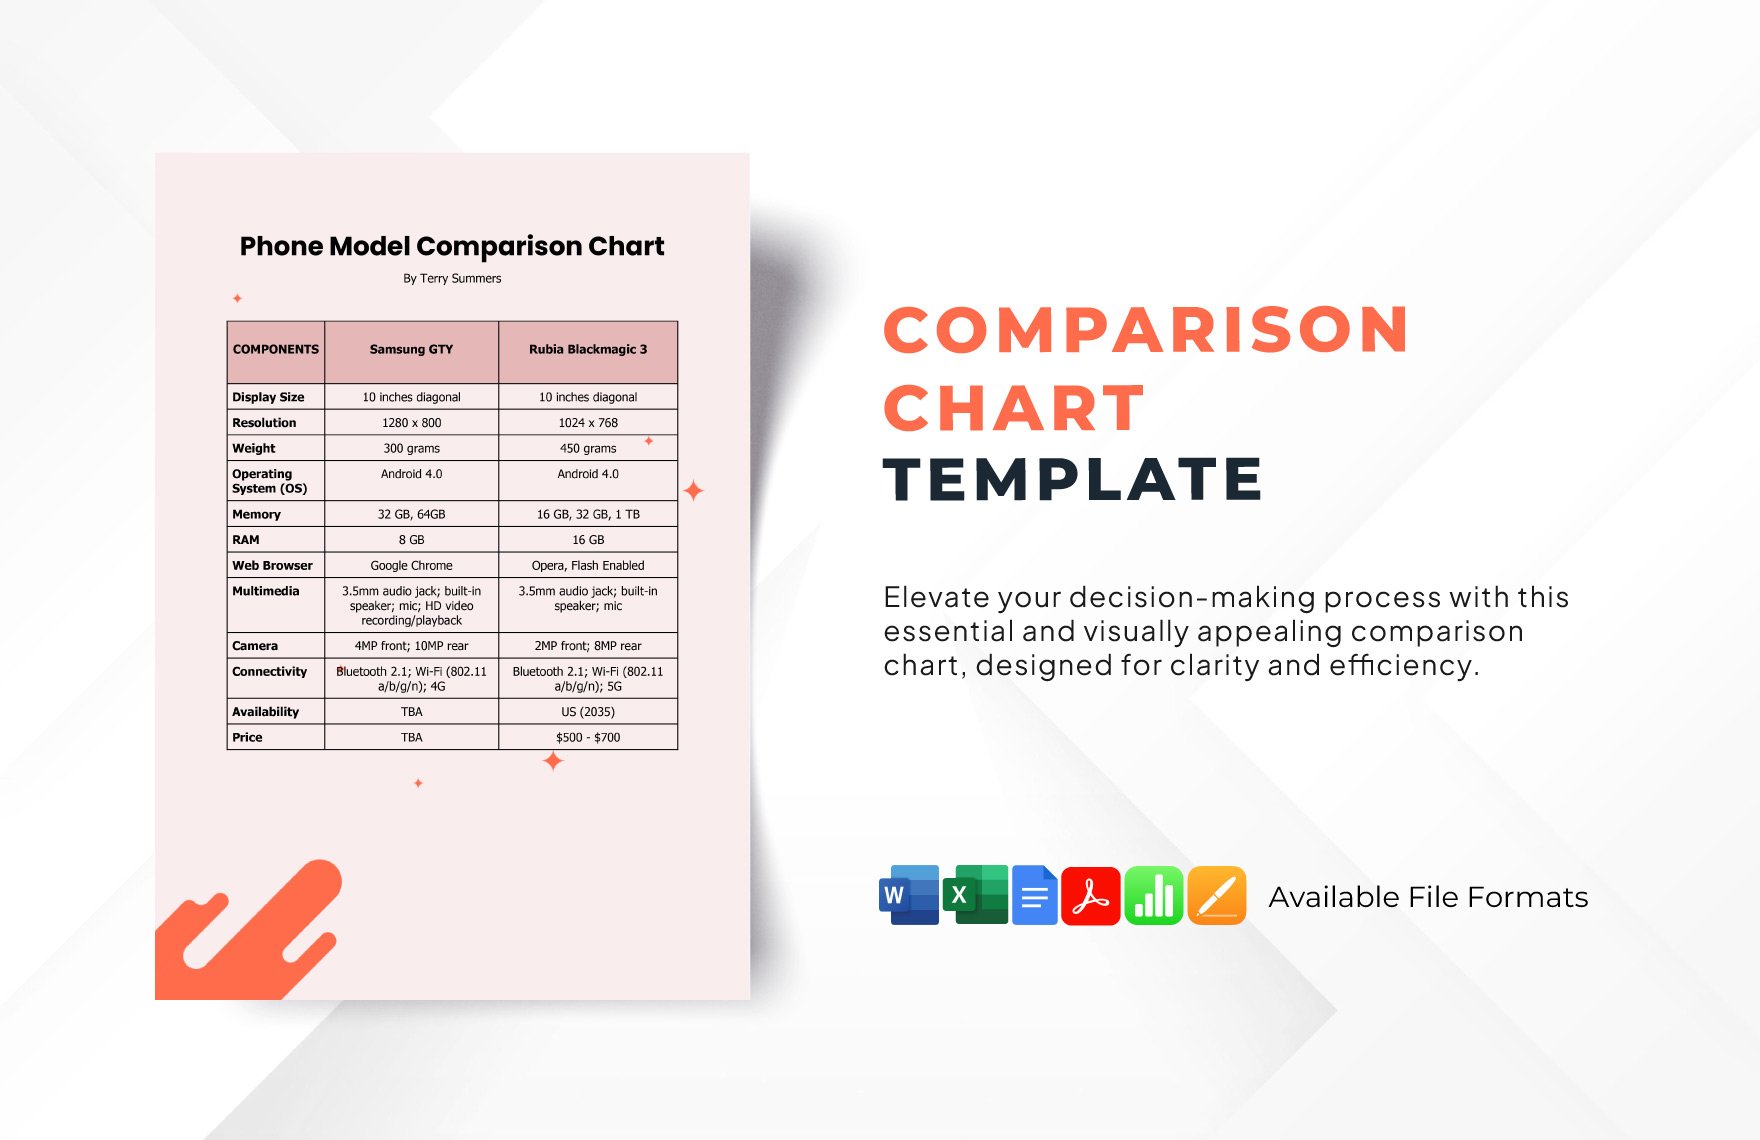
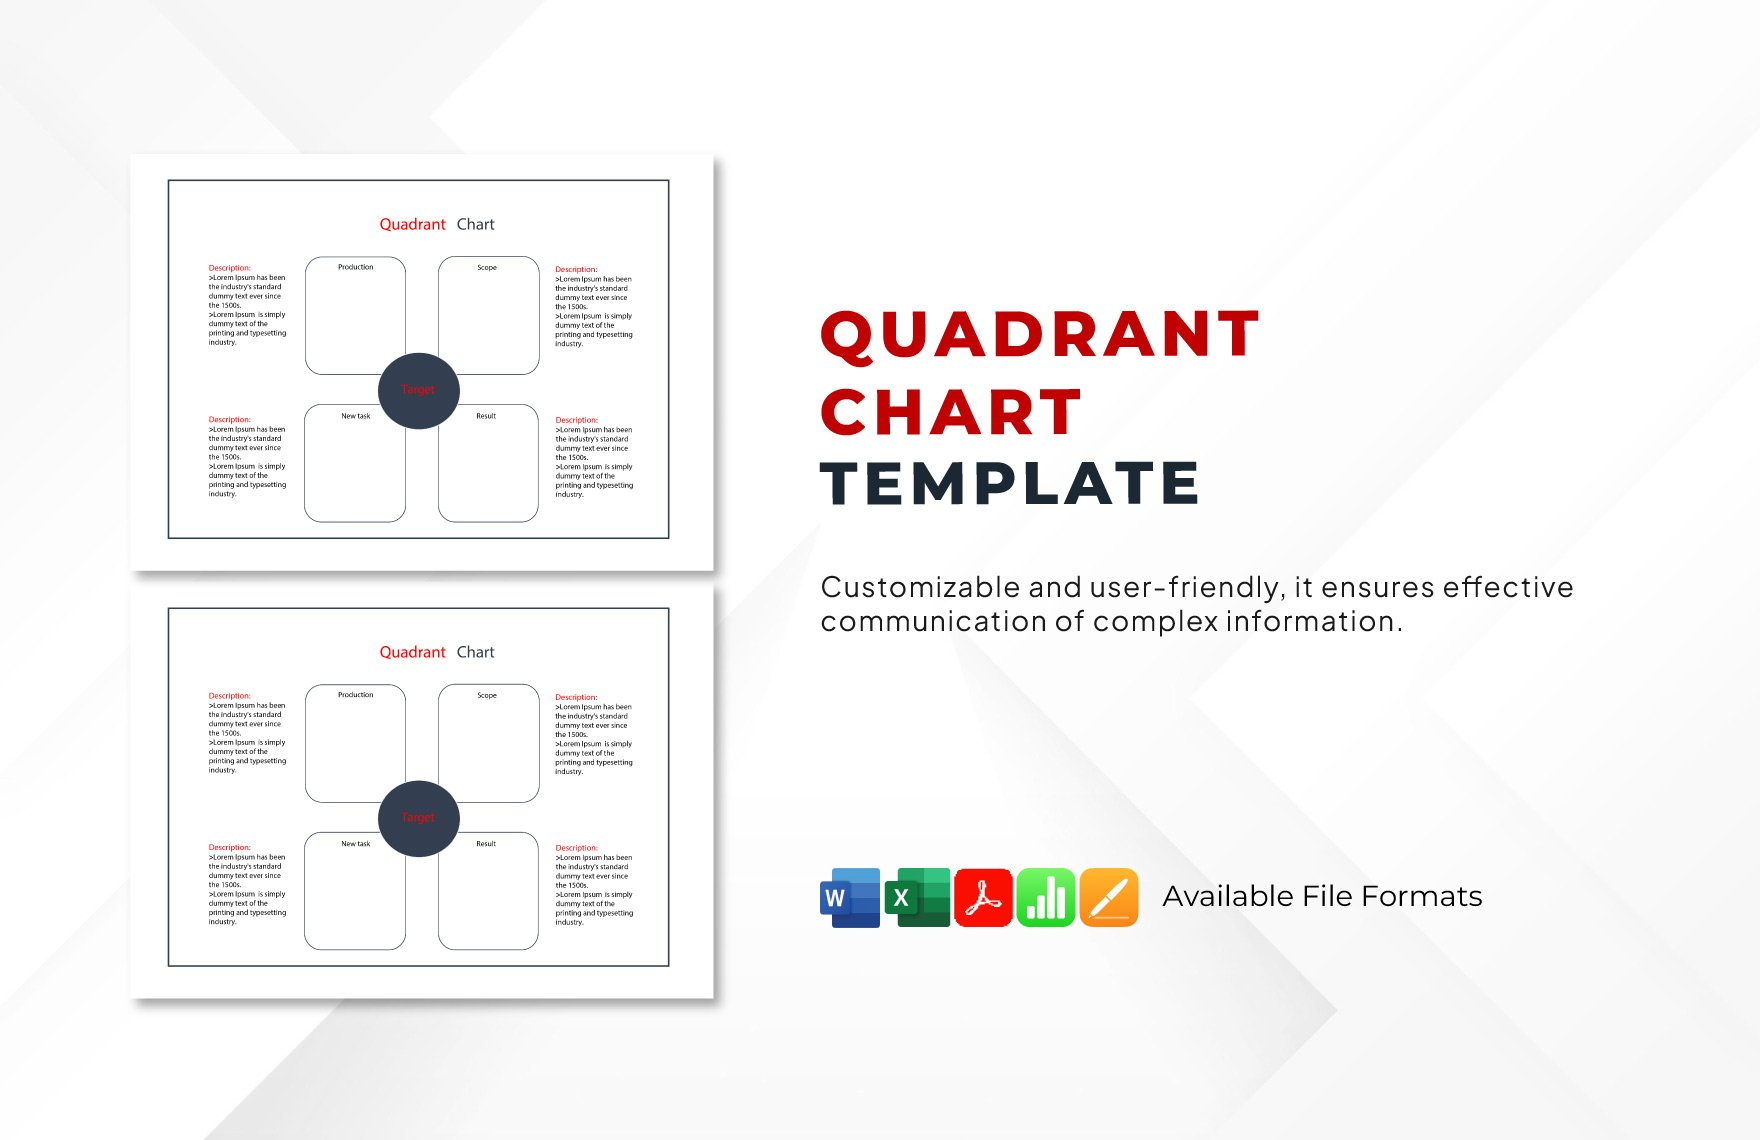
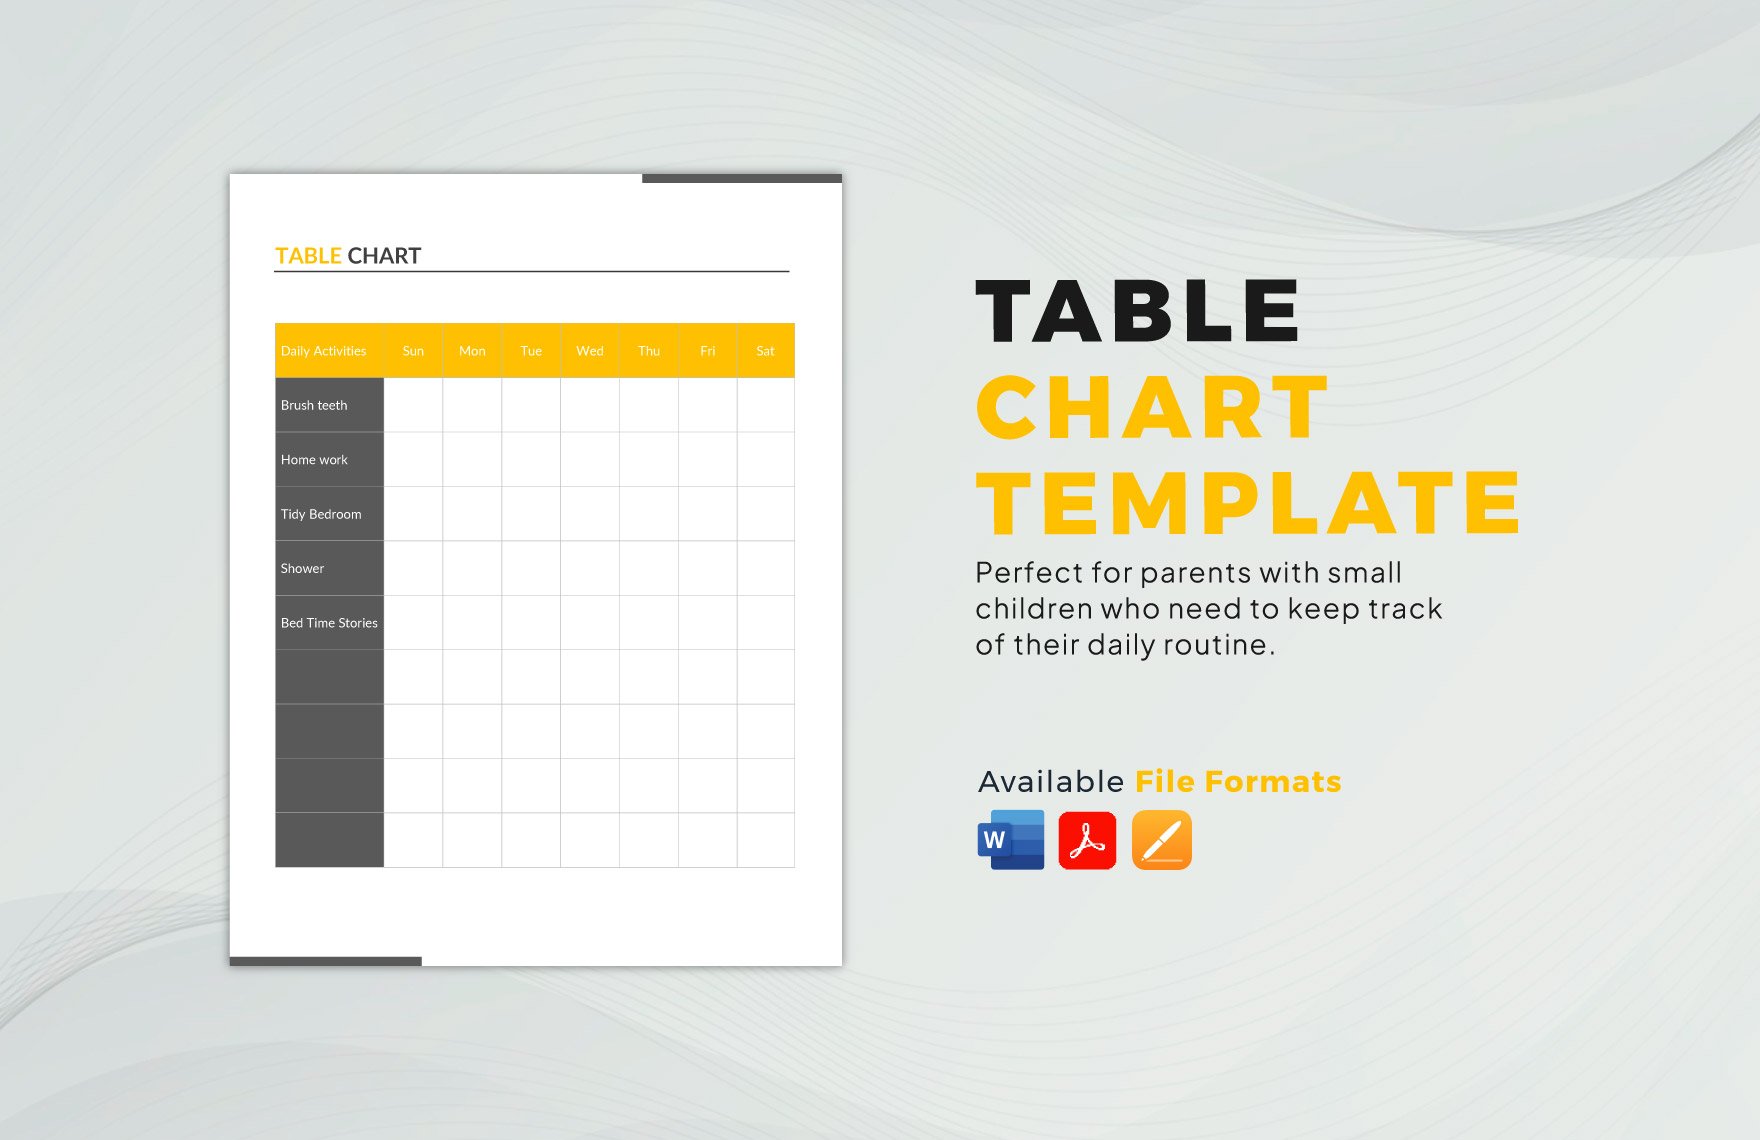
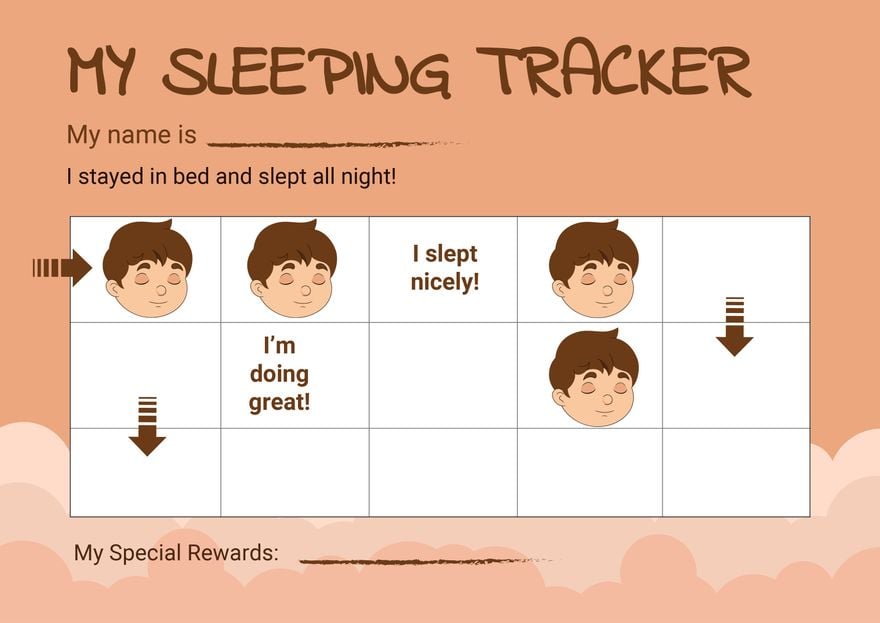
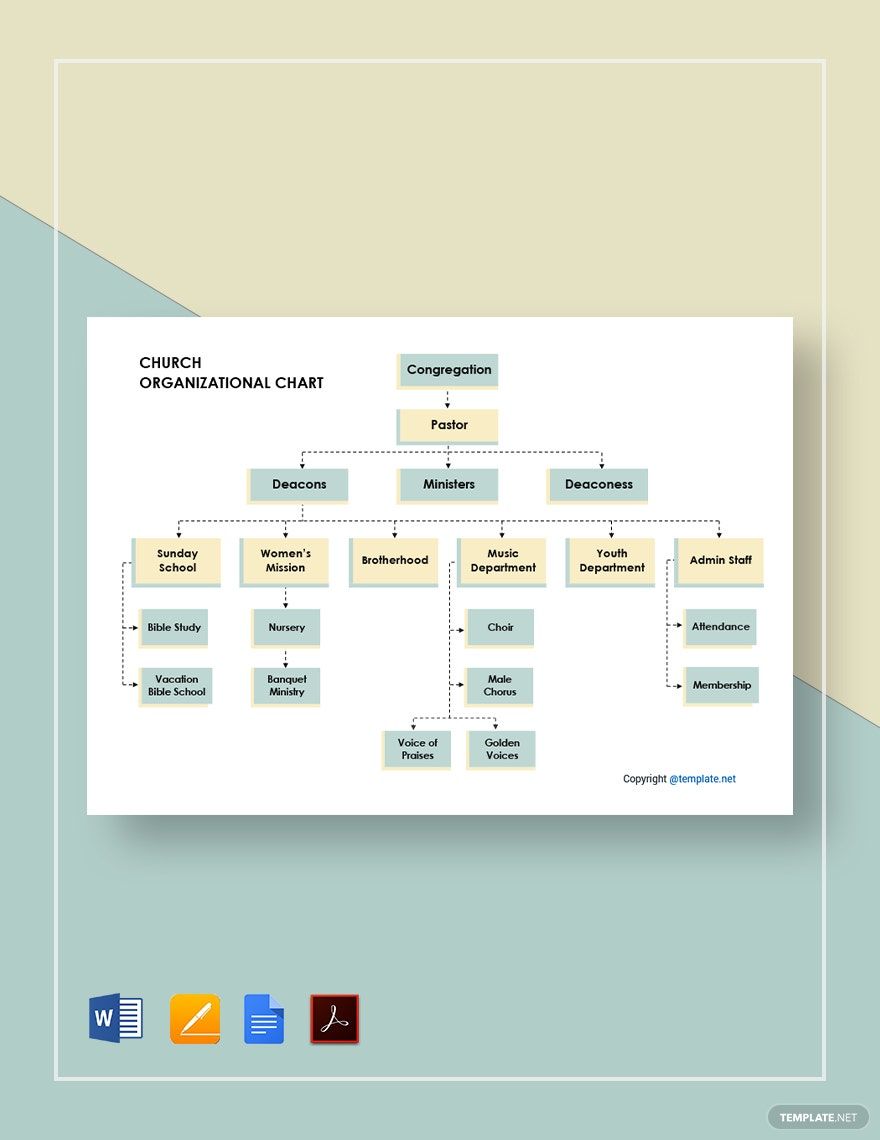
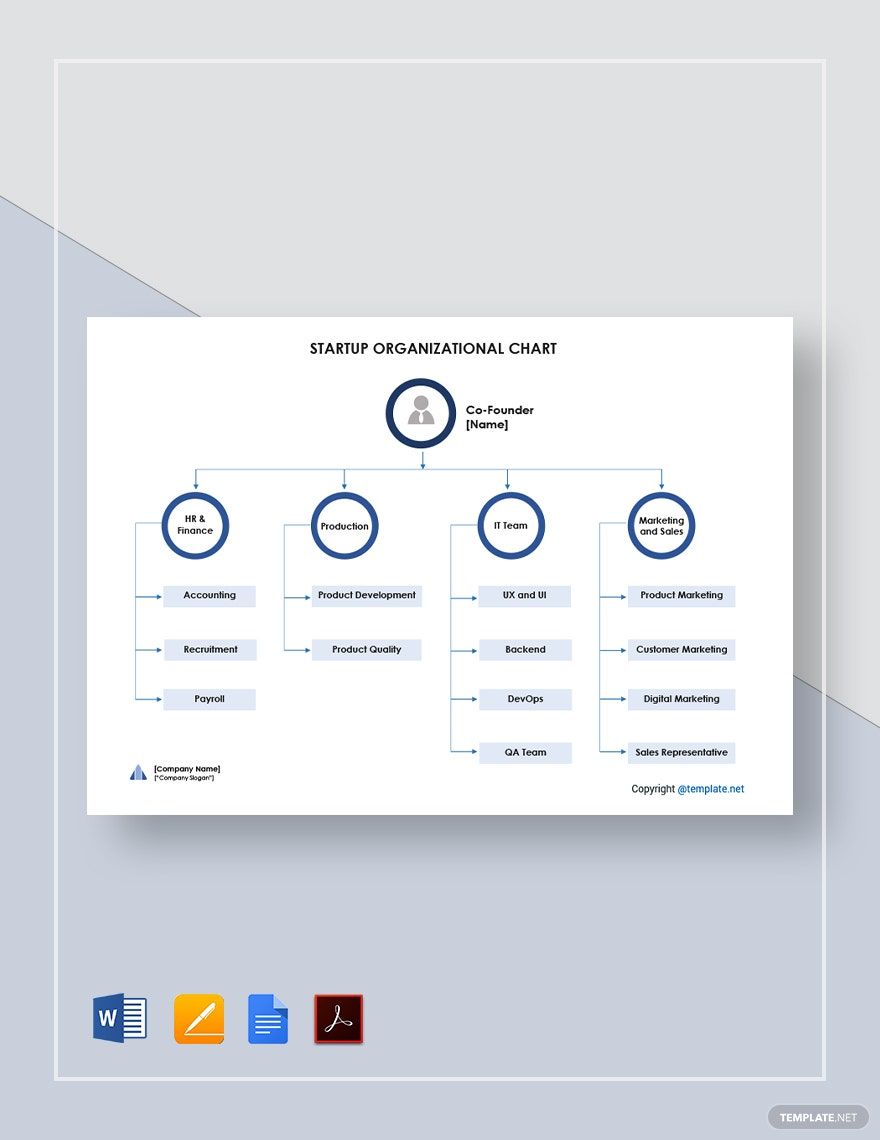
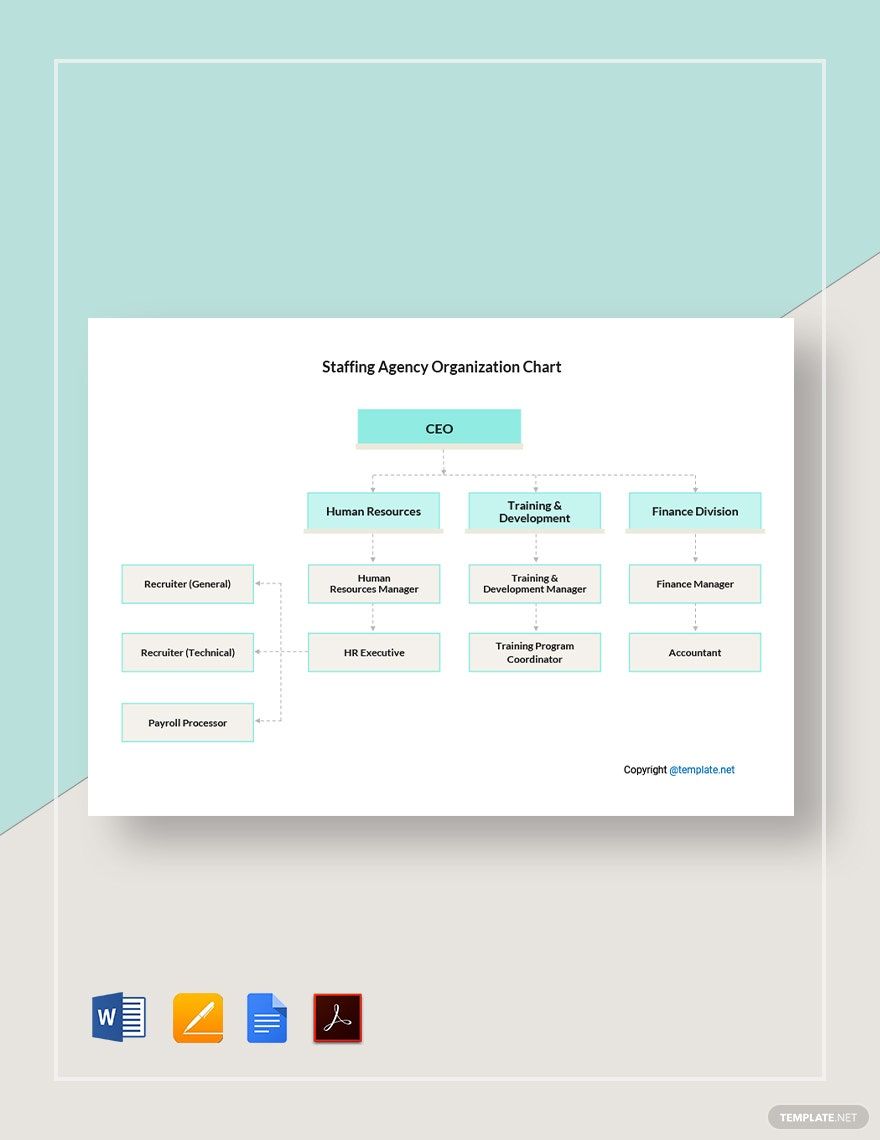
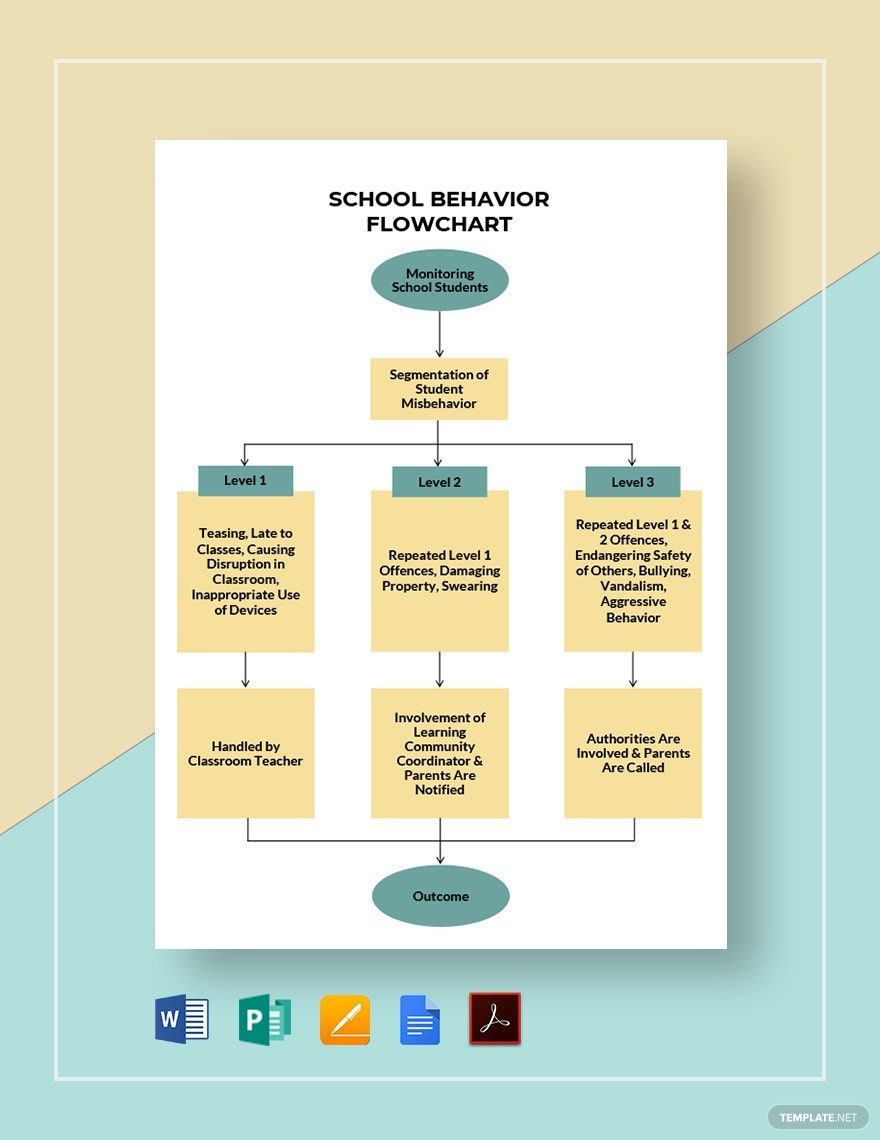
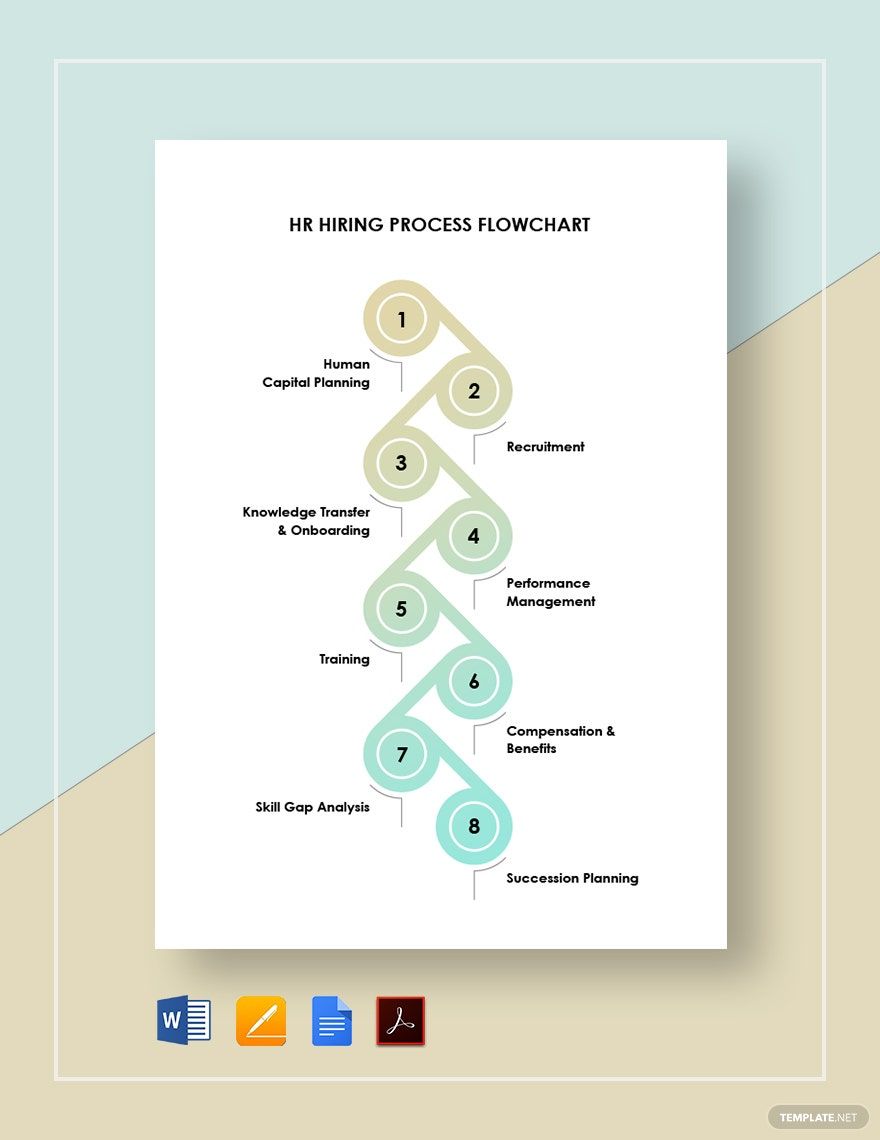
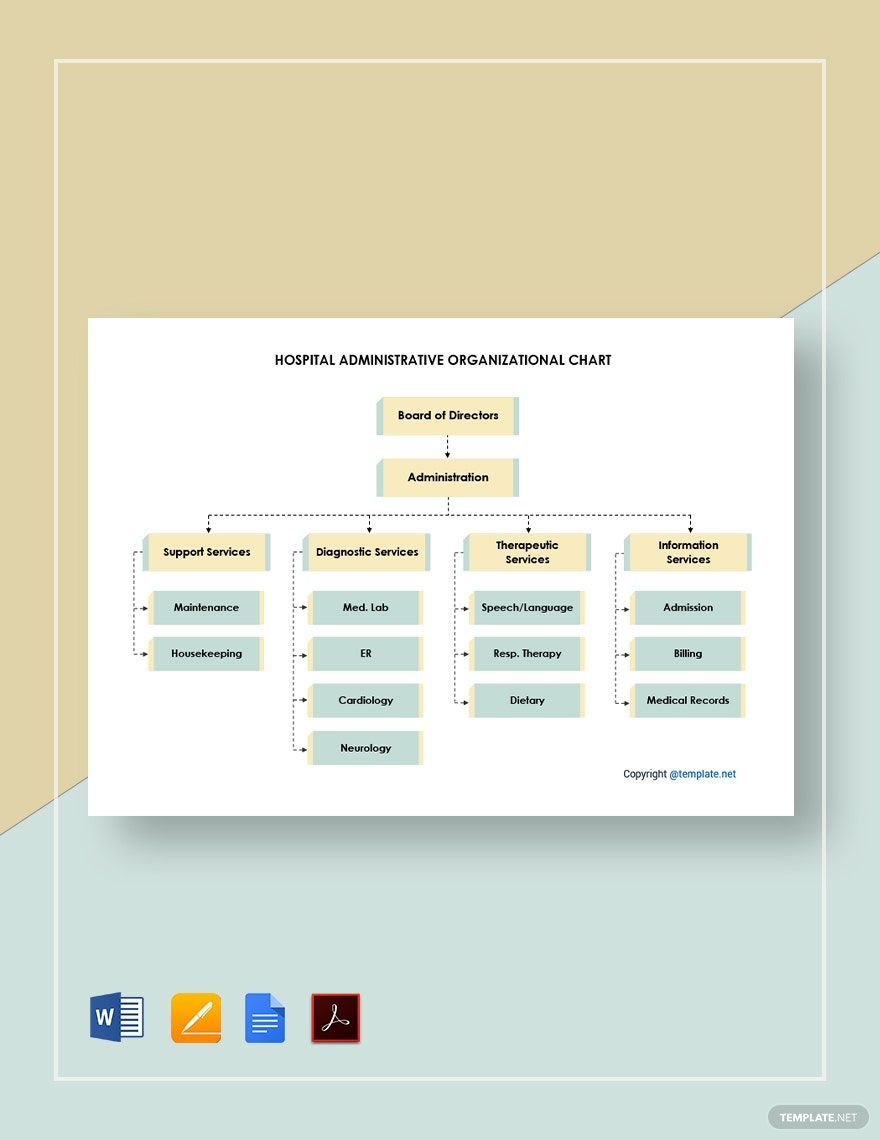
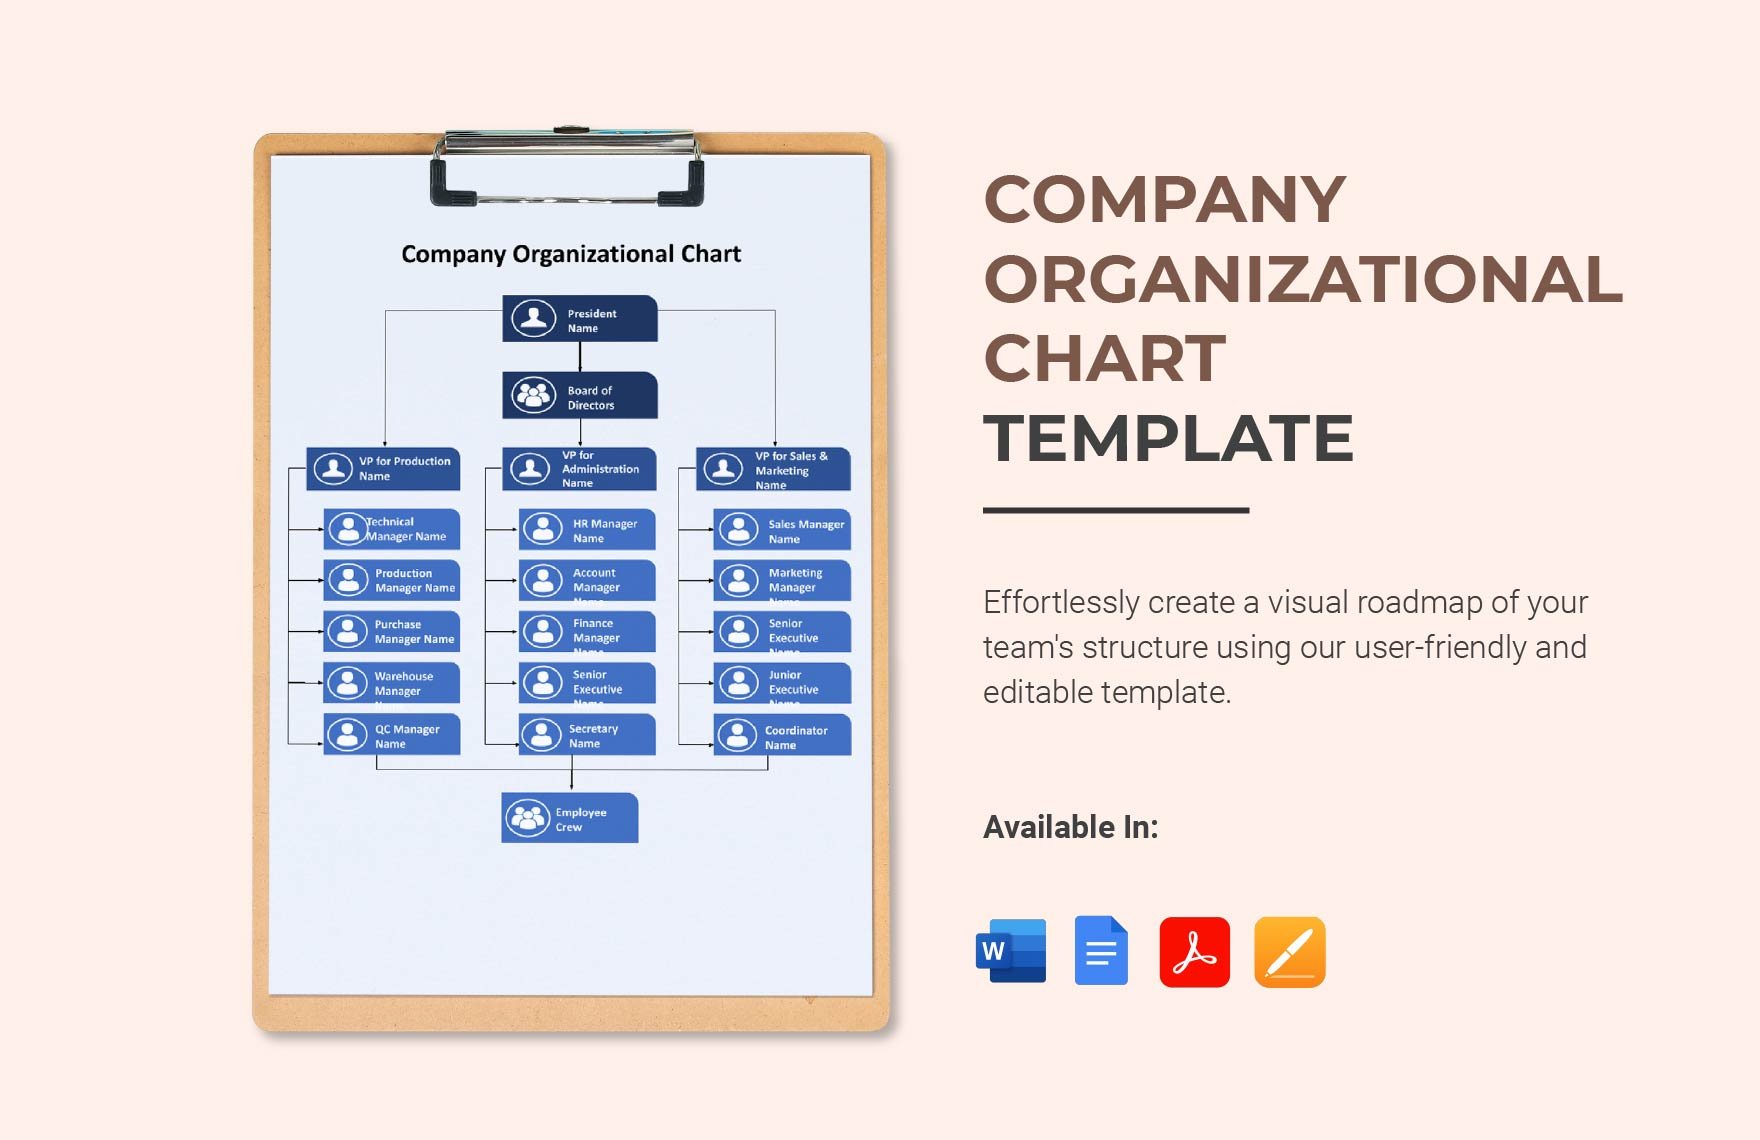
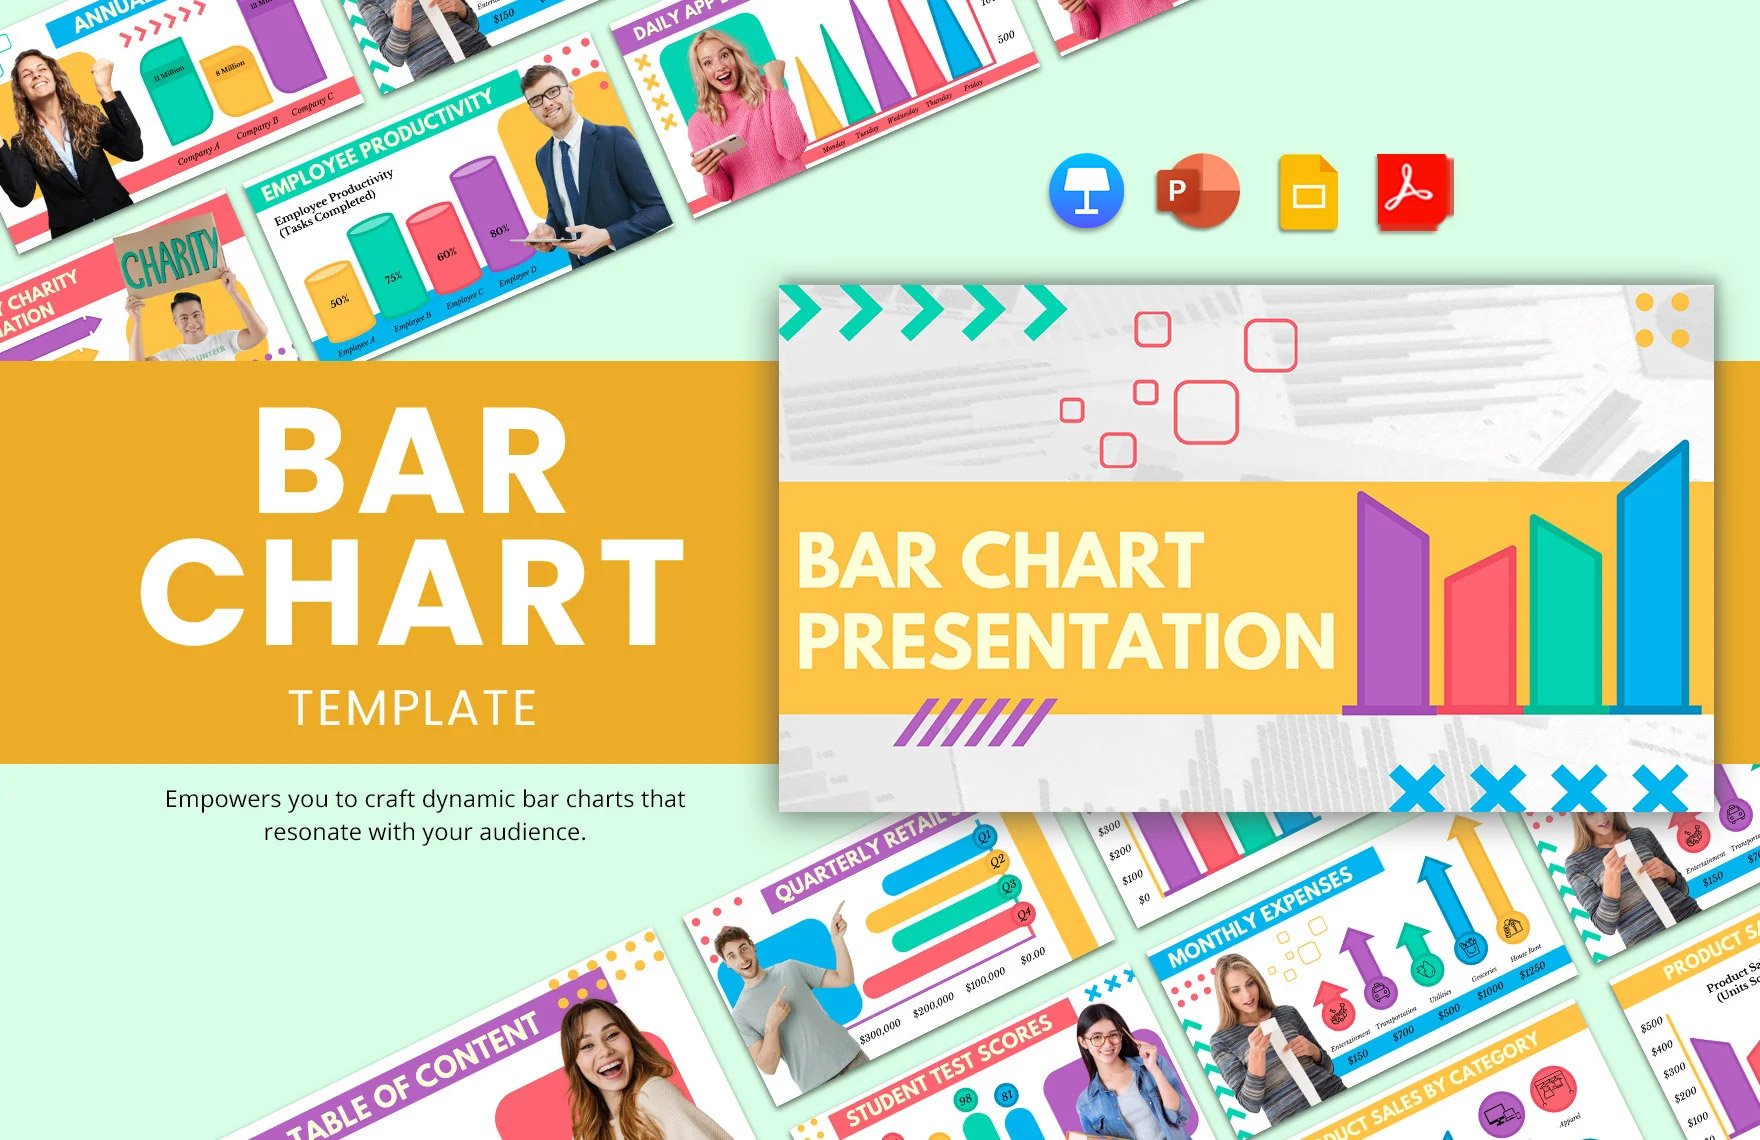
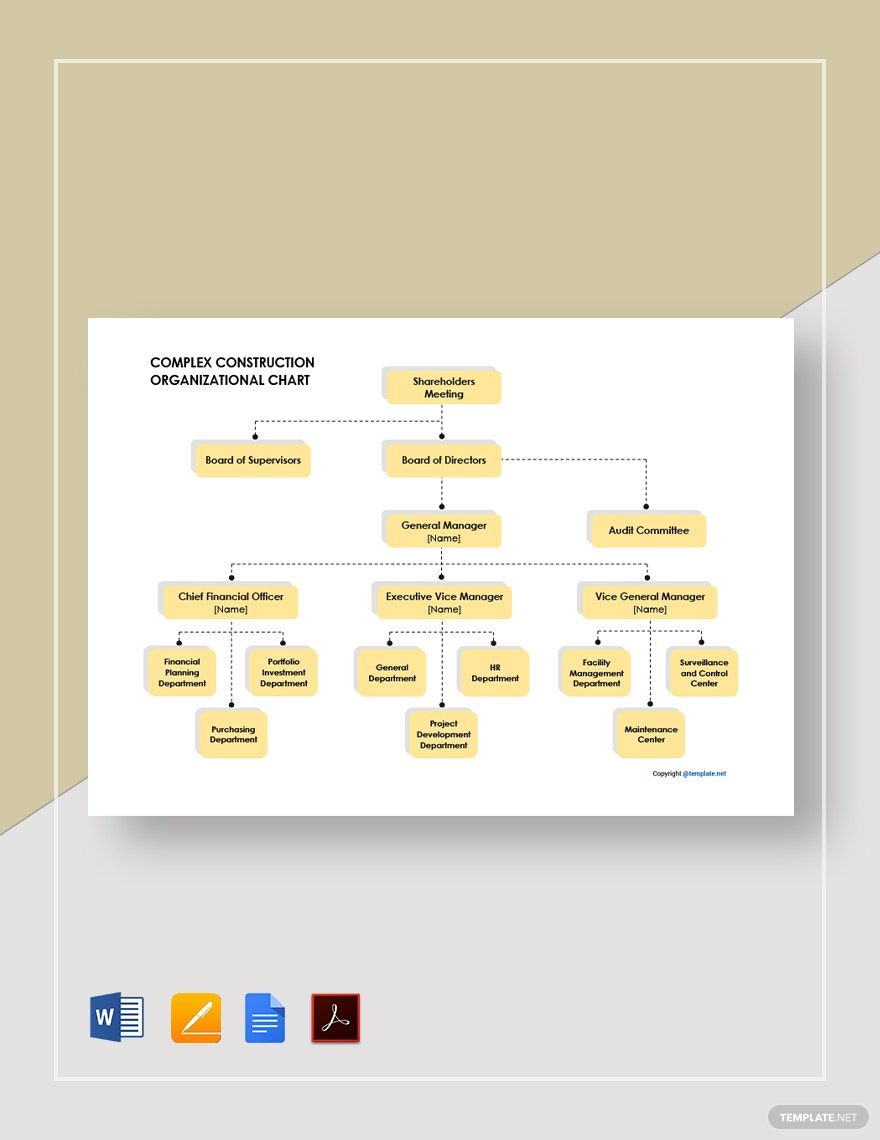
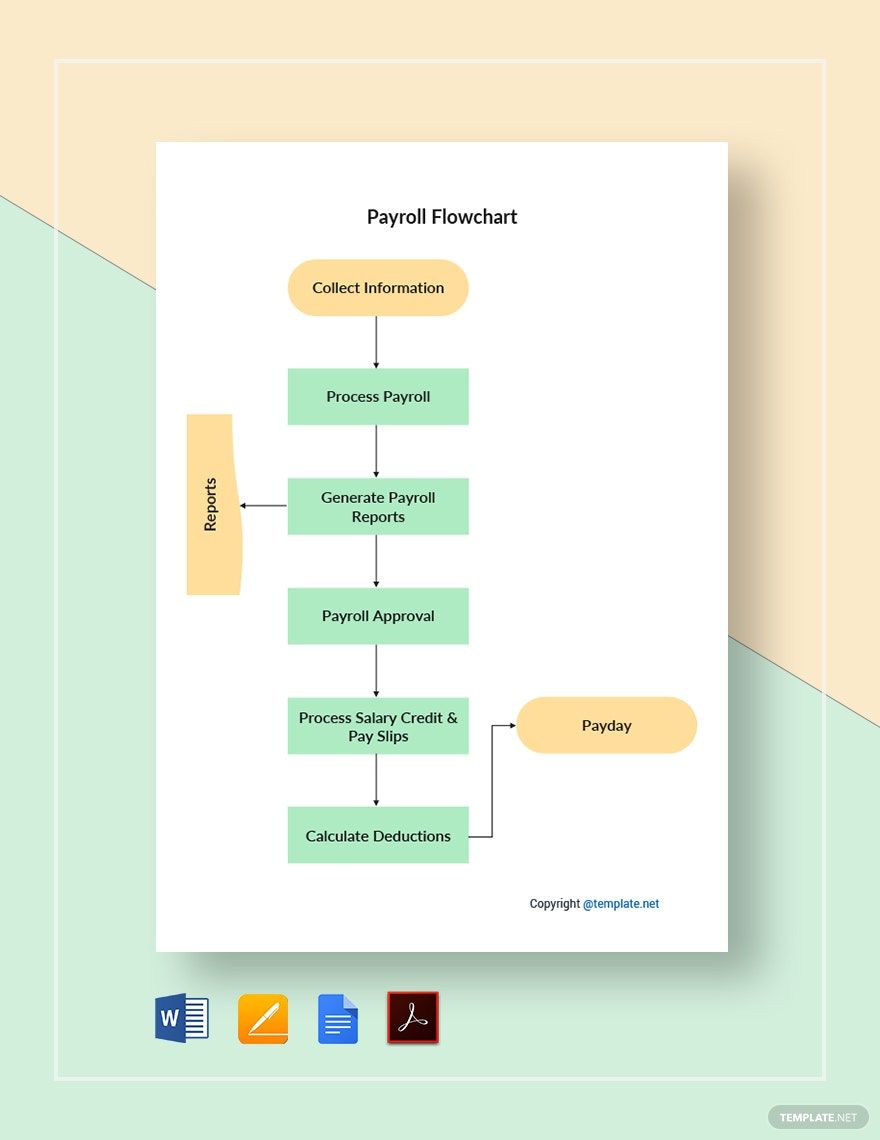
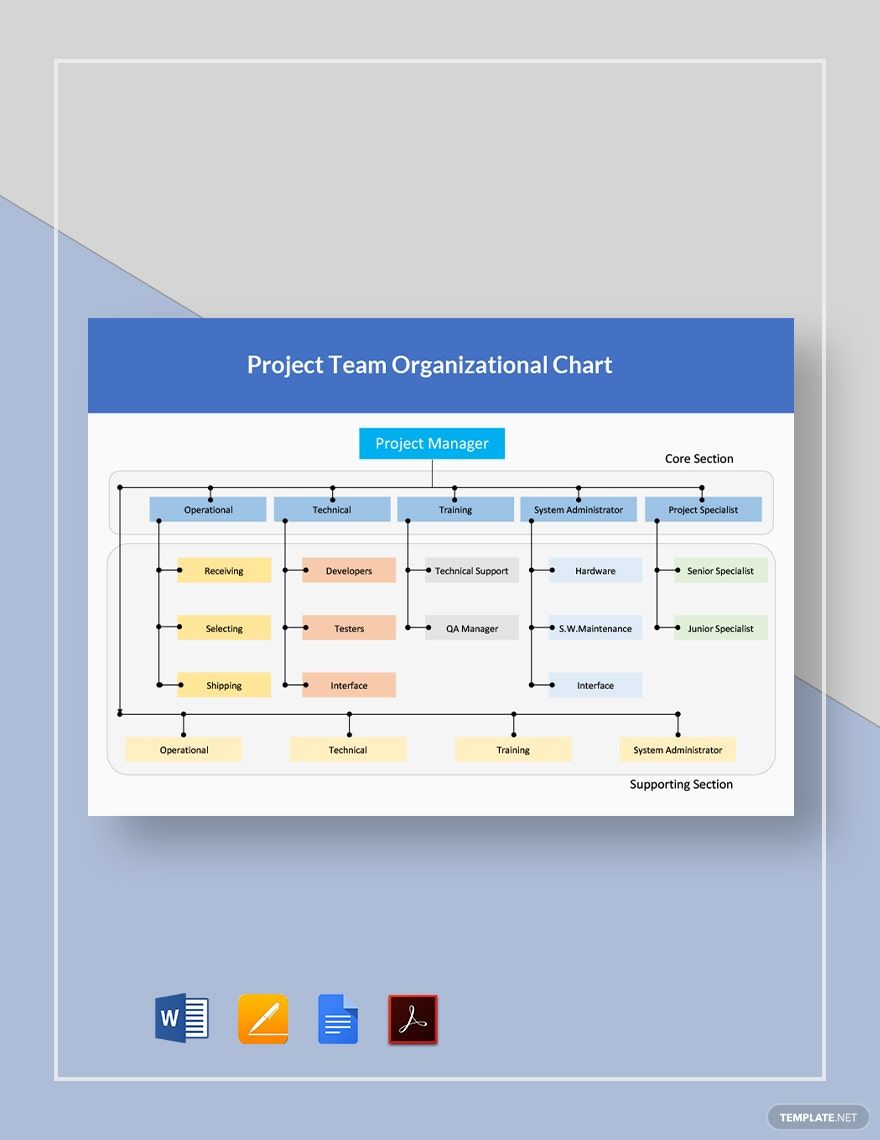
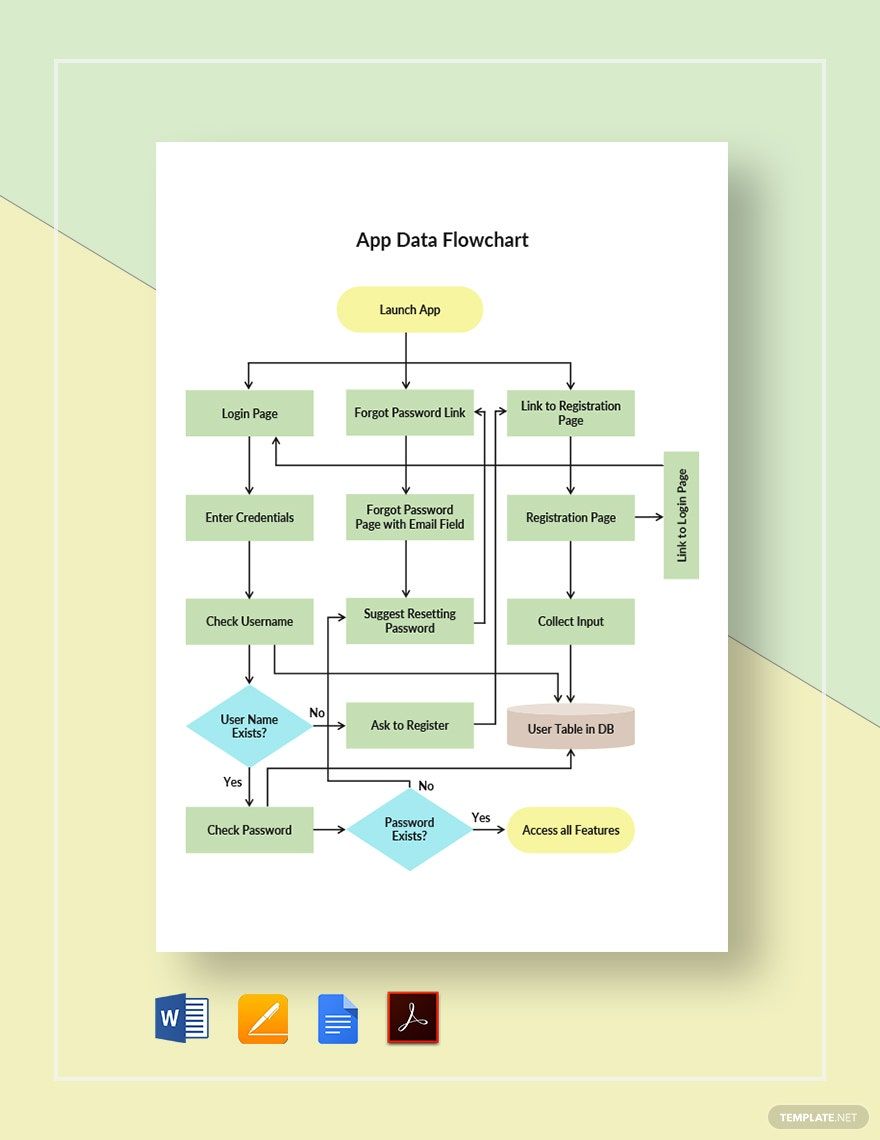
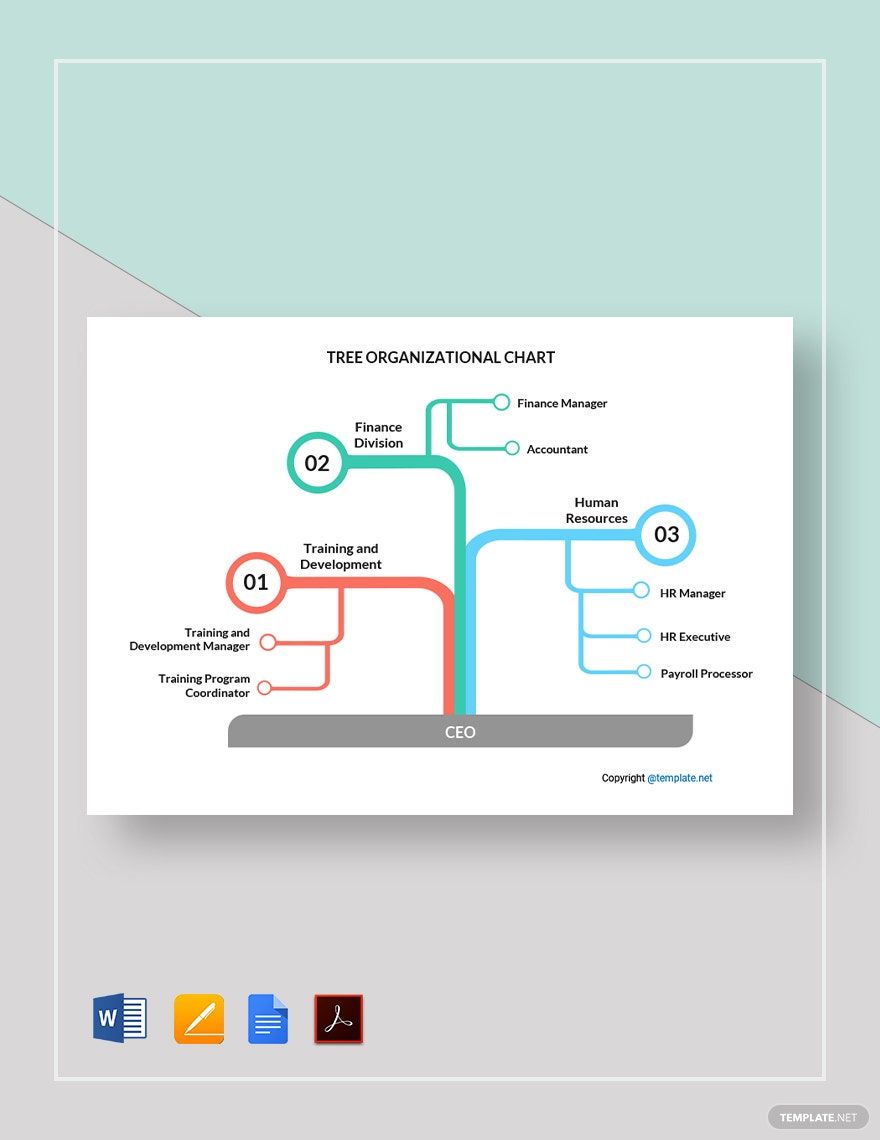
Create charts that are in Portable Document Format (PDF) that makes it independent of application software, hardware, and operating systems. Download our Chart Templates in Adobe PDF and use for making Timelines, Glow Charts, Gantt, and Seating Arrangements. The files are beautifully-designed and can be used in a wide variety of fields, whether for a project or a presentation. Make your chart now and be able to understand large quantities of data as well as the relationship between parts of the data. Easily-editable, and 100% customizable for your convenience. Print-ready, perfect for commercial as well as personal printing. Save the downloaded file on your PC or mobile device. Available in A4 & US Sizes.
How To Create A Chart In Adobe PDF
Charts are widely used in schools, businesses, organizations, and even at home. It is an advantage to use a chart because it has the ability to present and visualize complex data in an understandable way. Trends, chores, sections, sales, and anything will be easy to comprehend when transformed into a chart.
Making a chart can sometimes be complicated and confusing, but we have steps below that can ease your problems. Follow the provided steps below:
1. Determine The Chart Type
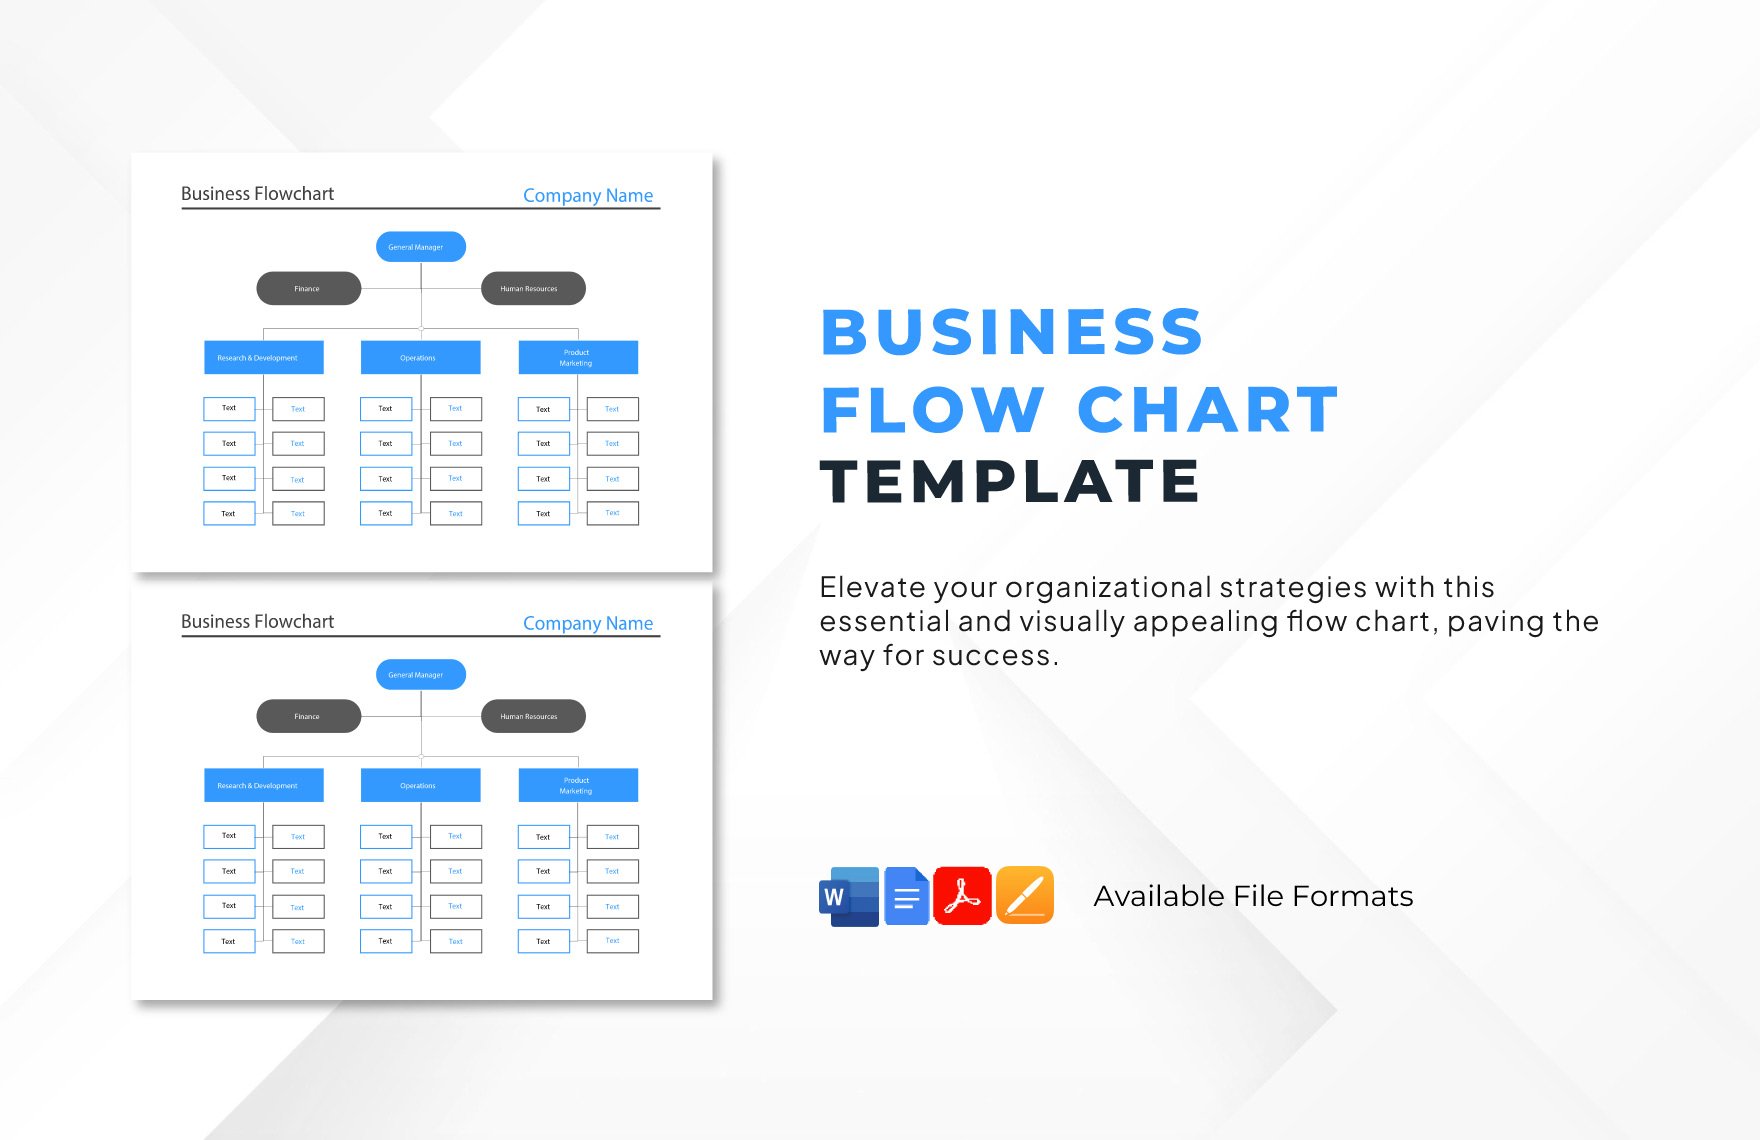
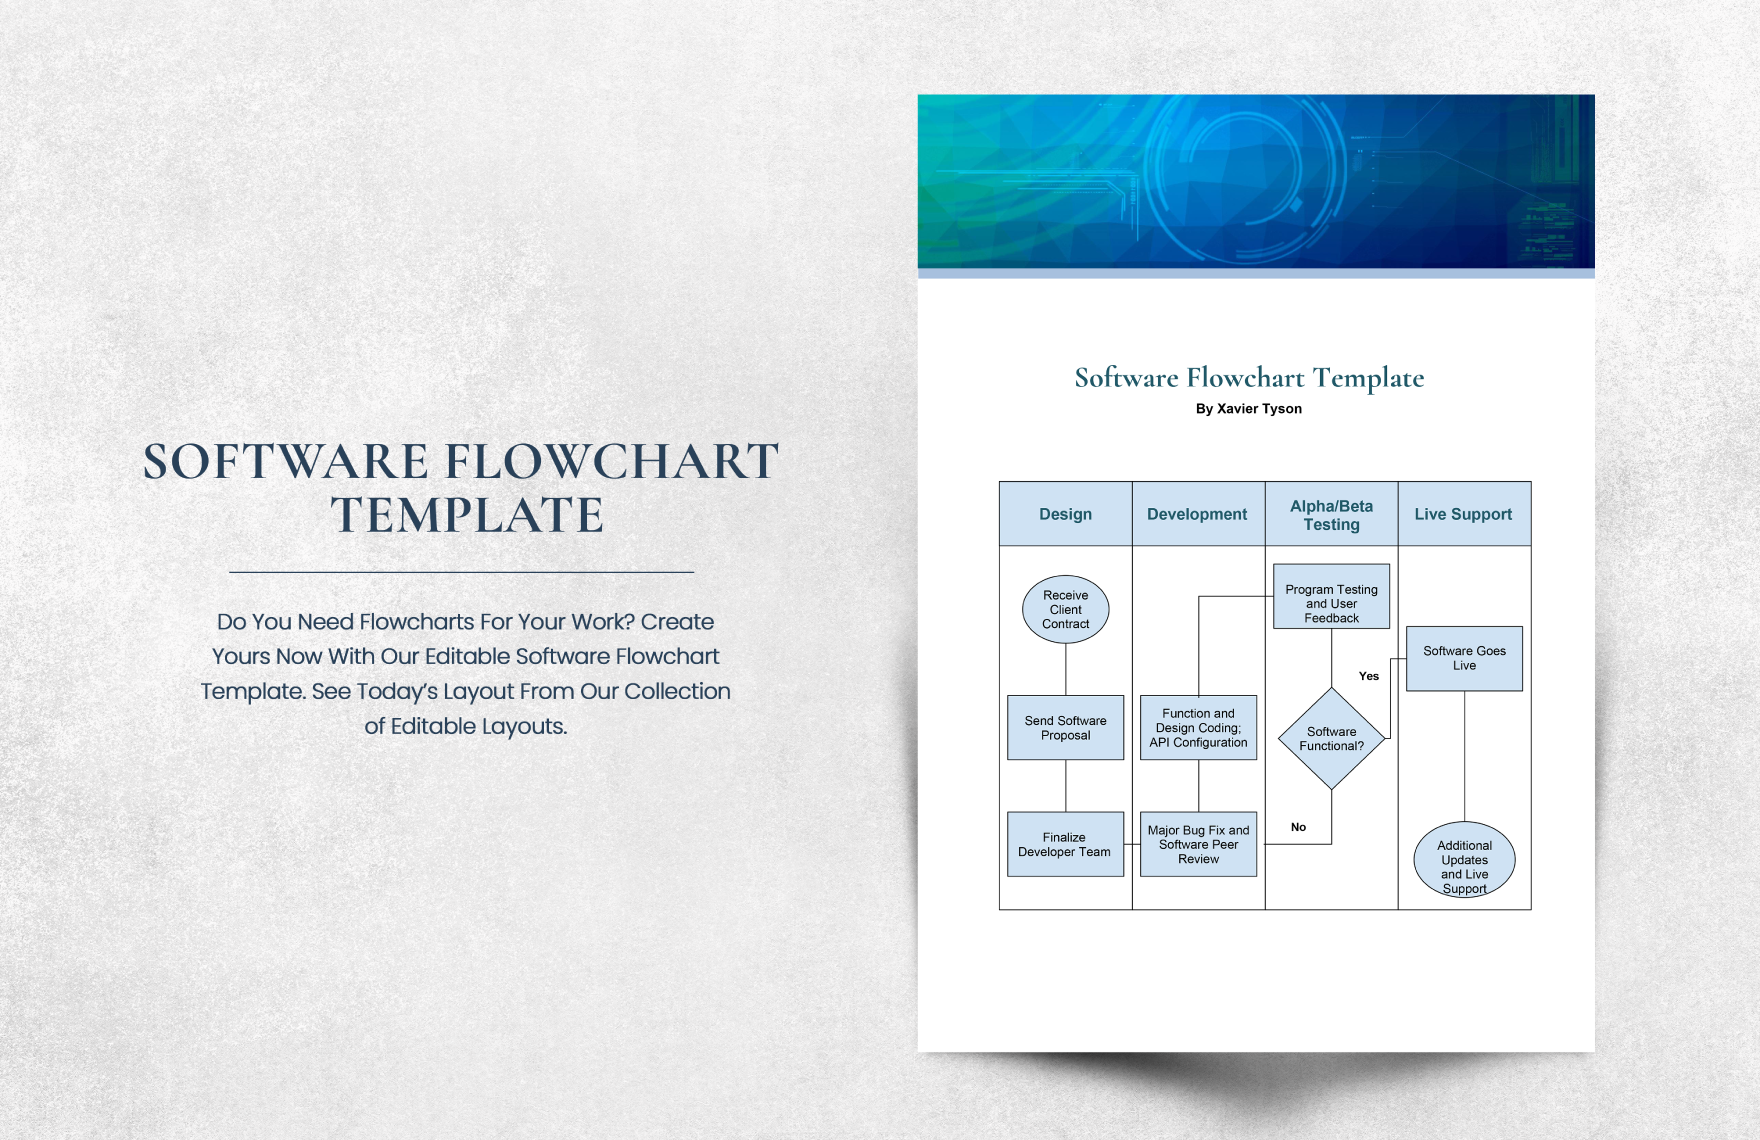
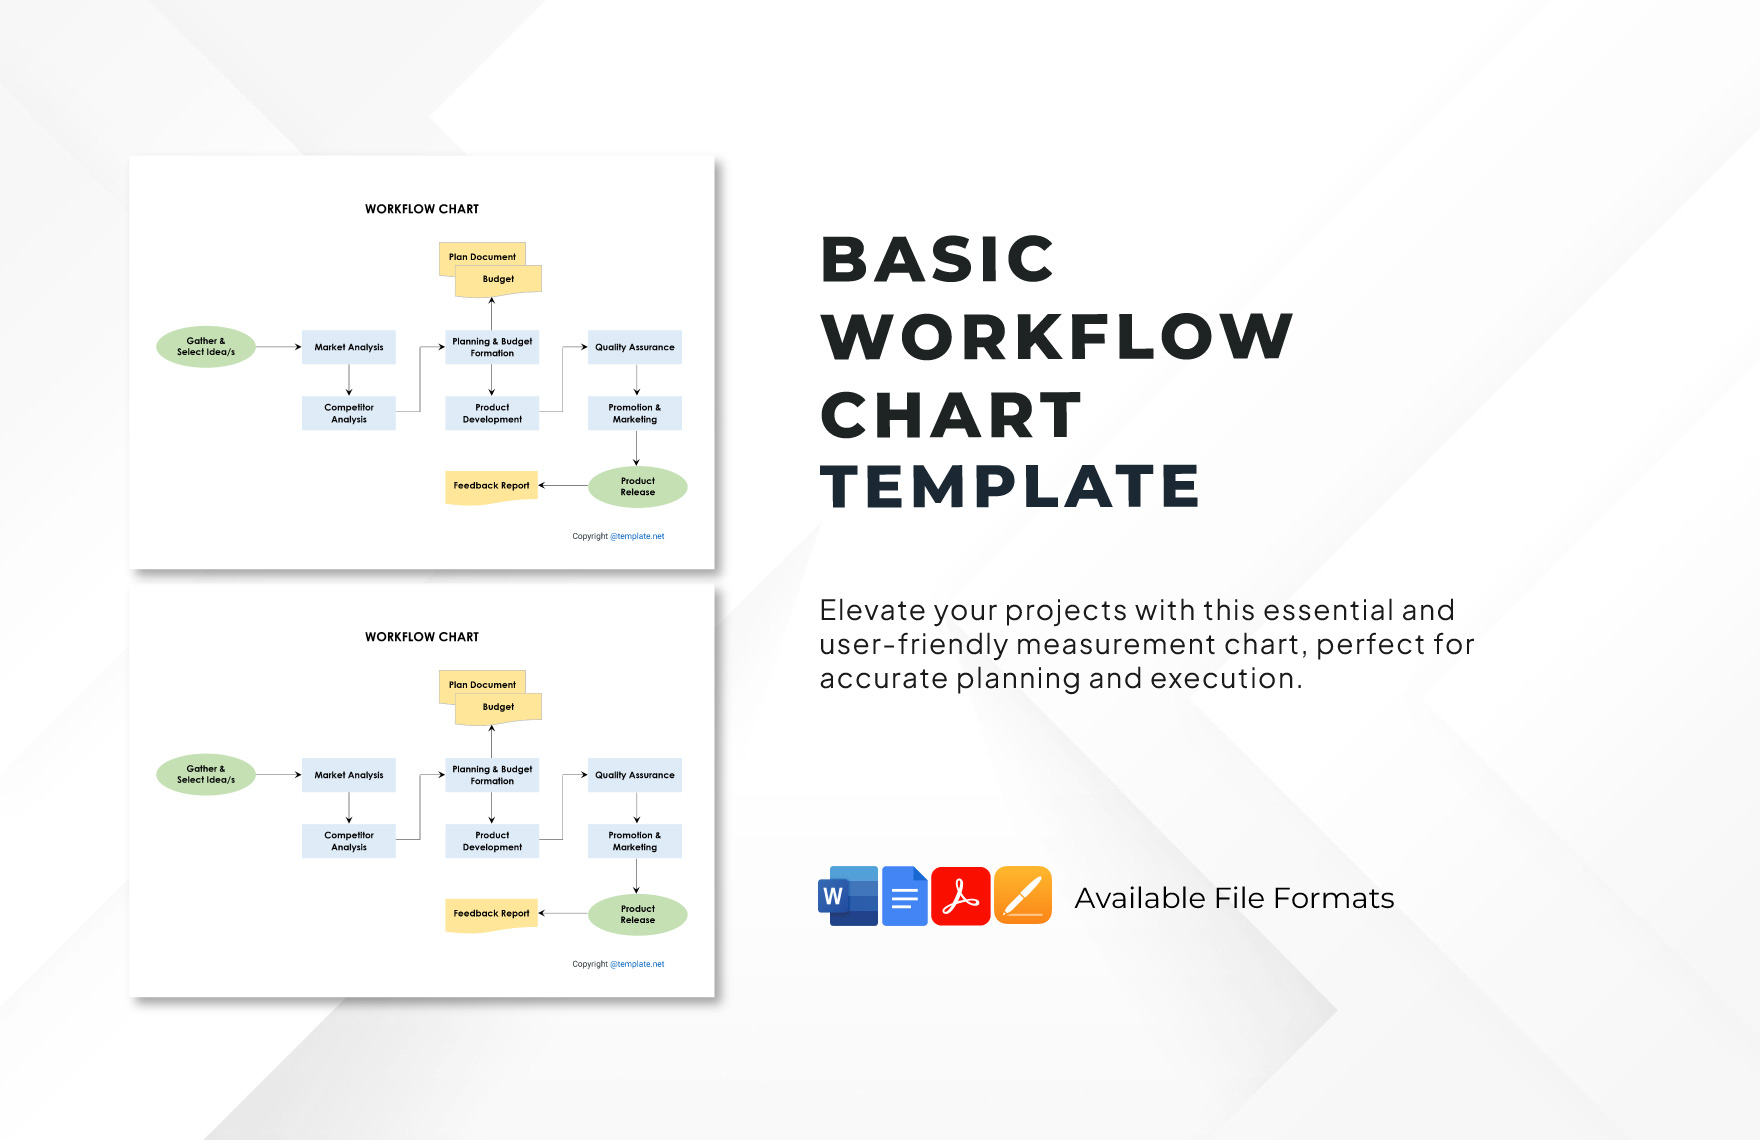
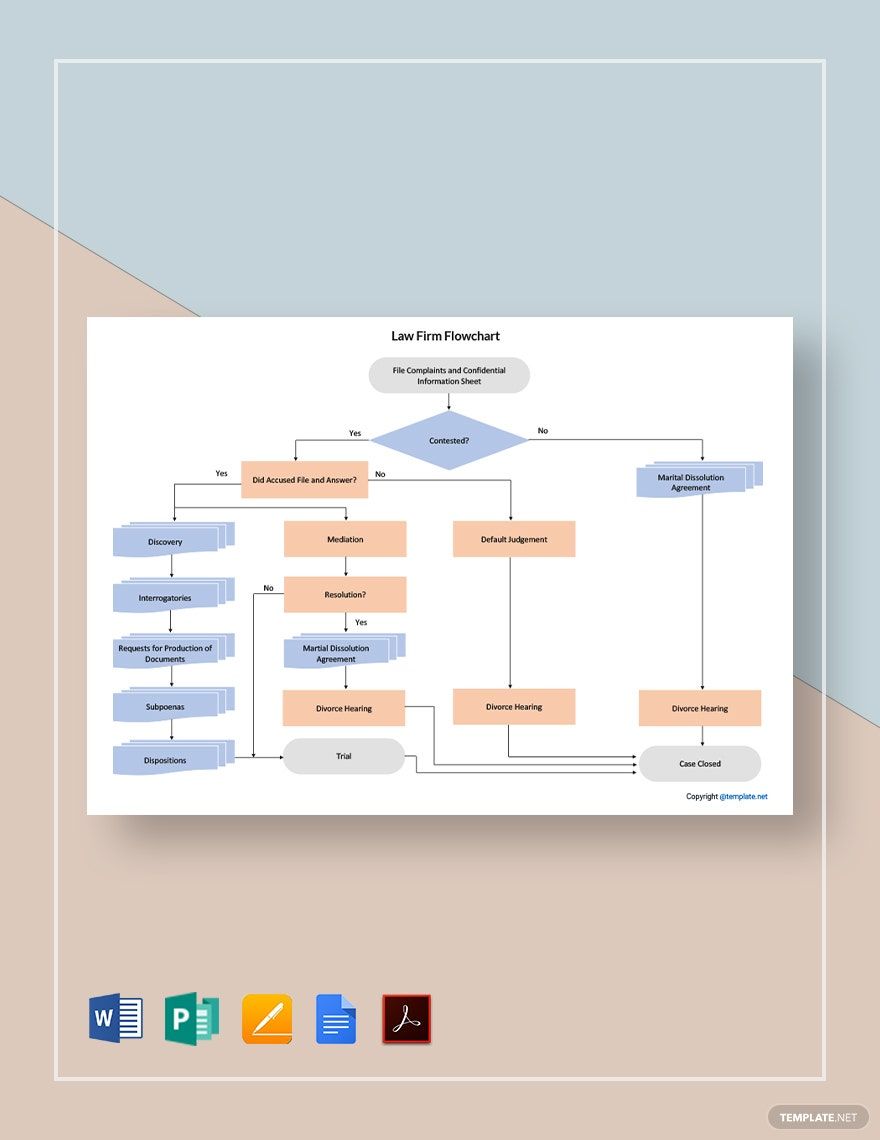
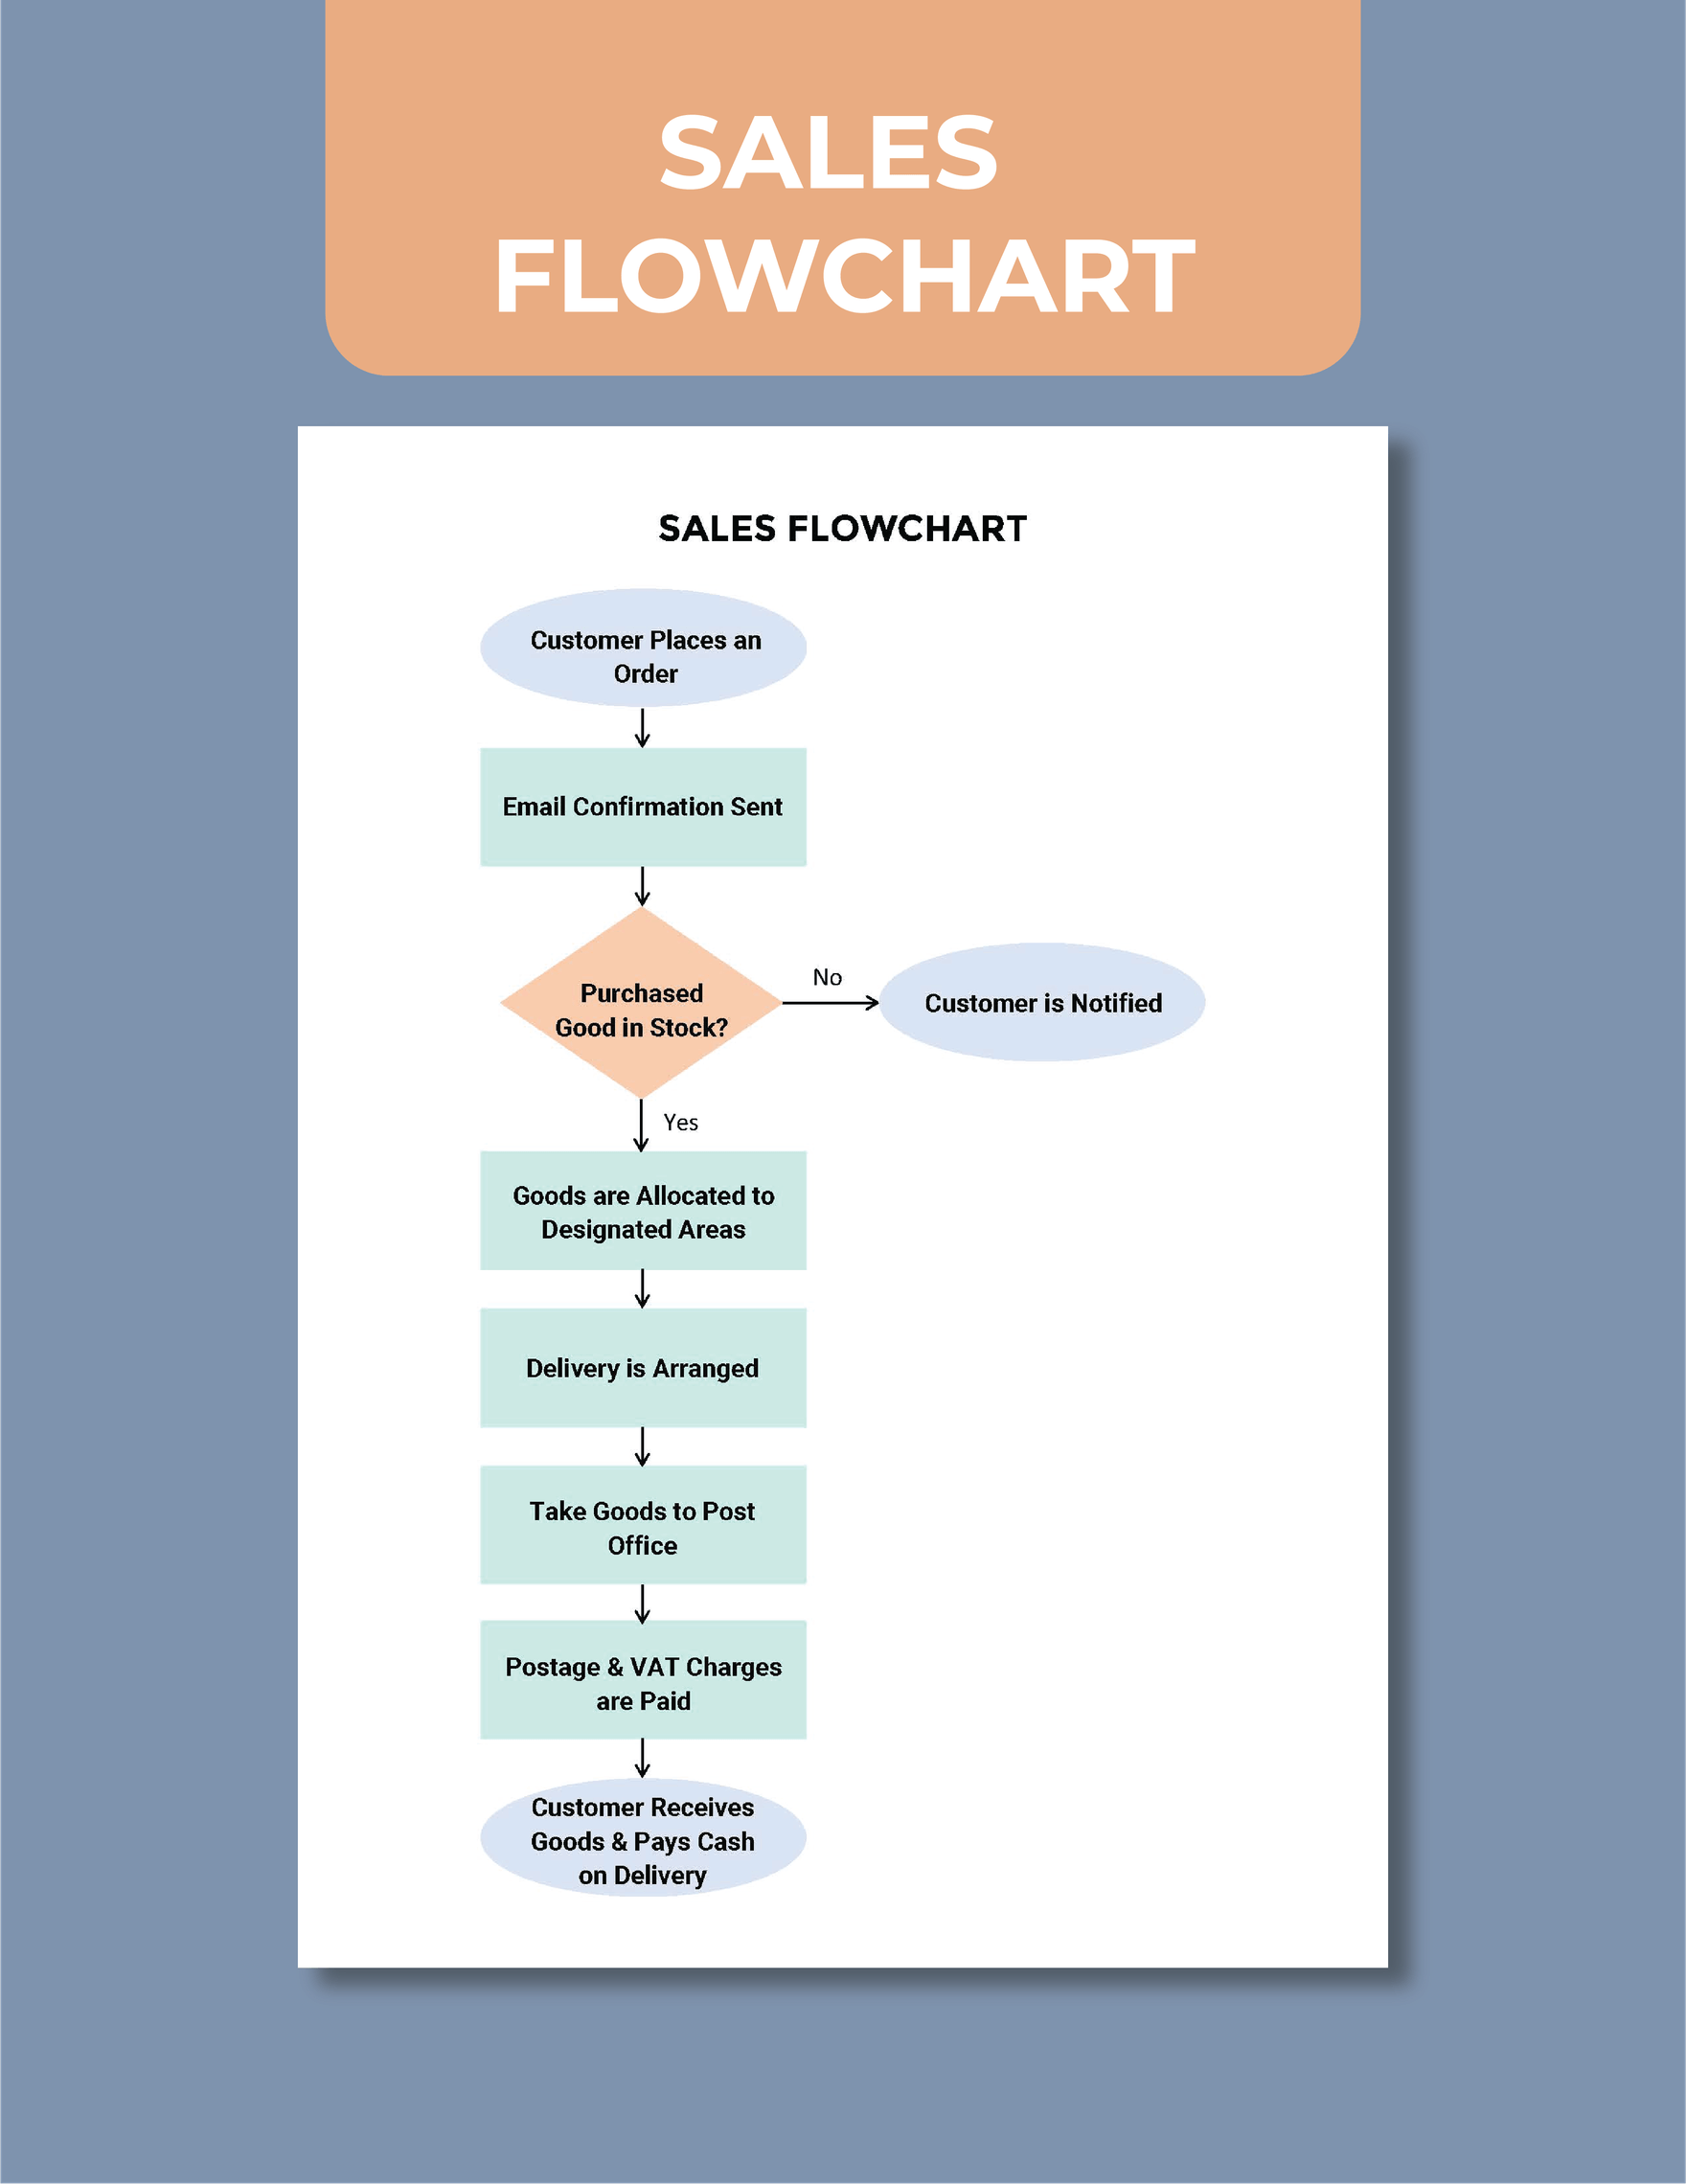
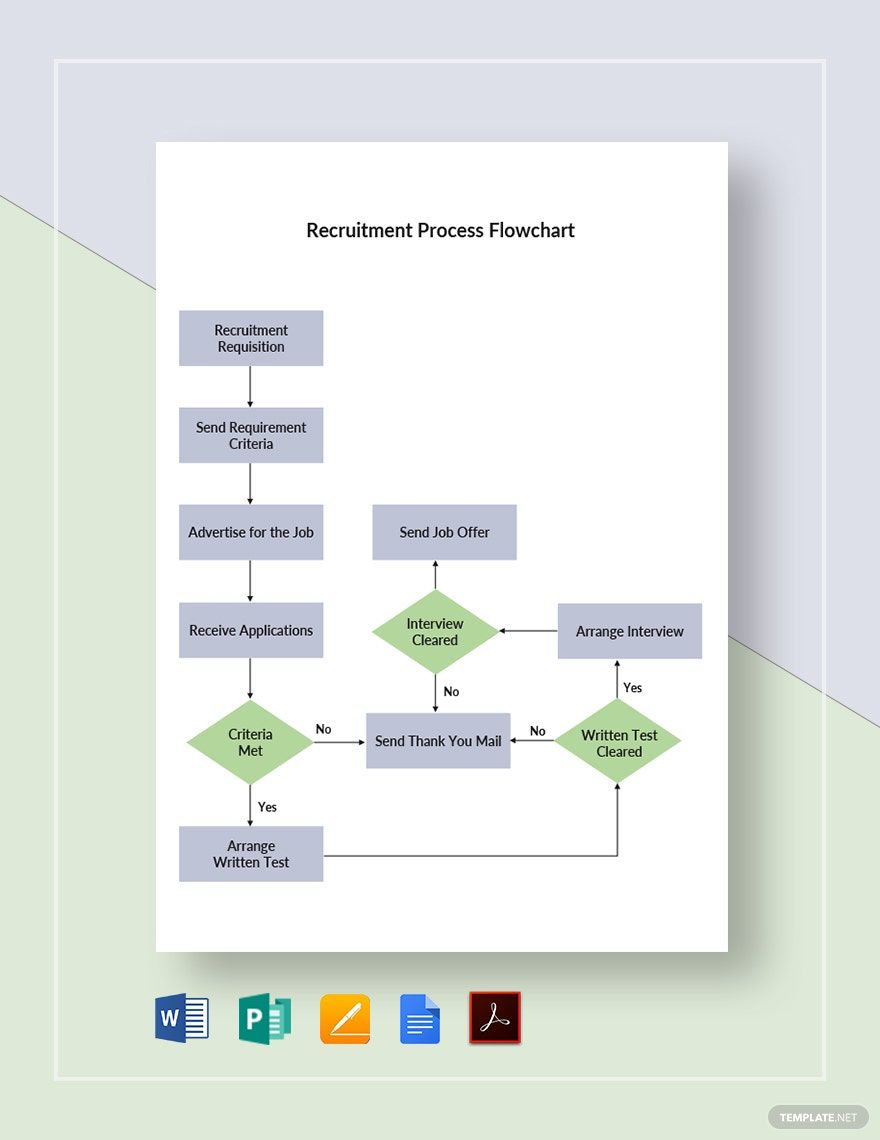
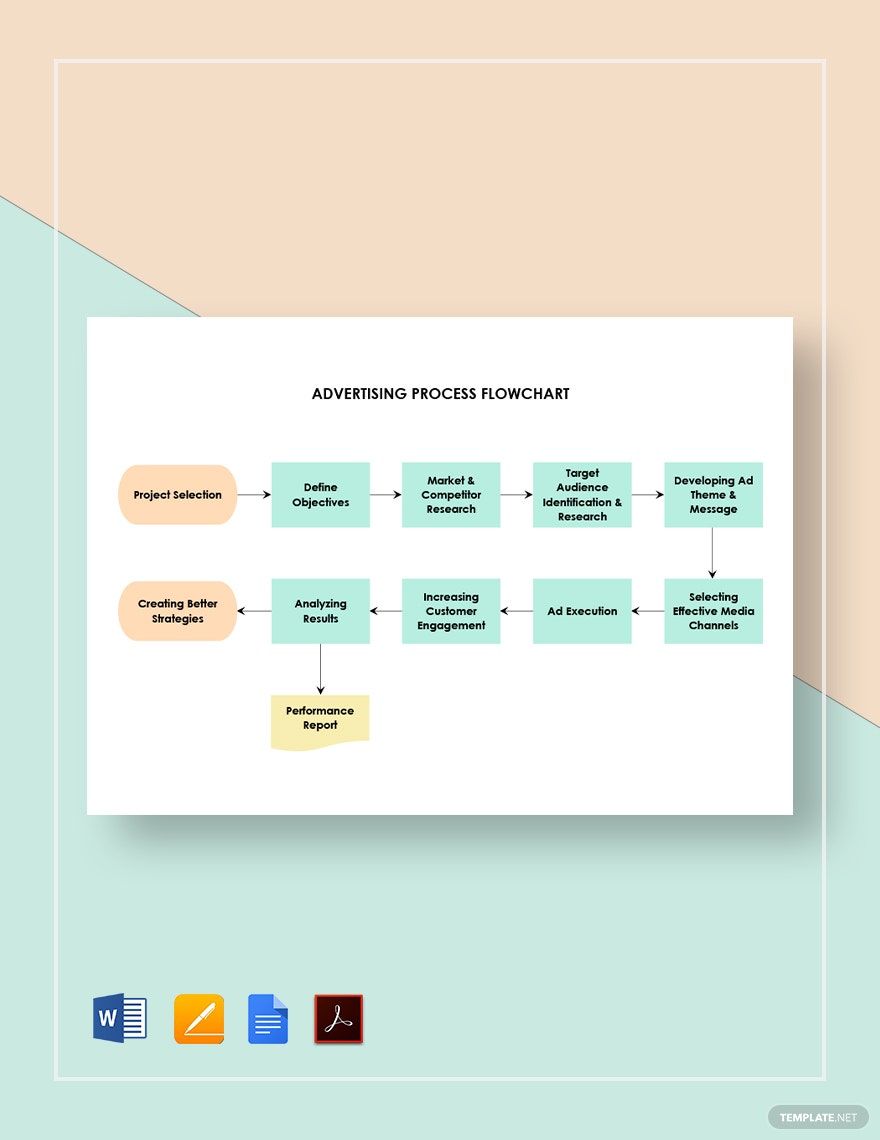
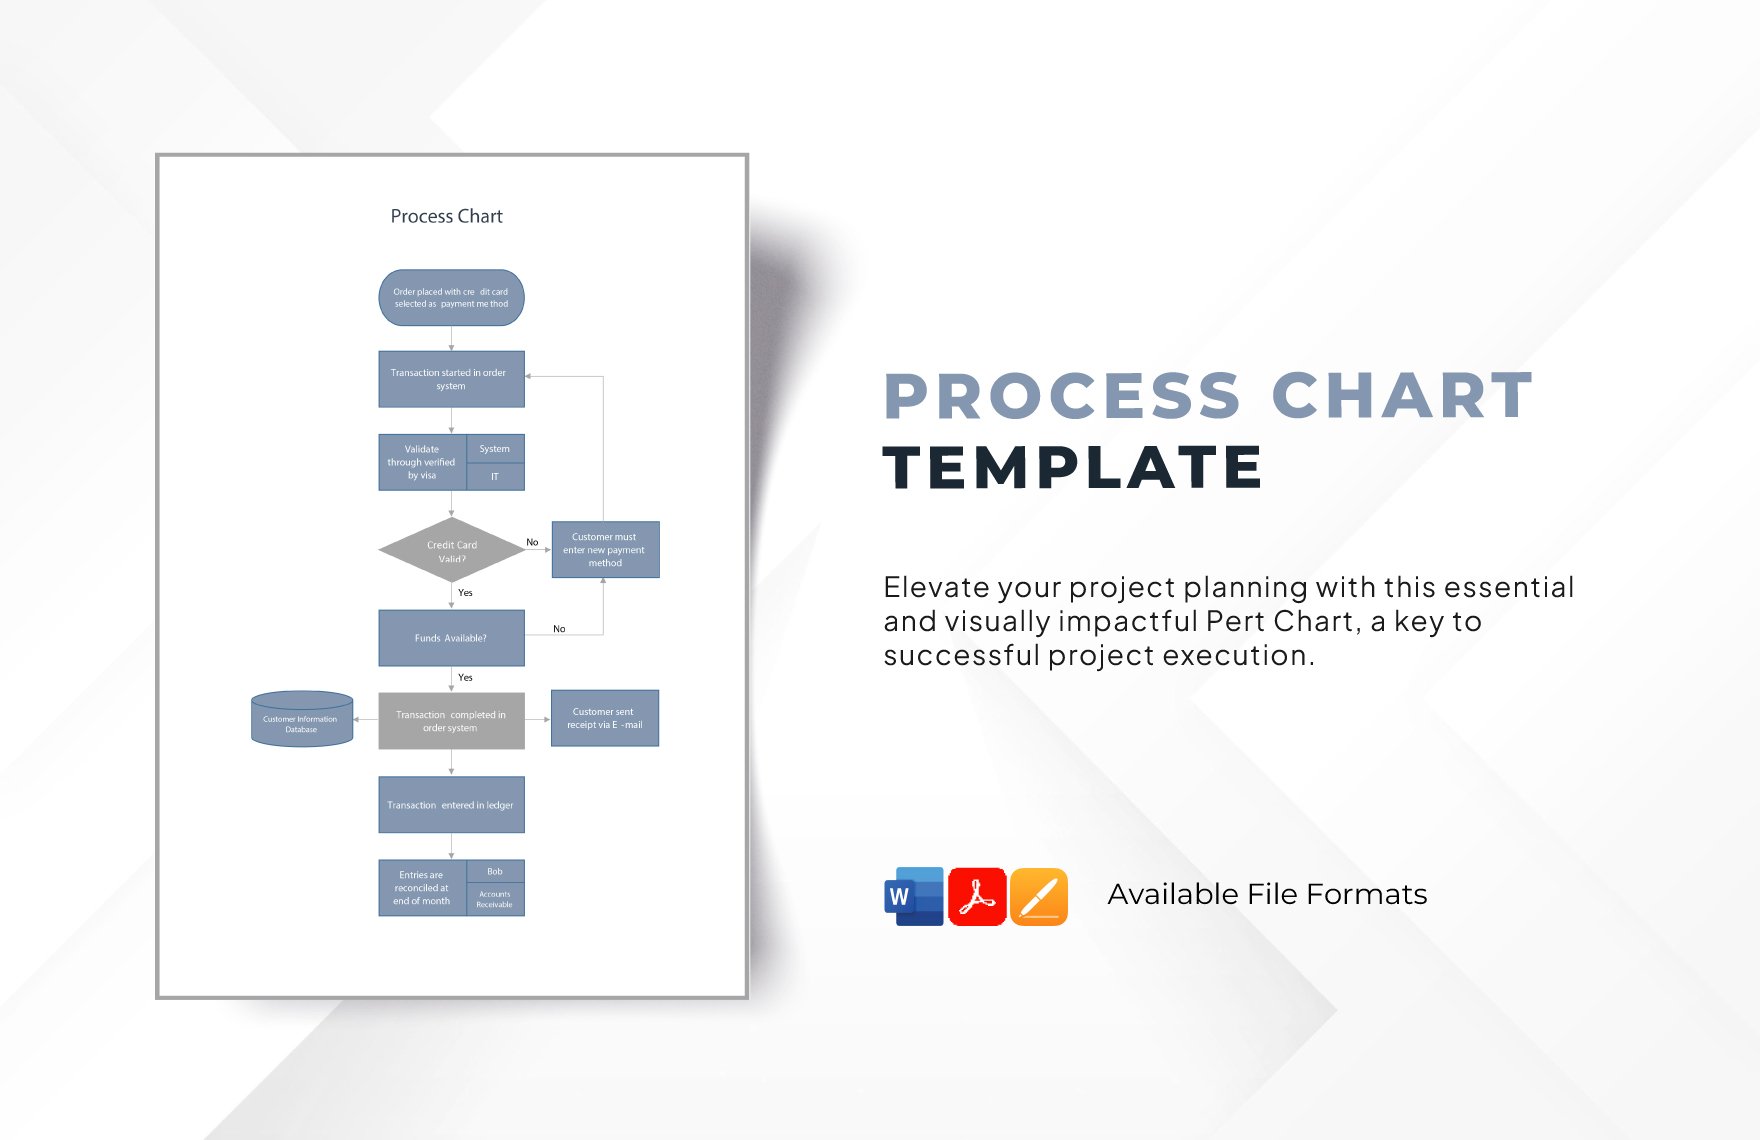
If you browse and look for chart types, you will see tons of it. To narrow down the types and be able to determine the right chart for you, categorize the chart that is easy to do and that is related to your data. Choose a chart that will be able to interpret your data easily. For instance, if your data is about a flow or series of events or steps for the company, then you should look for flow charts.
2. Gather The Data
Your data should be accurate and reliable because it will not be valid if it isn't. Gather data from credible sources. To make everything easy, use the previous data in your company, and search for some supporting data that will make your chart stable and reliable. The data should be enough and able to support what you want to deliver for the audience. If you are making a Gantt chart, then make sure that you have listed all your activities or tasks that need to be done in due time.
3. Use Adobe PDF
In case the chart is in high-quality due to its extreme details of graphics, using Adobe PDF will be handy. Adobe PDF can compress your high-quality file into a small file size. That will be a big benefit when you transfer it into one device to another. Aside from that, Adobe PDF can also be protected using a password, so that means that your chart will be safe.
4. Download Templates
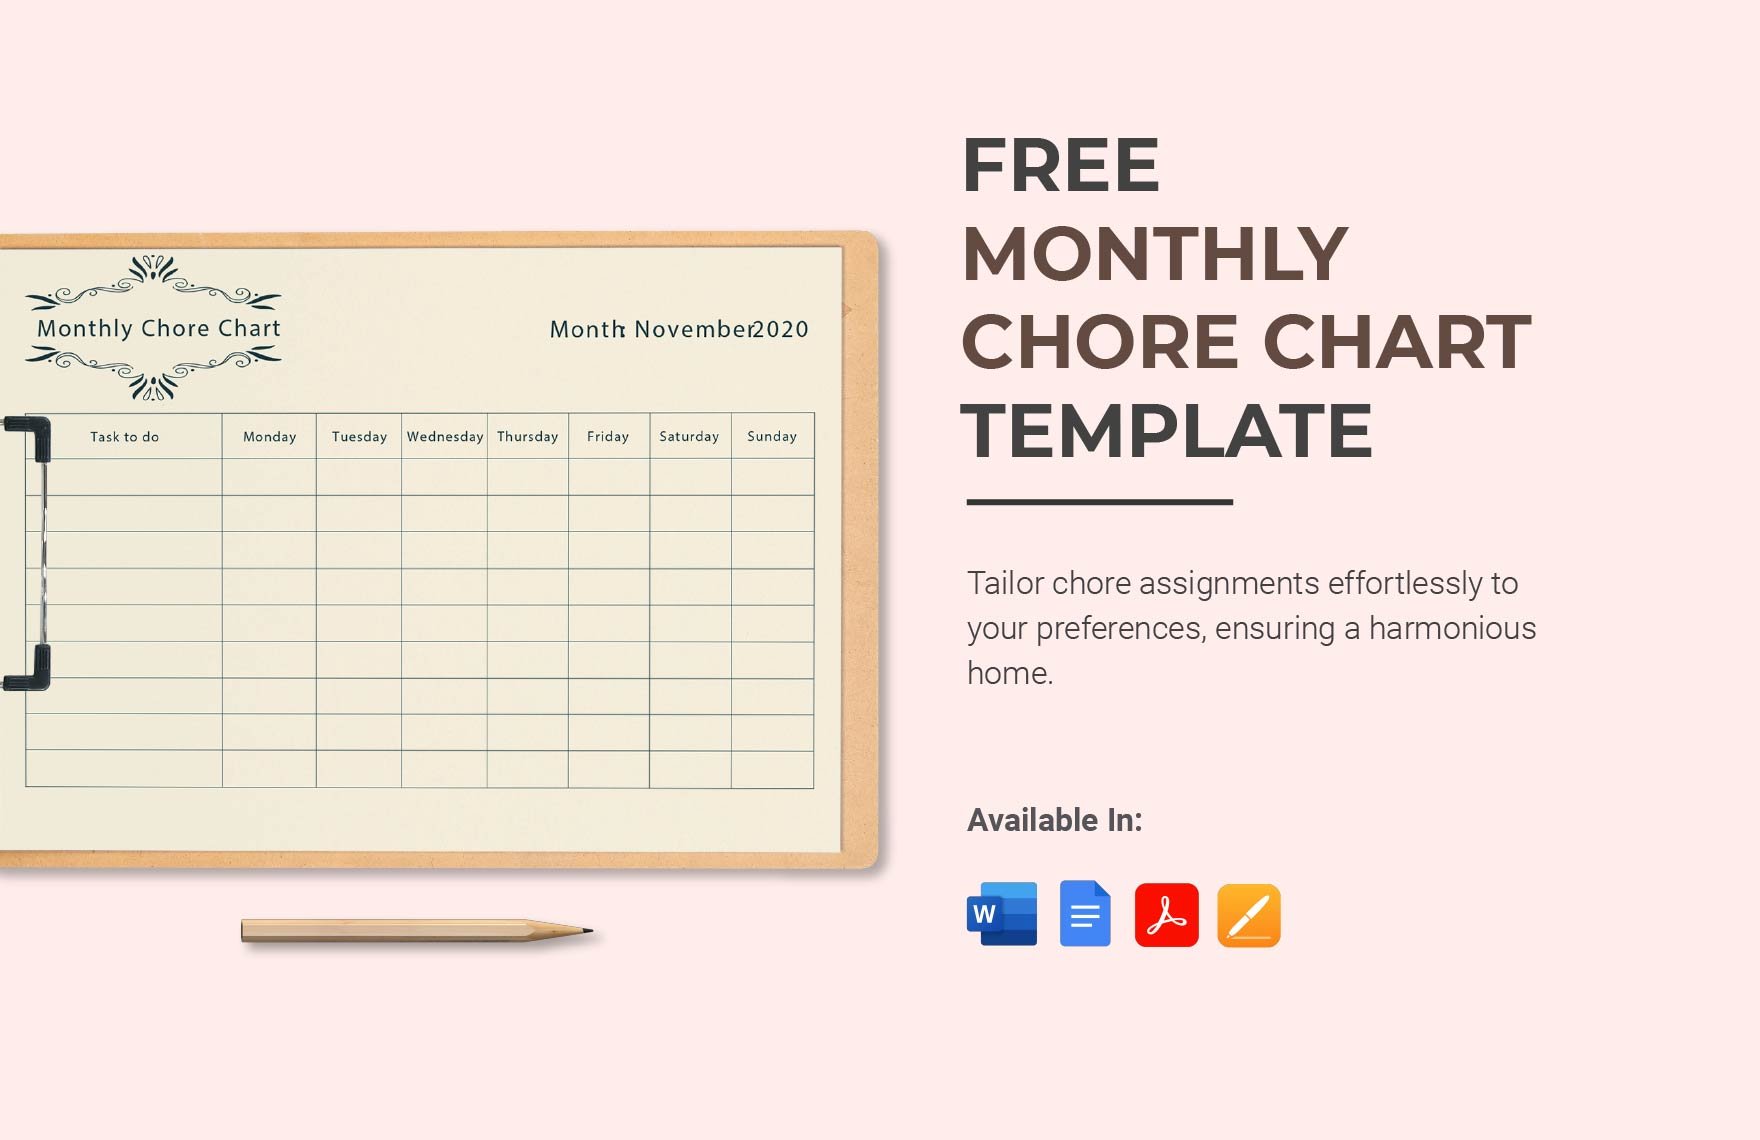
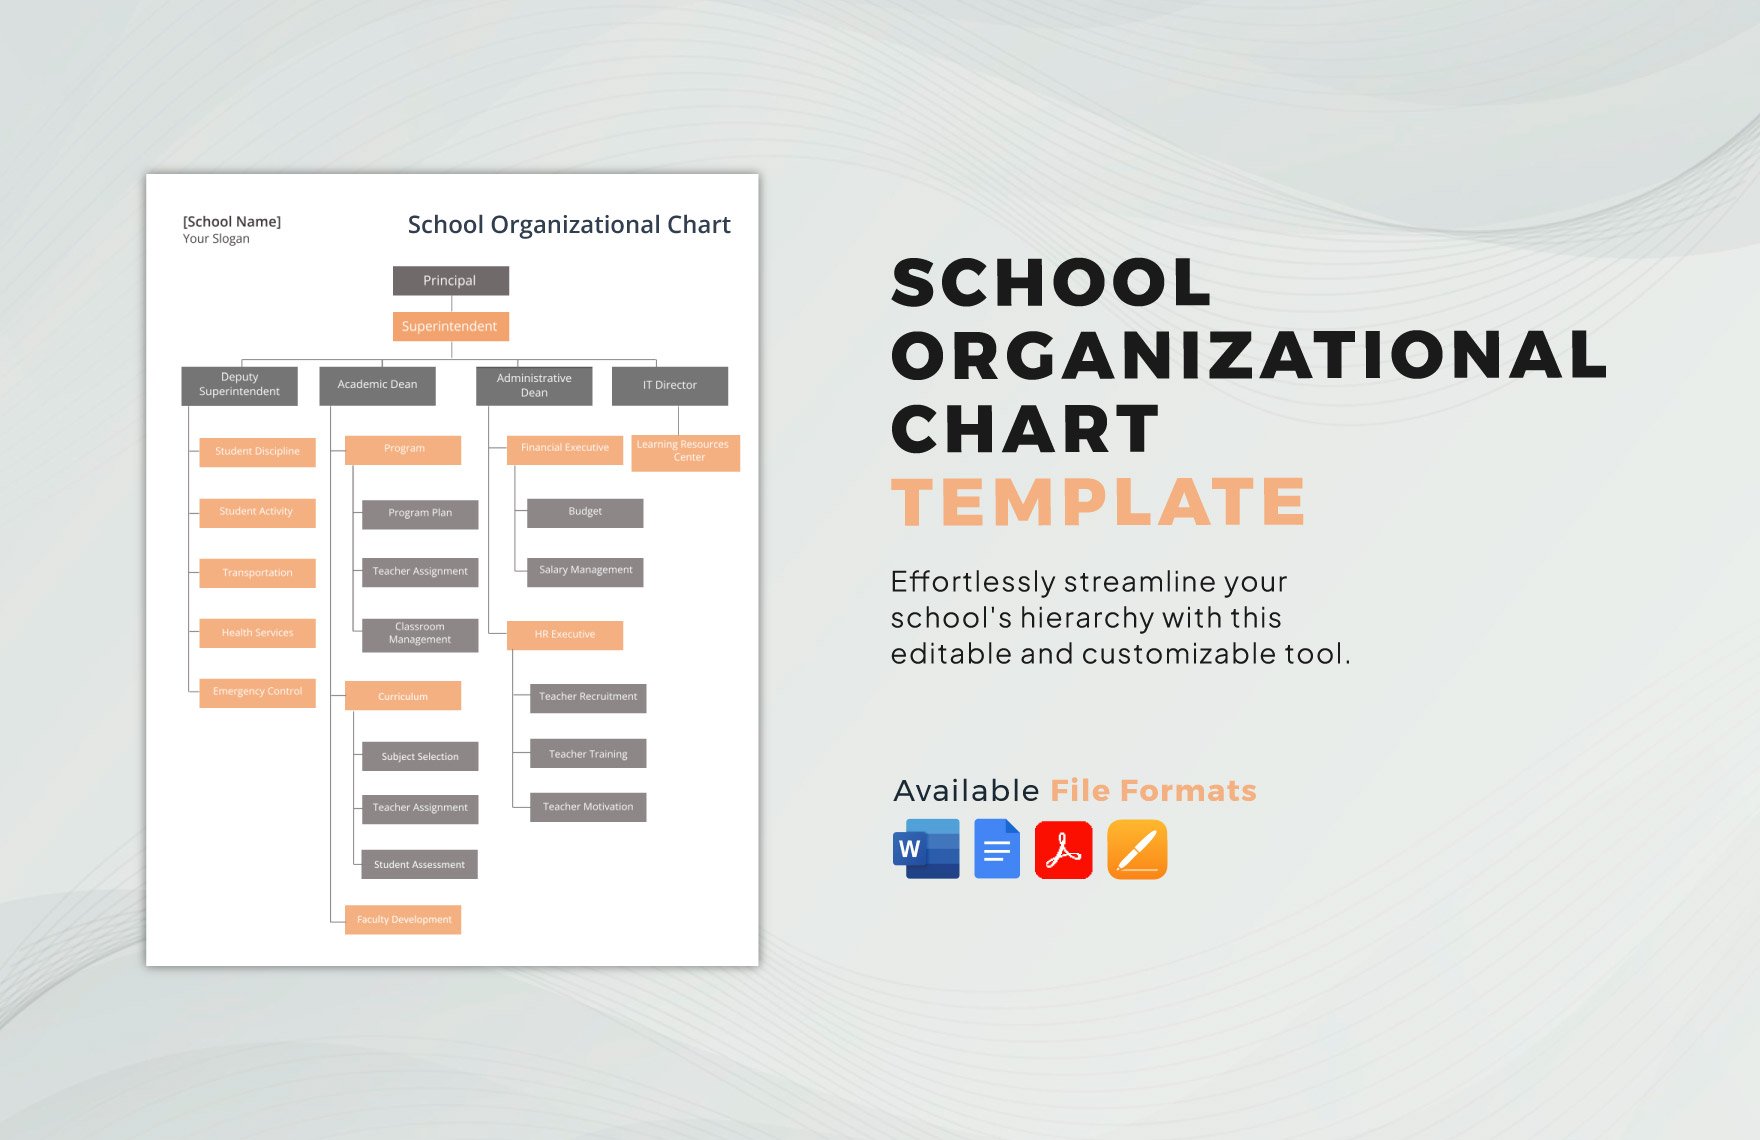
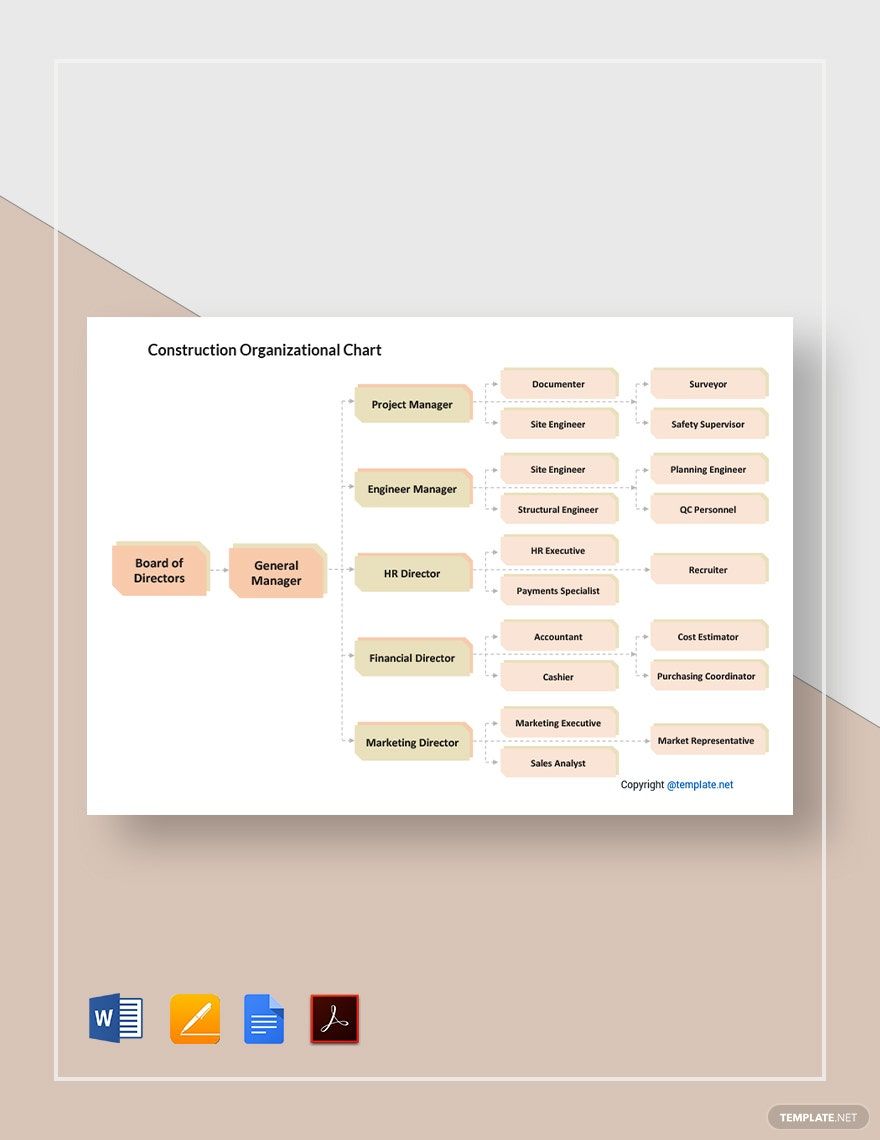
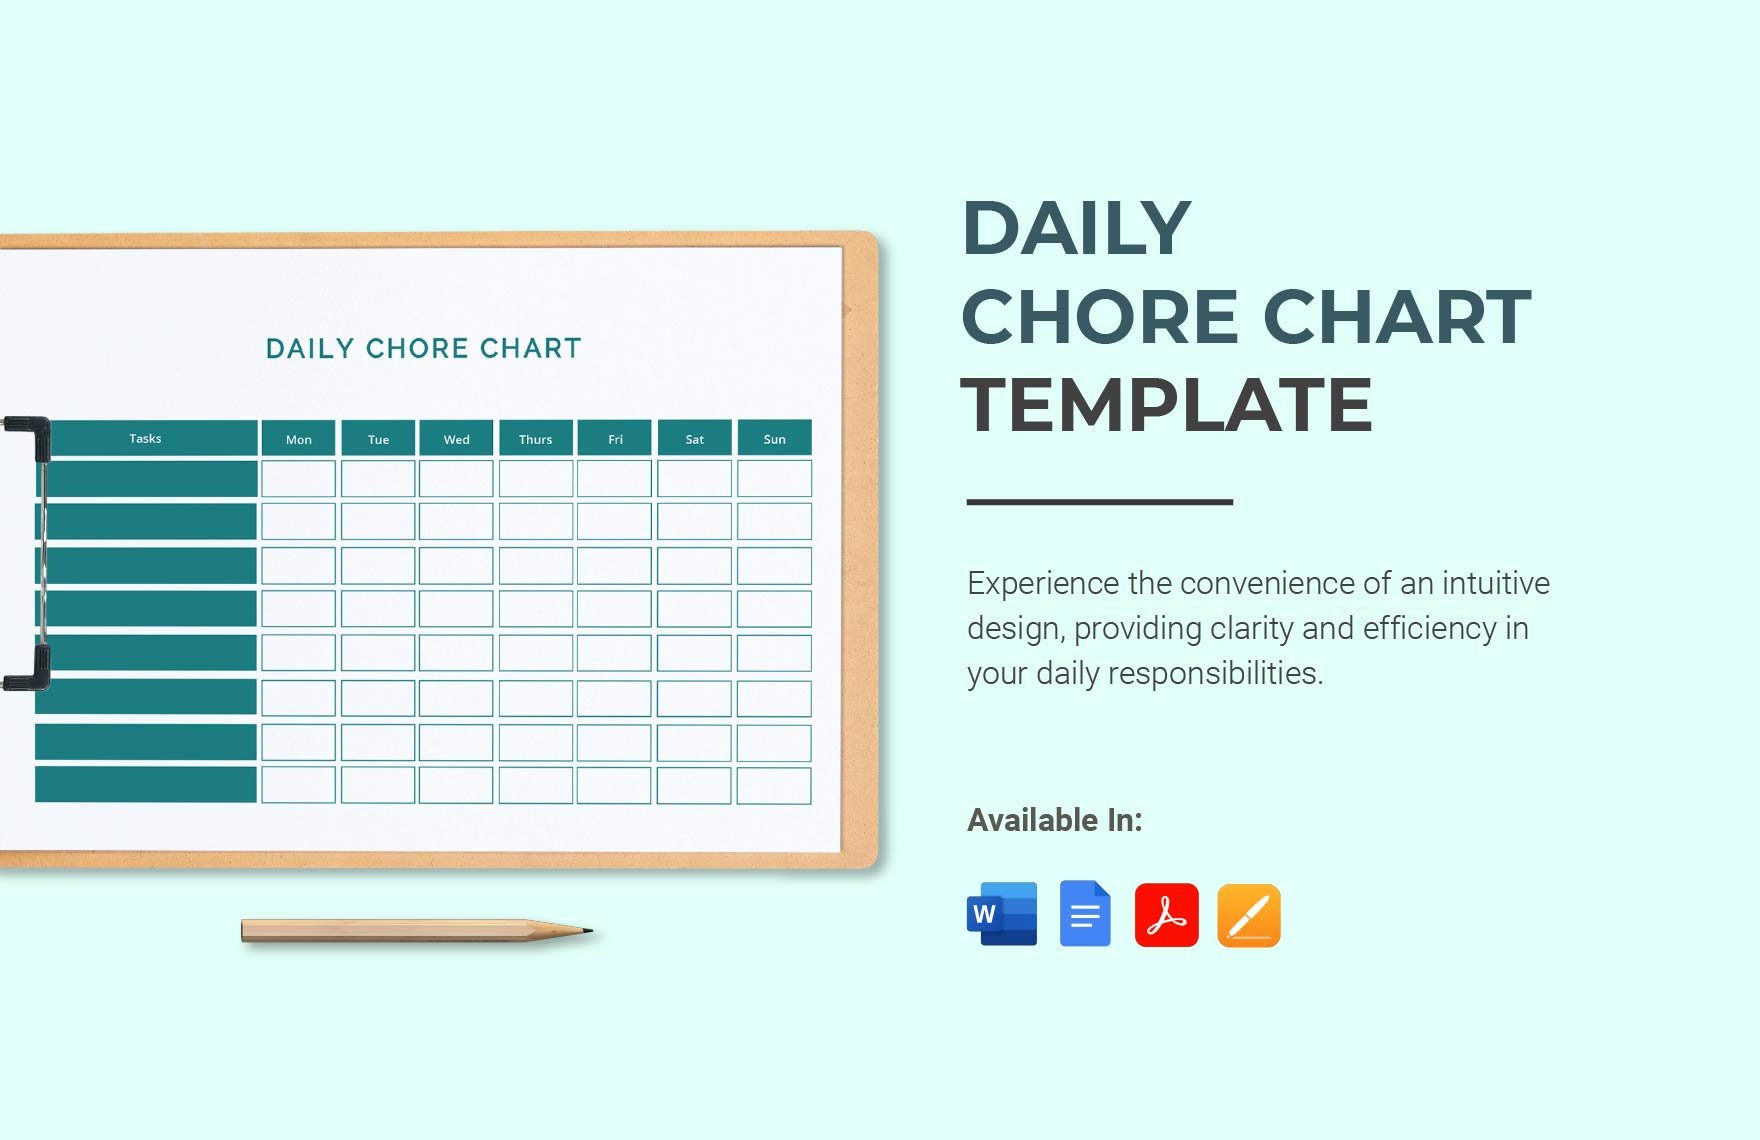
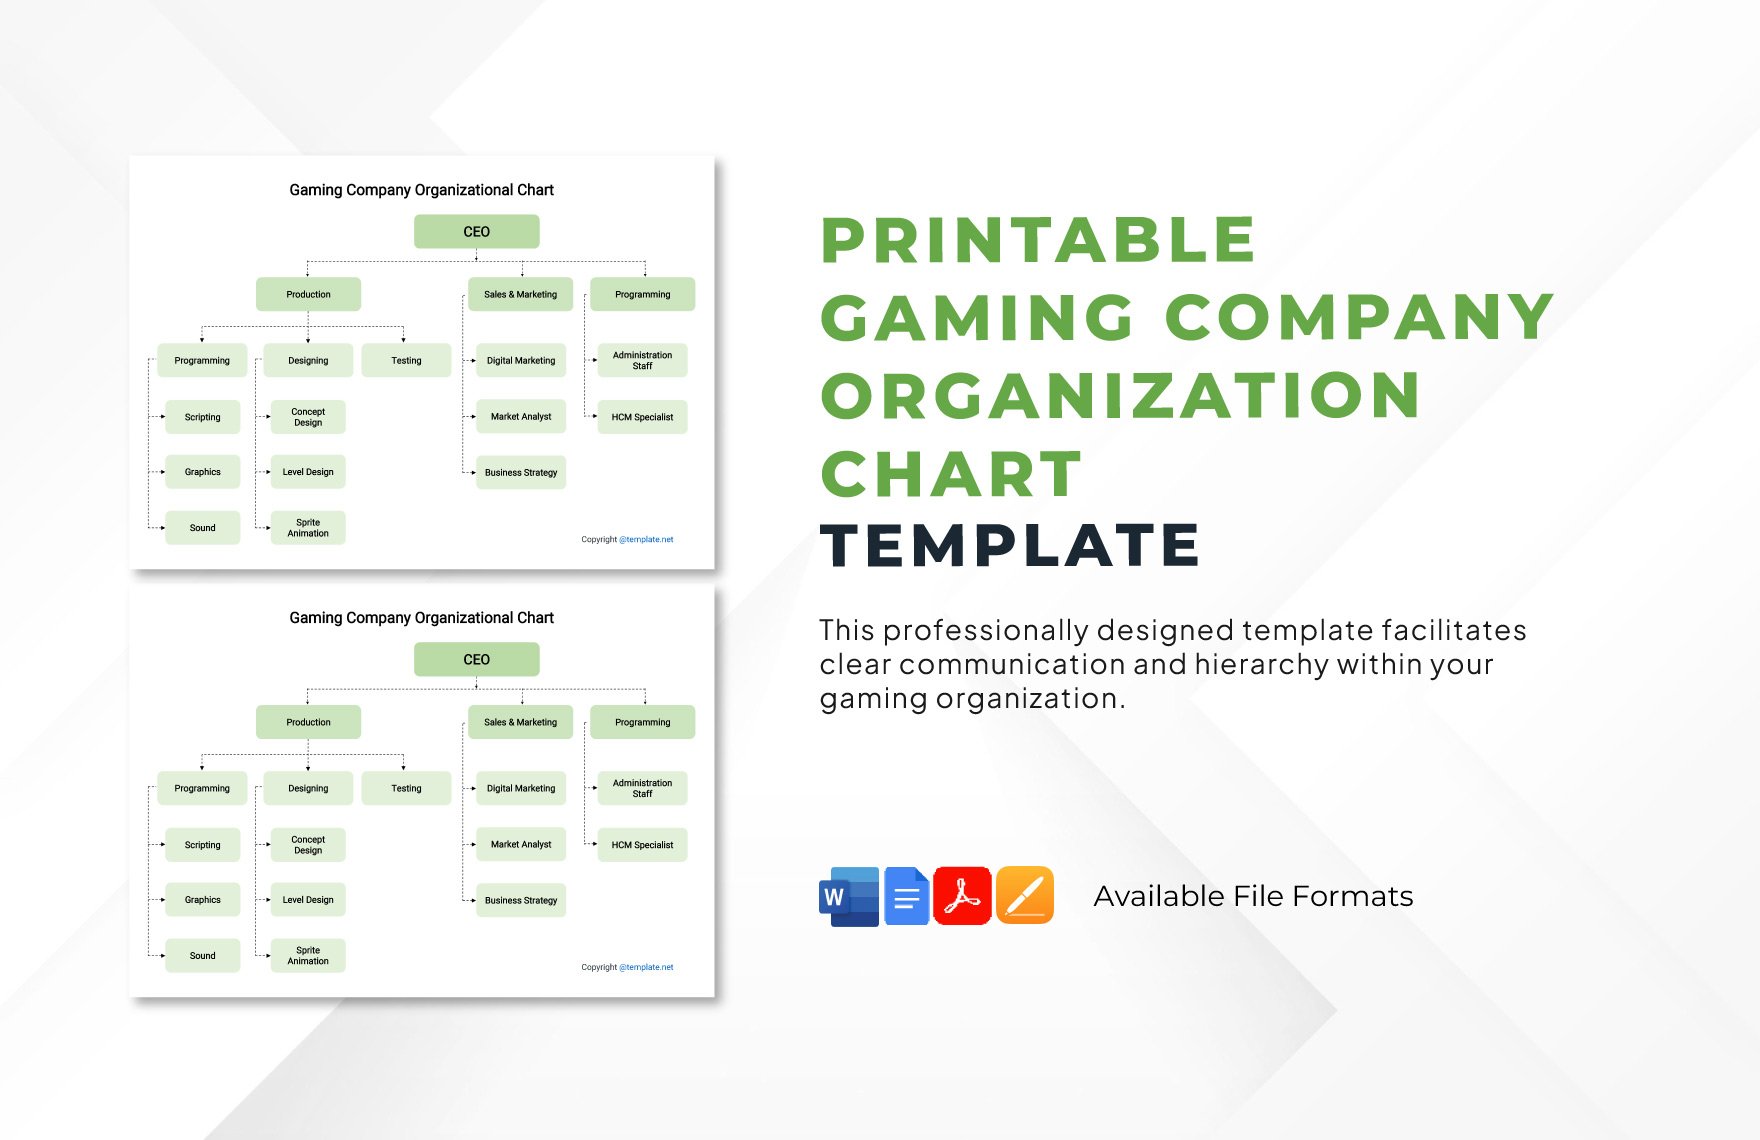
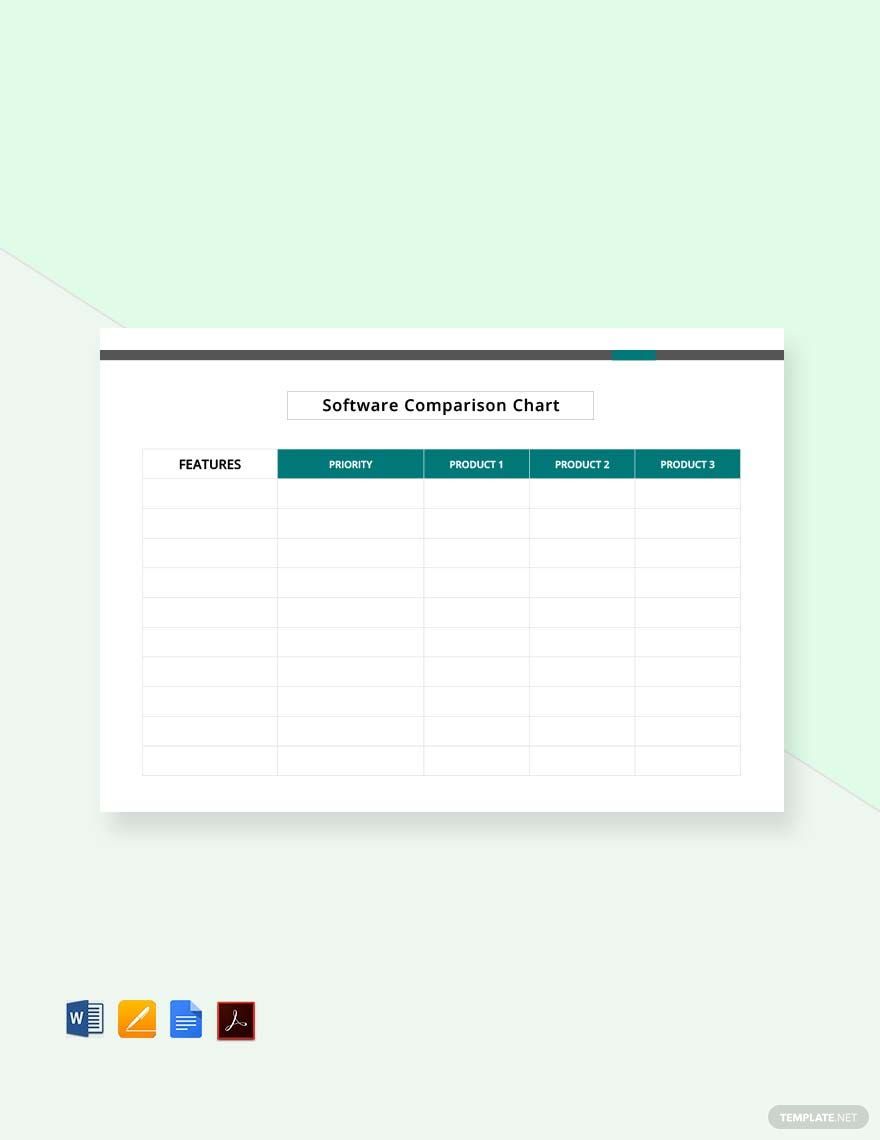
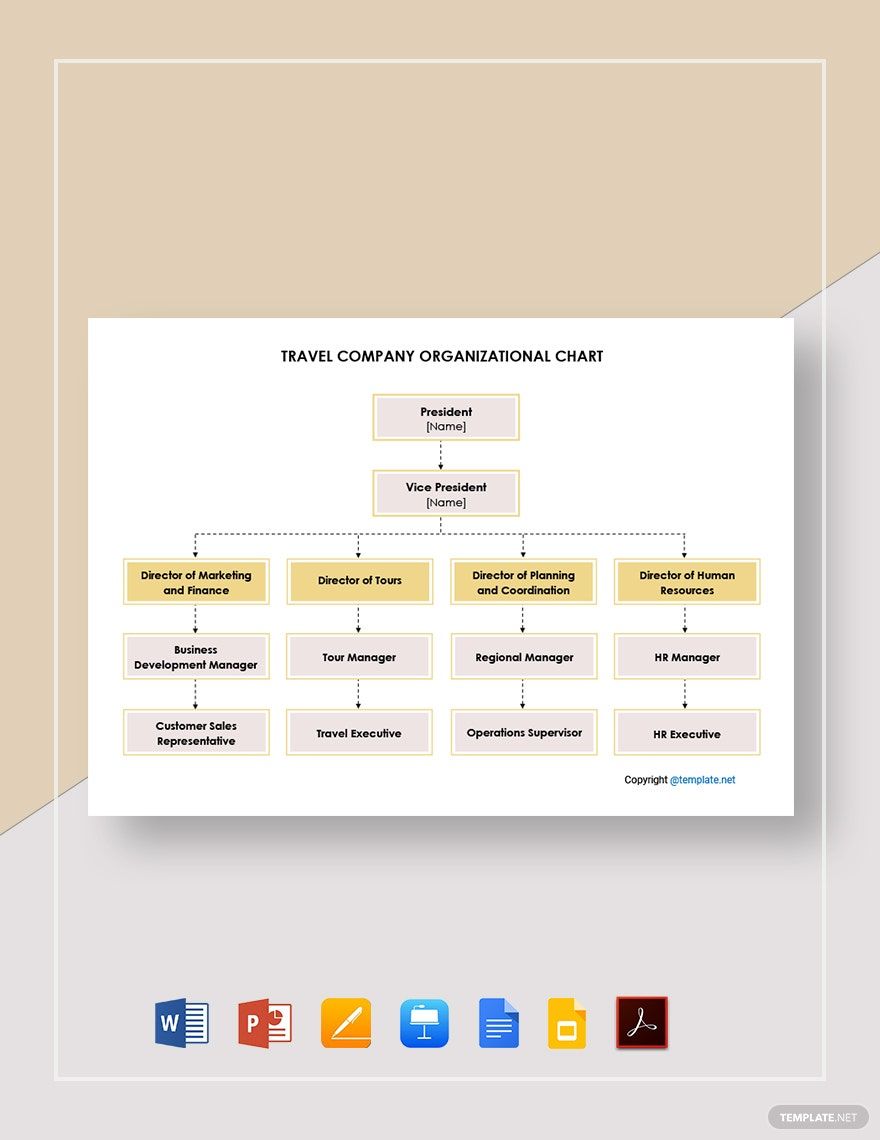
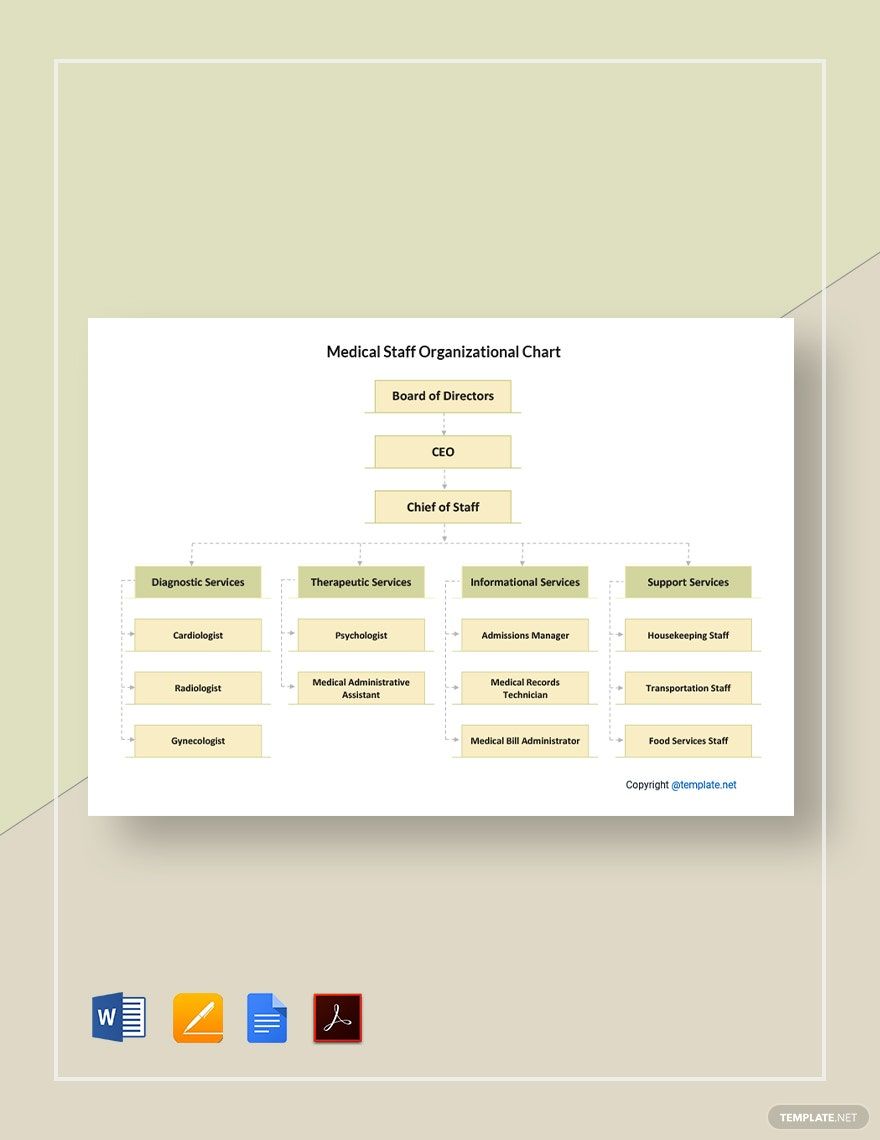
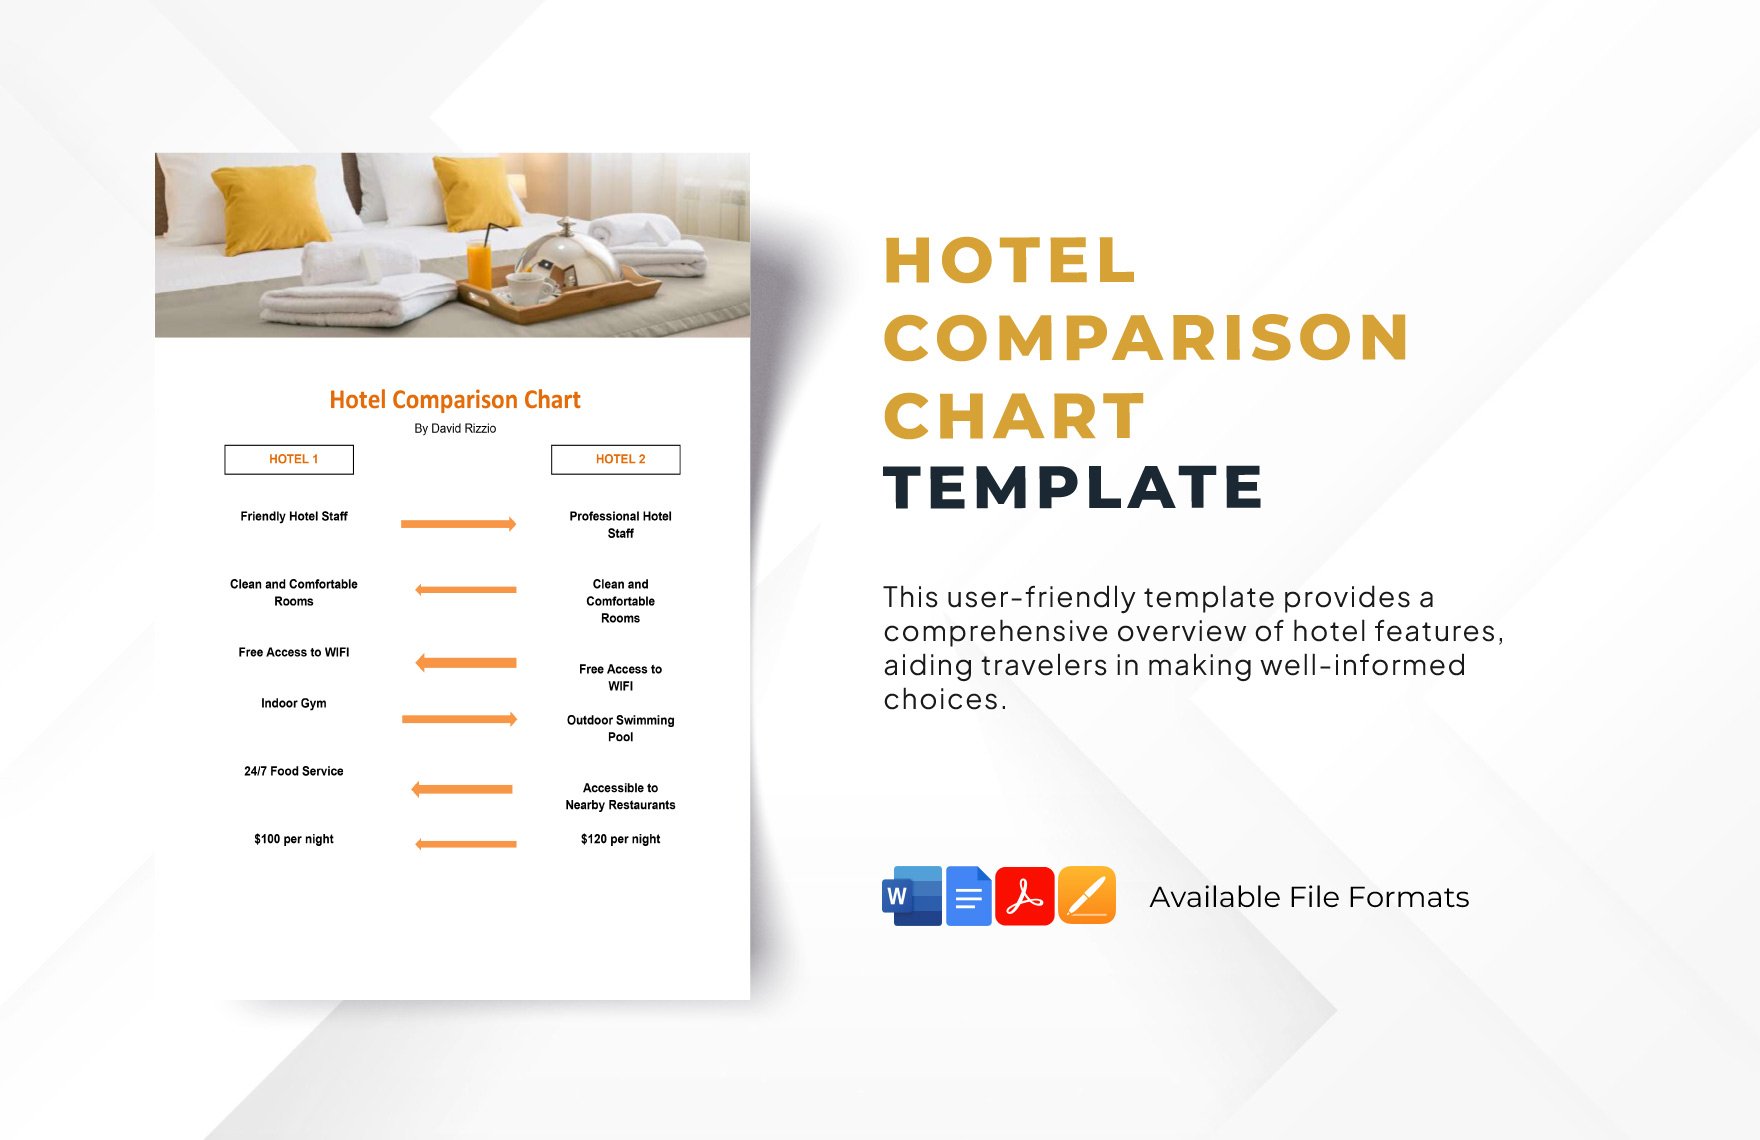
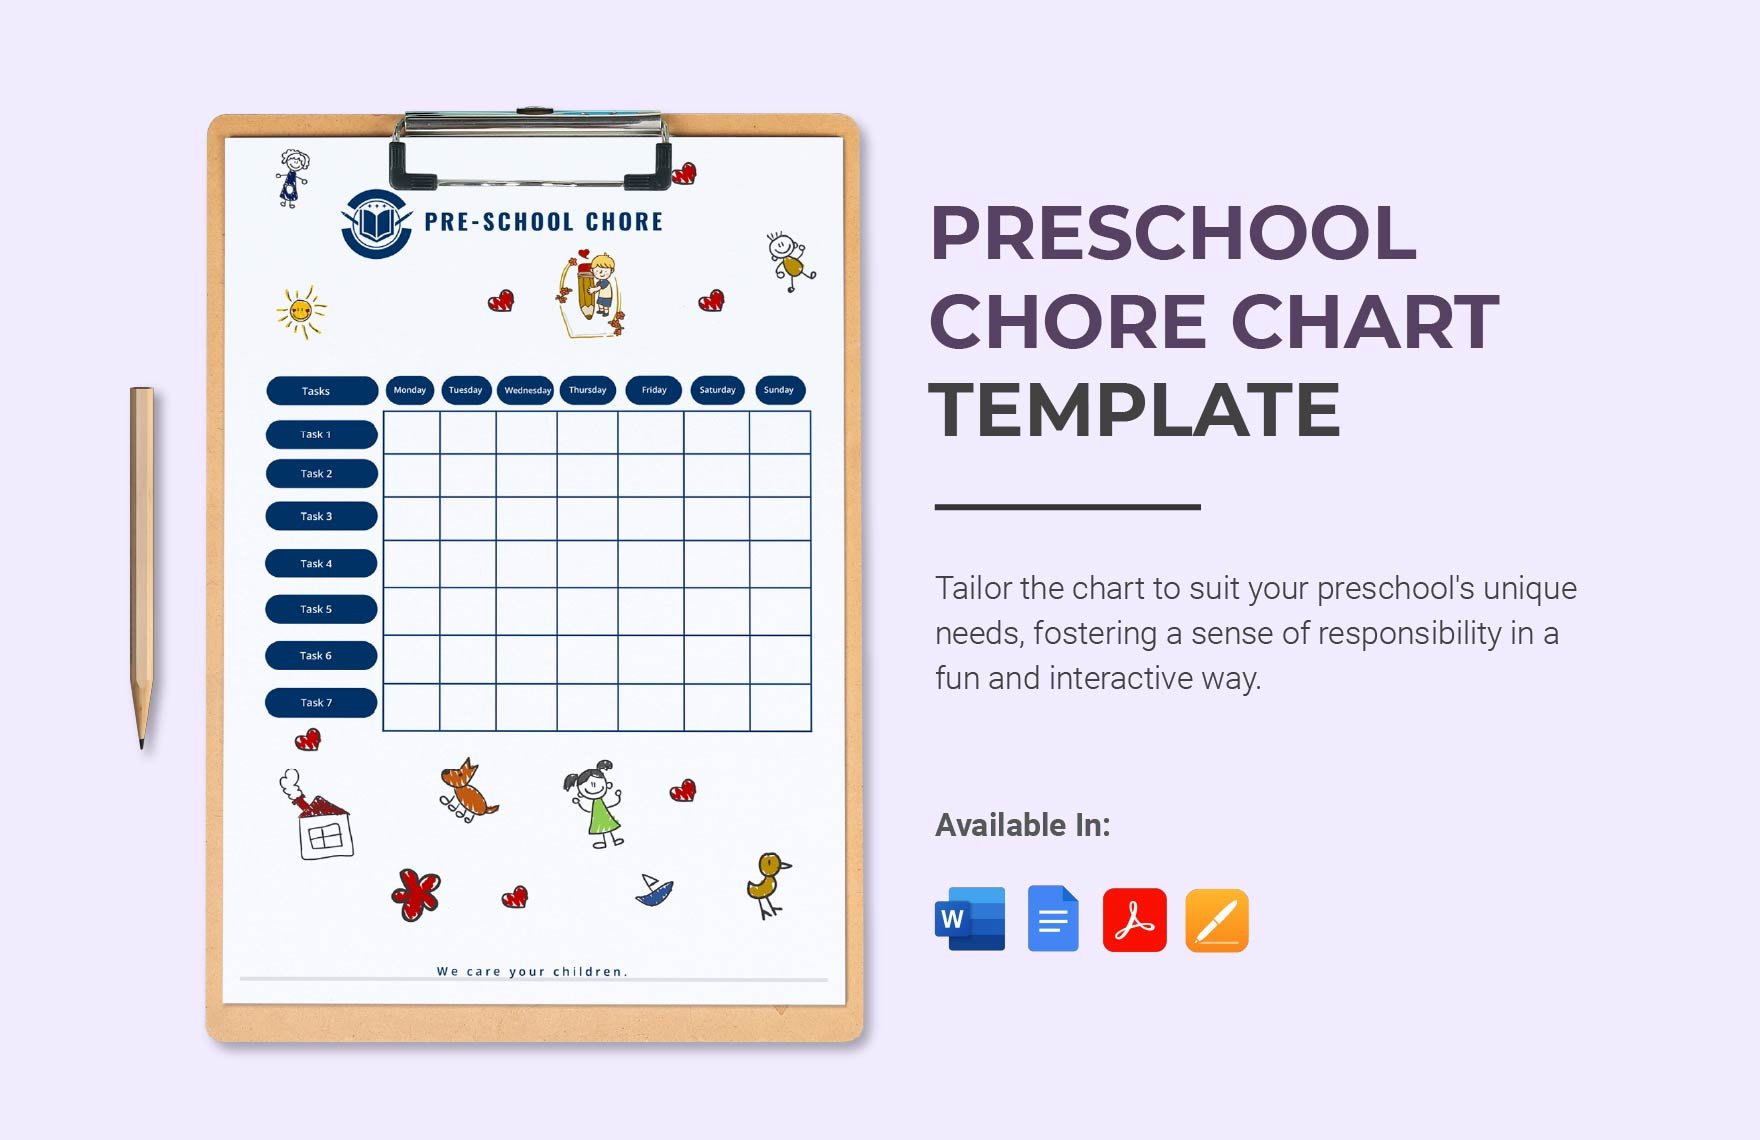
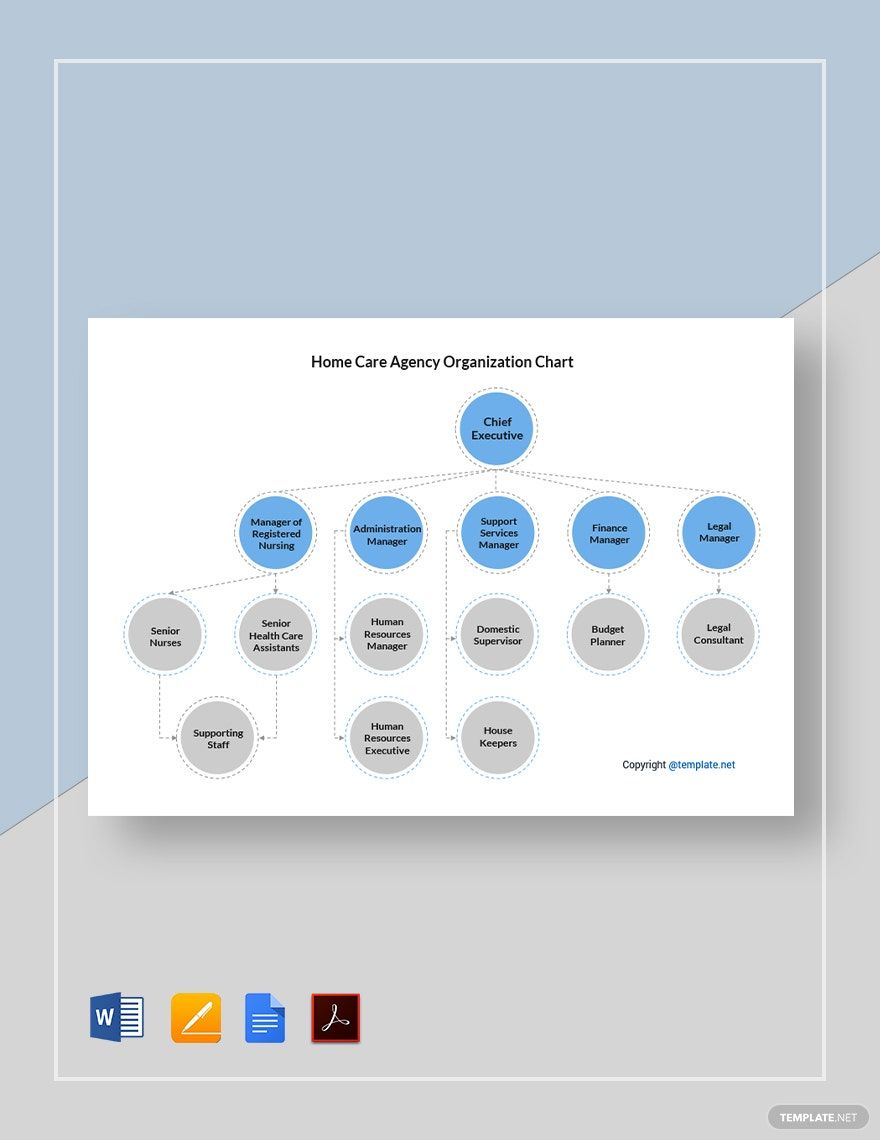
It is understood that starting from scratch will take time. That is why we offer you chart templates that you can choose whatever type of chart you will be making. Things will be convenient because our templates have an eyecatching title with suggestive content and easy to change colors. Our templates are fillable, so all you need to do is to input the data you want to include. We have a variety of templates that you can download like seating chart, timeline chart, chore chart, organizational chart, comparison chart templates, and many more.
5. Graph The Data
Since you are done following the steps listed above, you can now fill in the data to the chart. Use fonts that suit for the chart and are readable for the audience even when presented using powerpoint. For easy editing, it will be better if you use editable chart templates. After you are done, proofread to avoid grammar errors.


