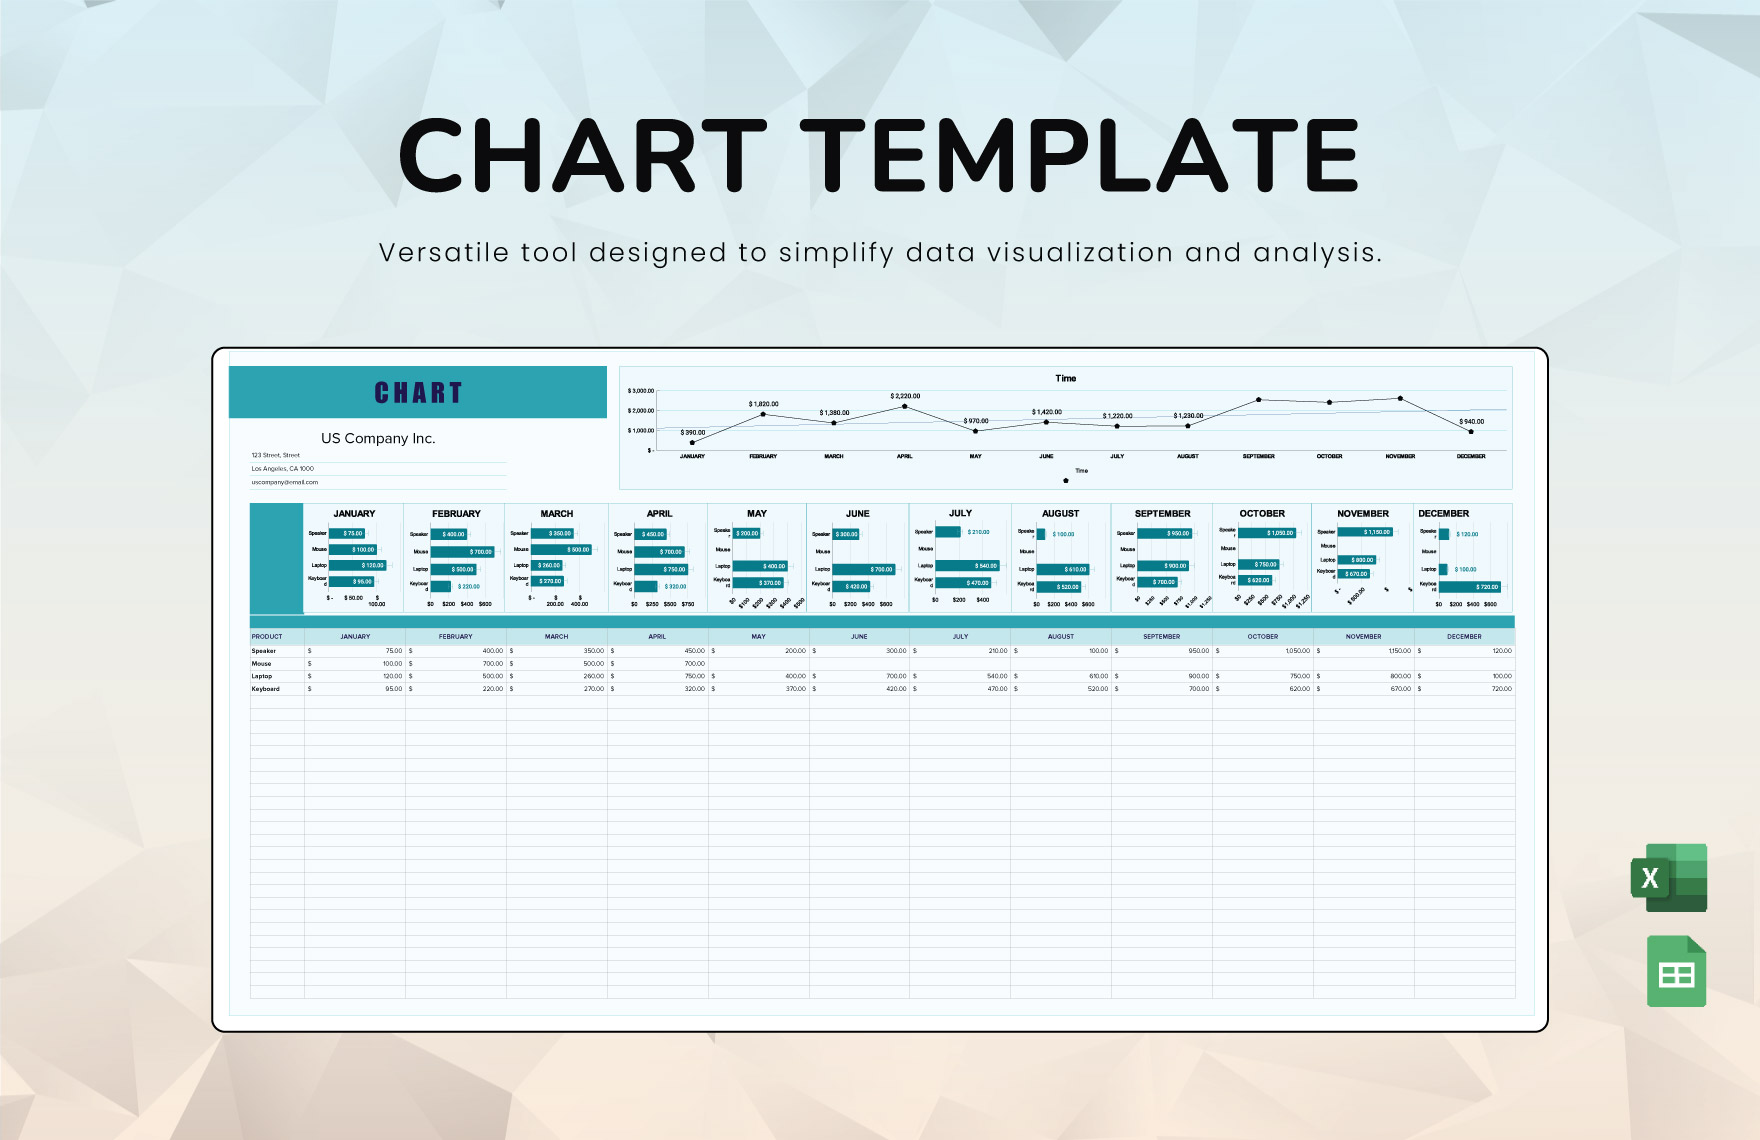
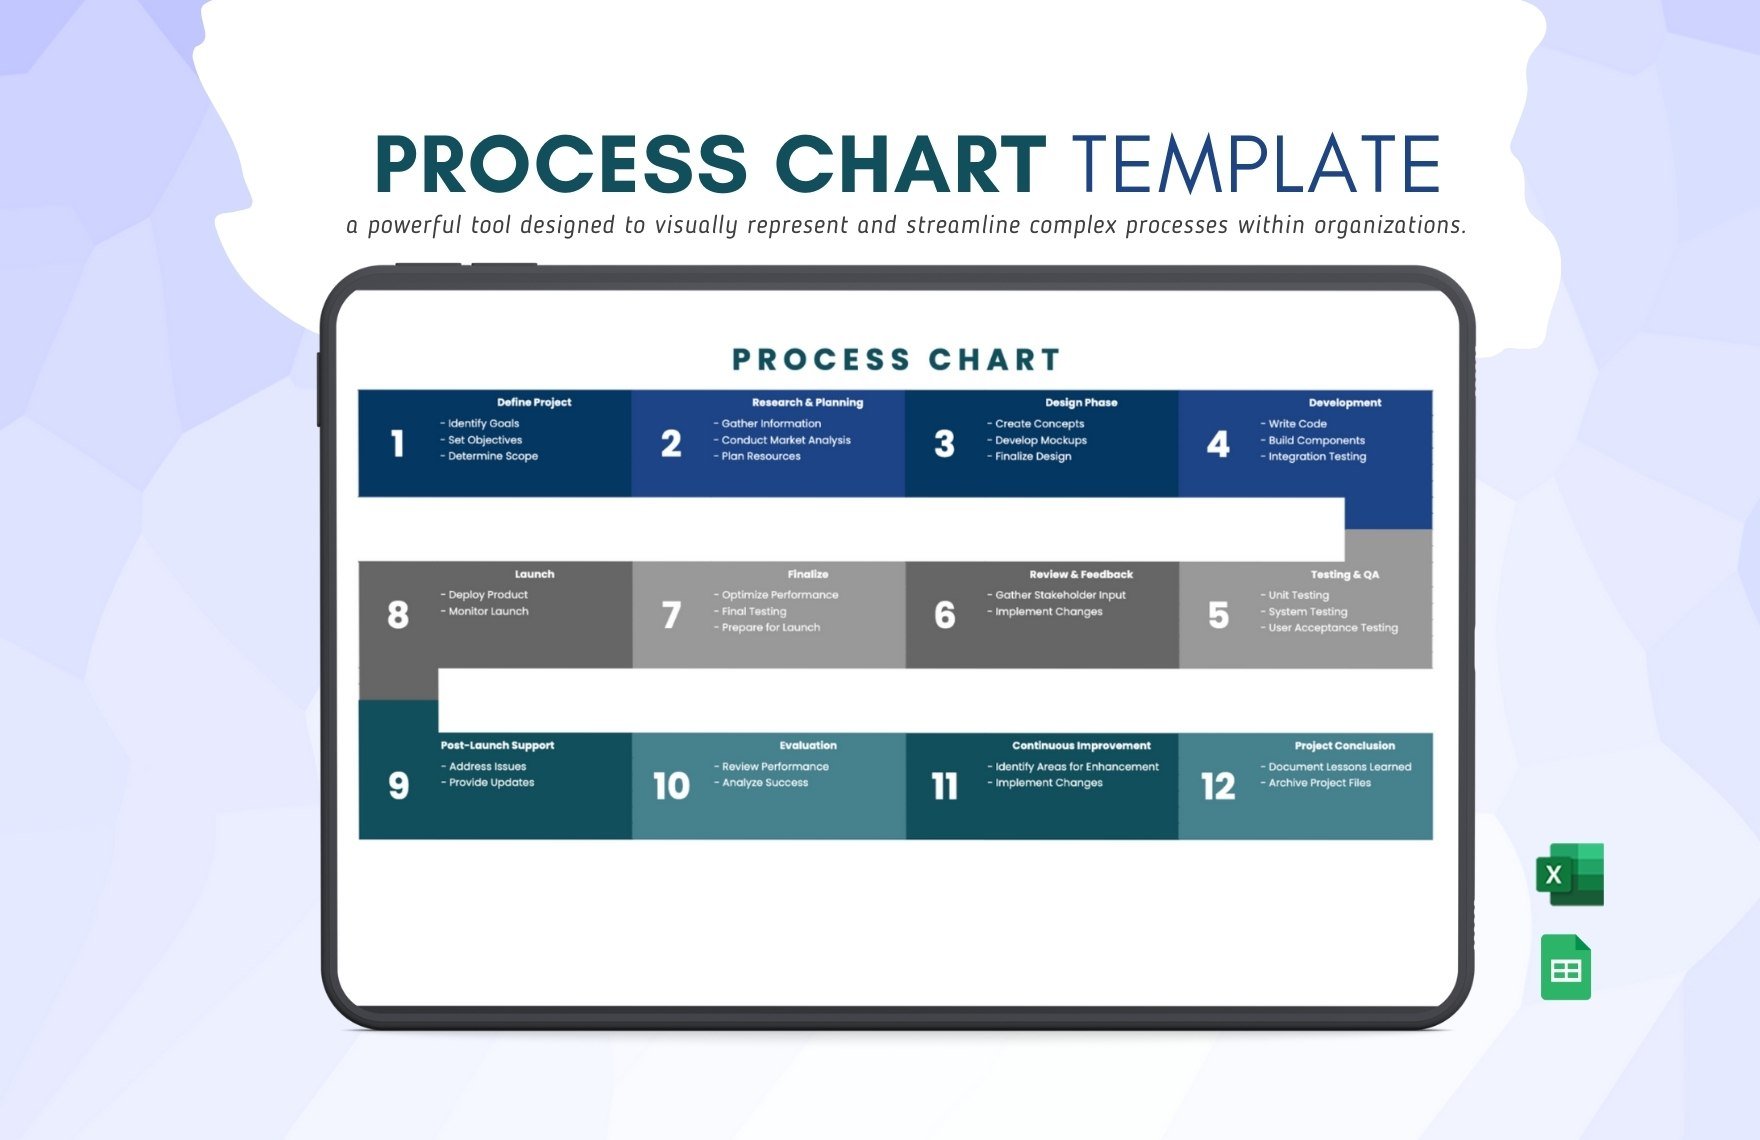
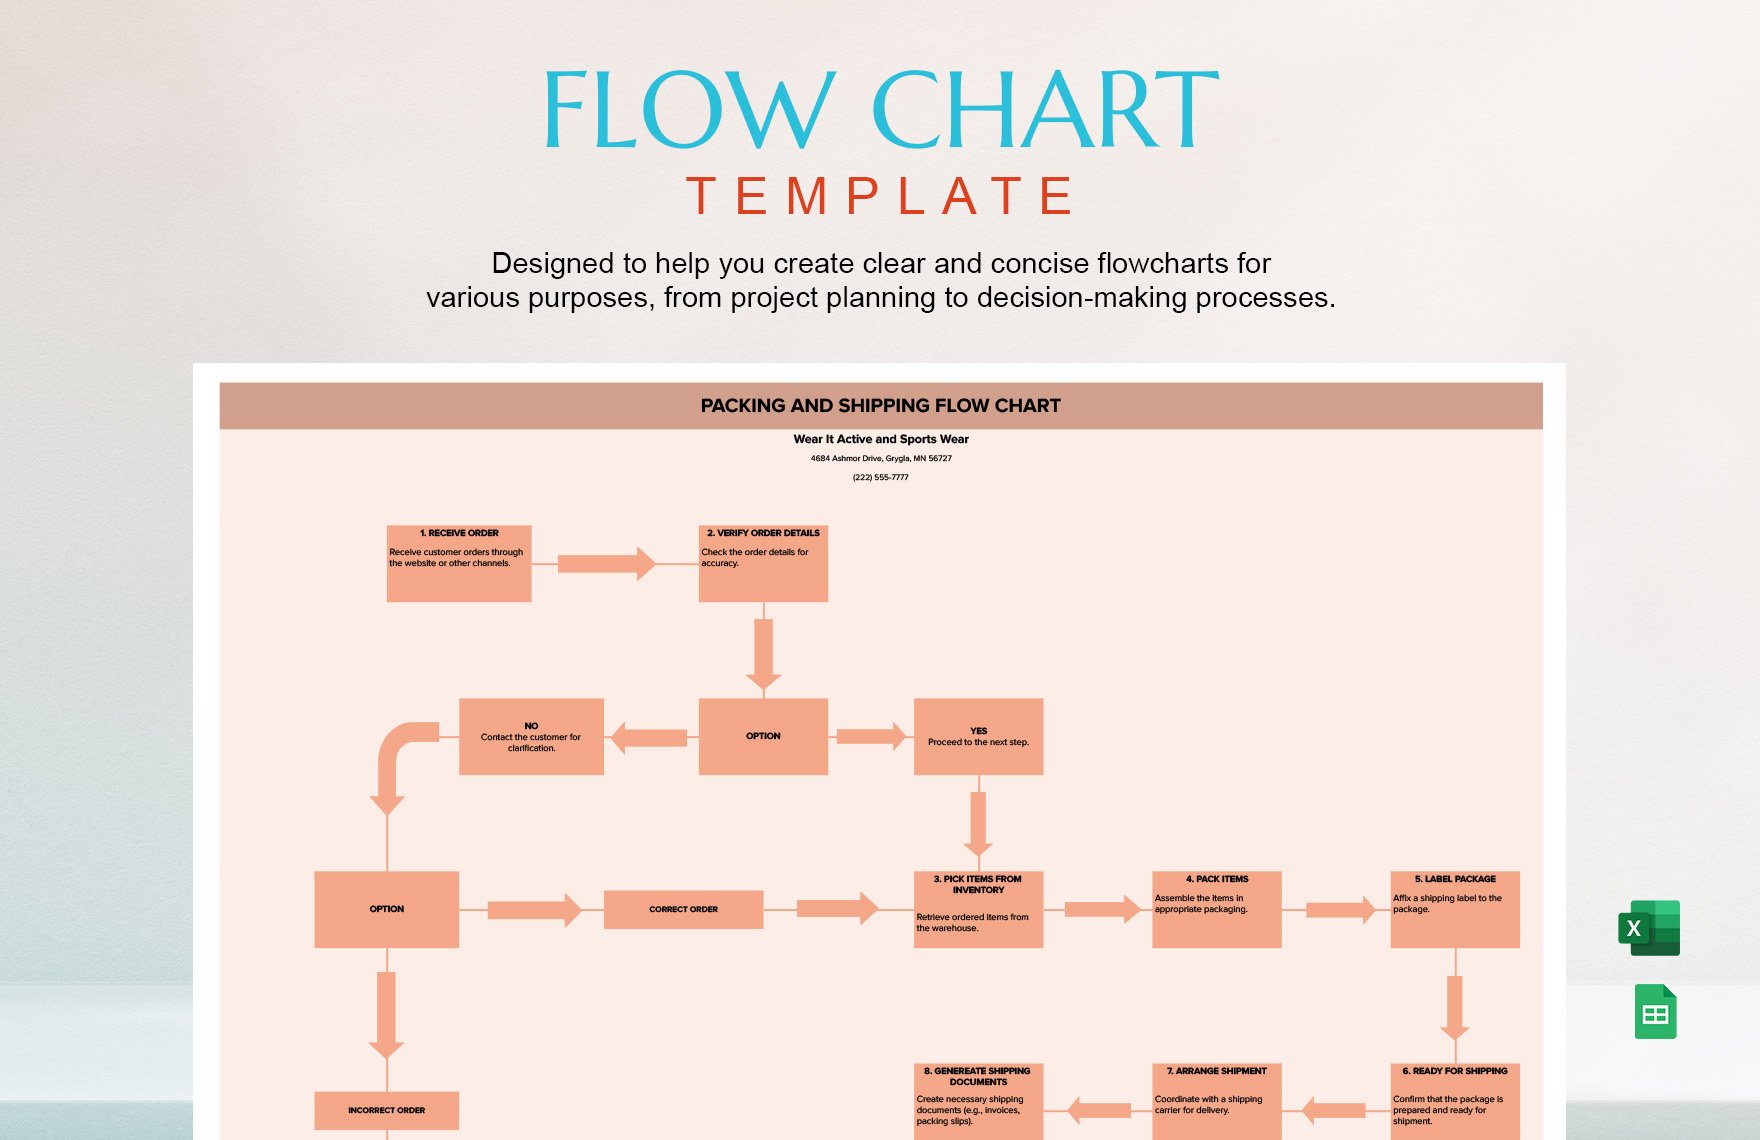
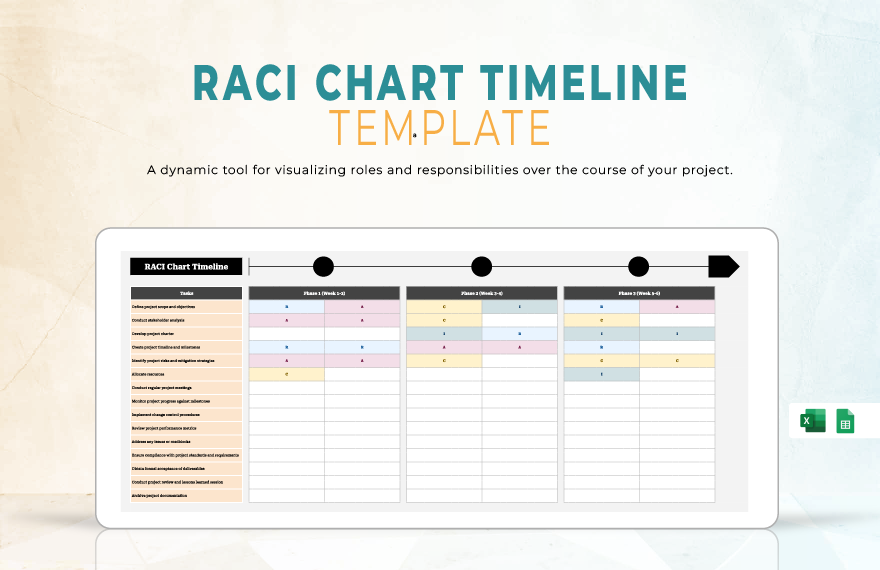
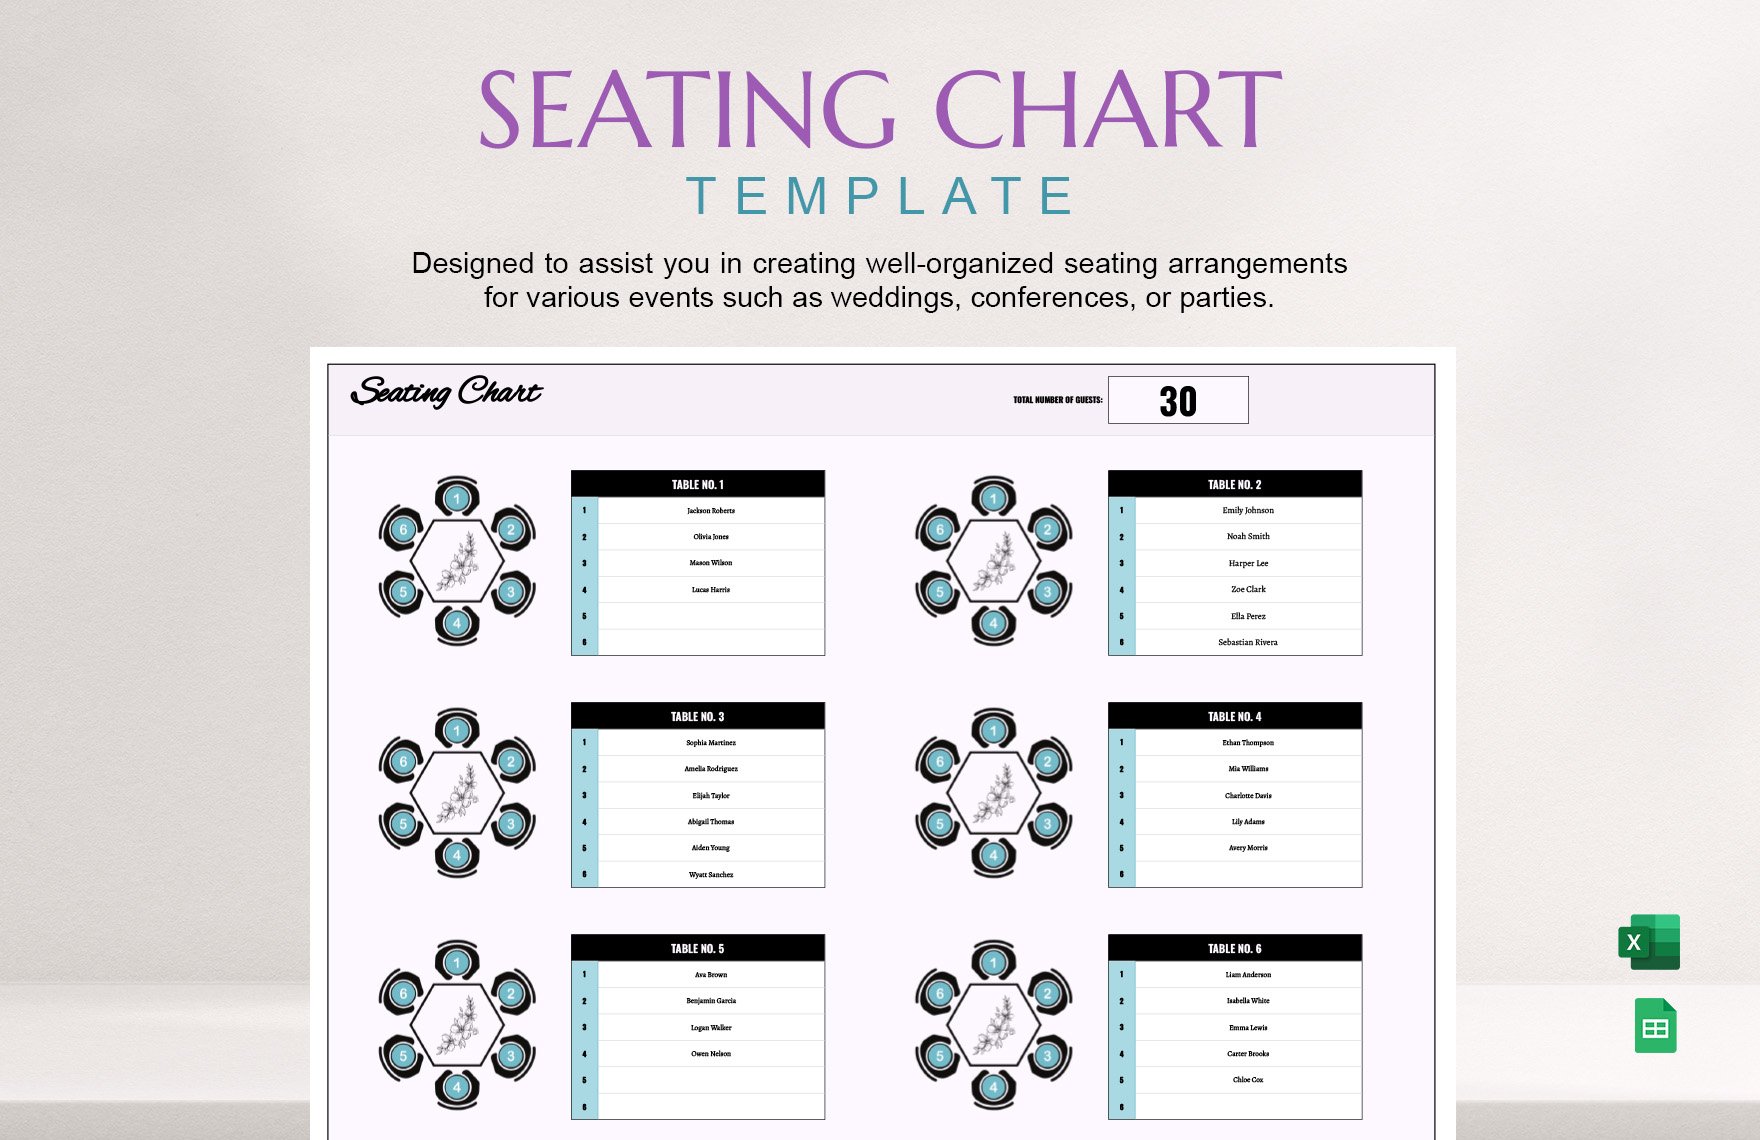
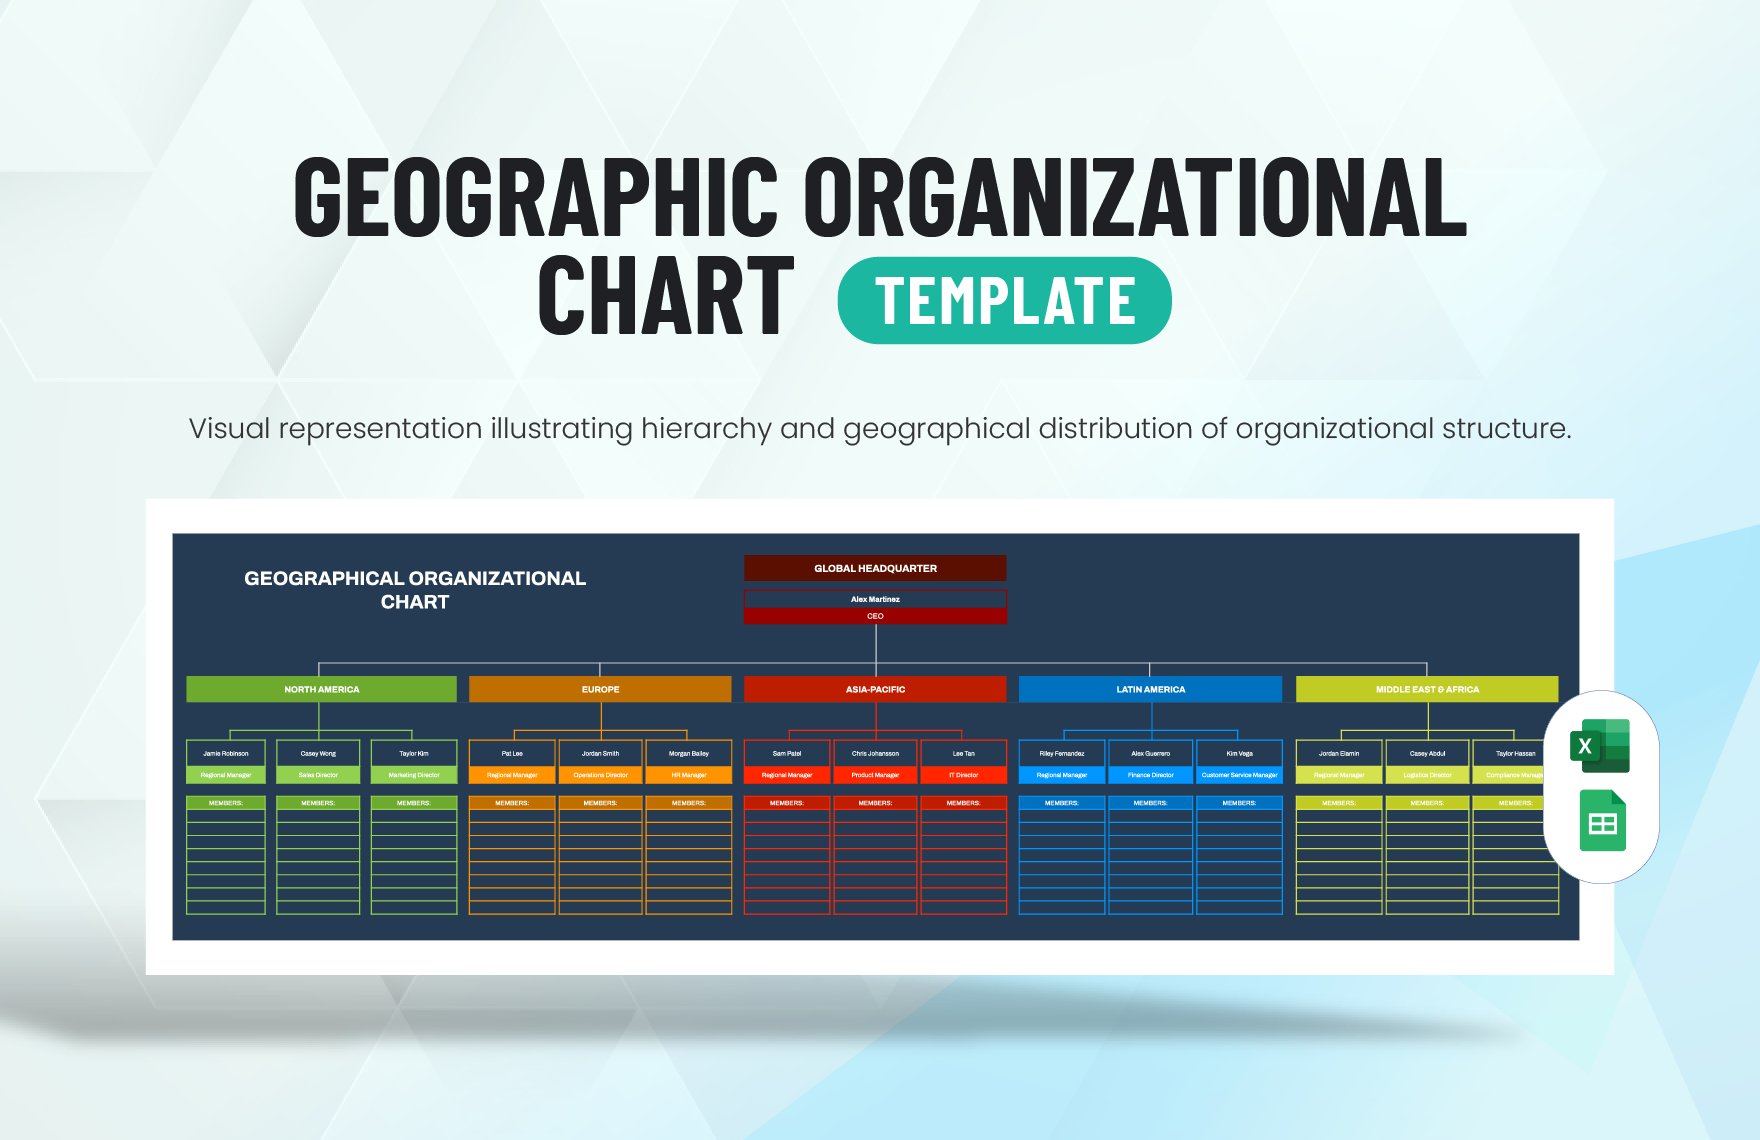
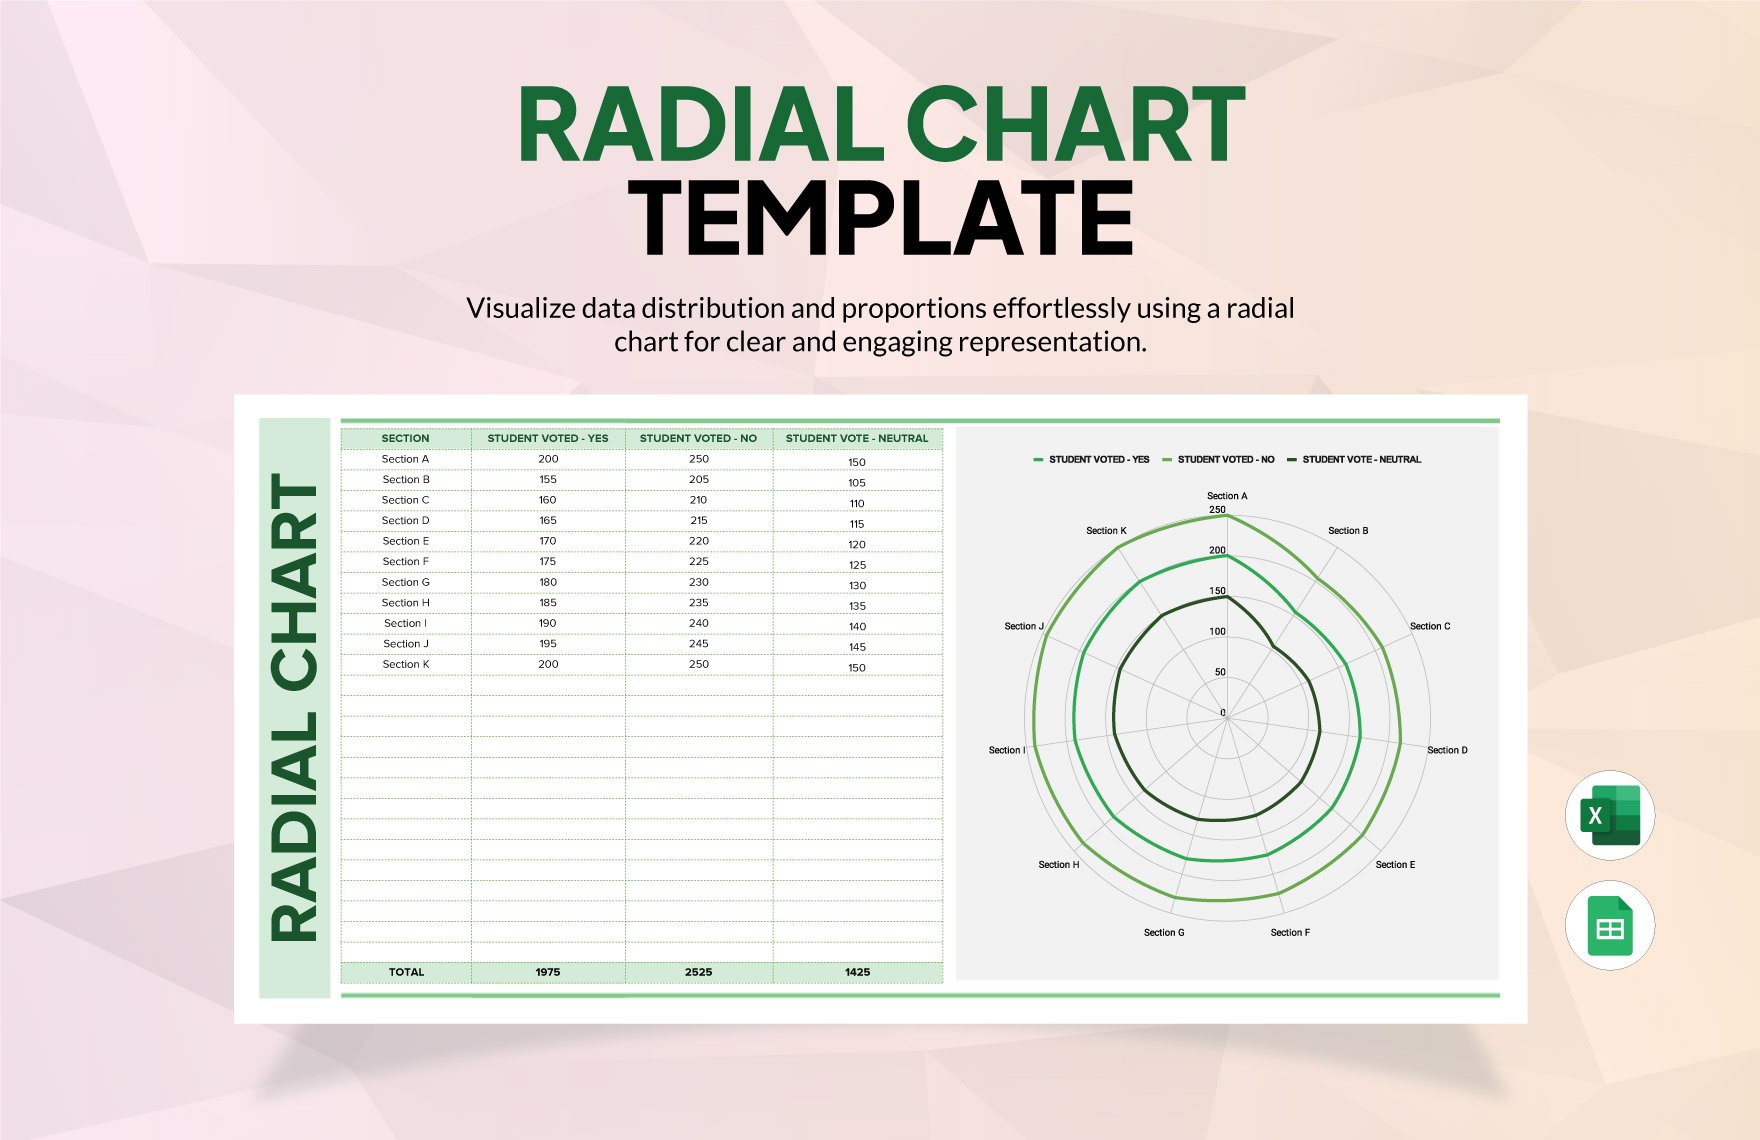
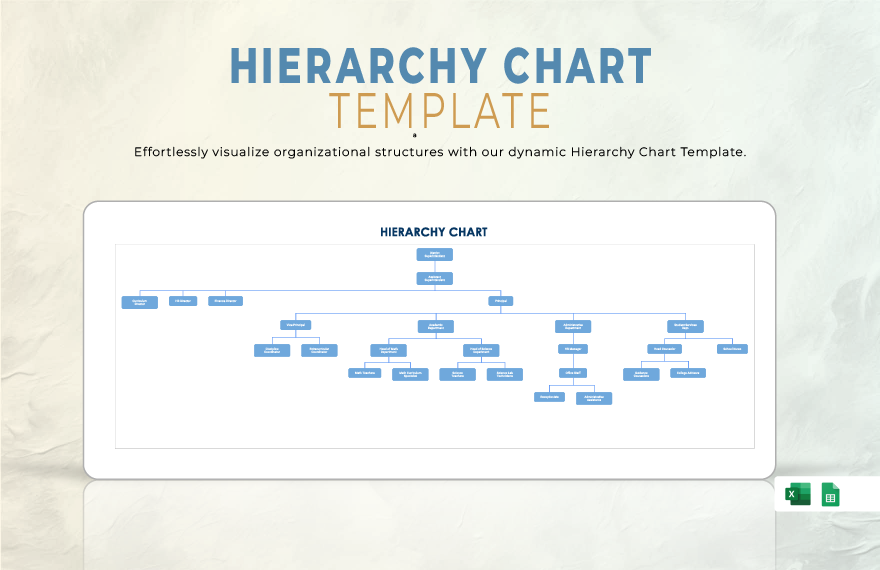
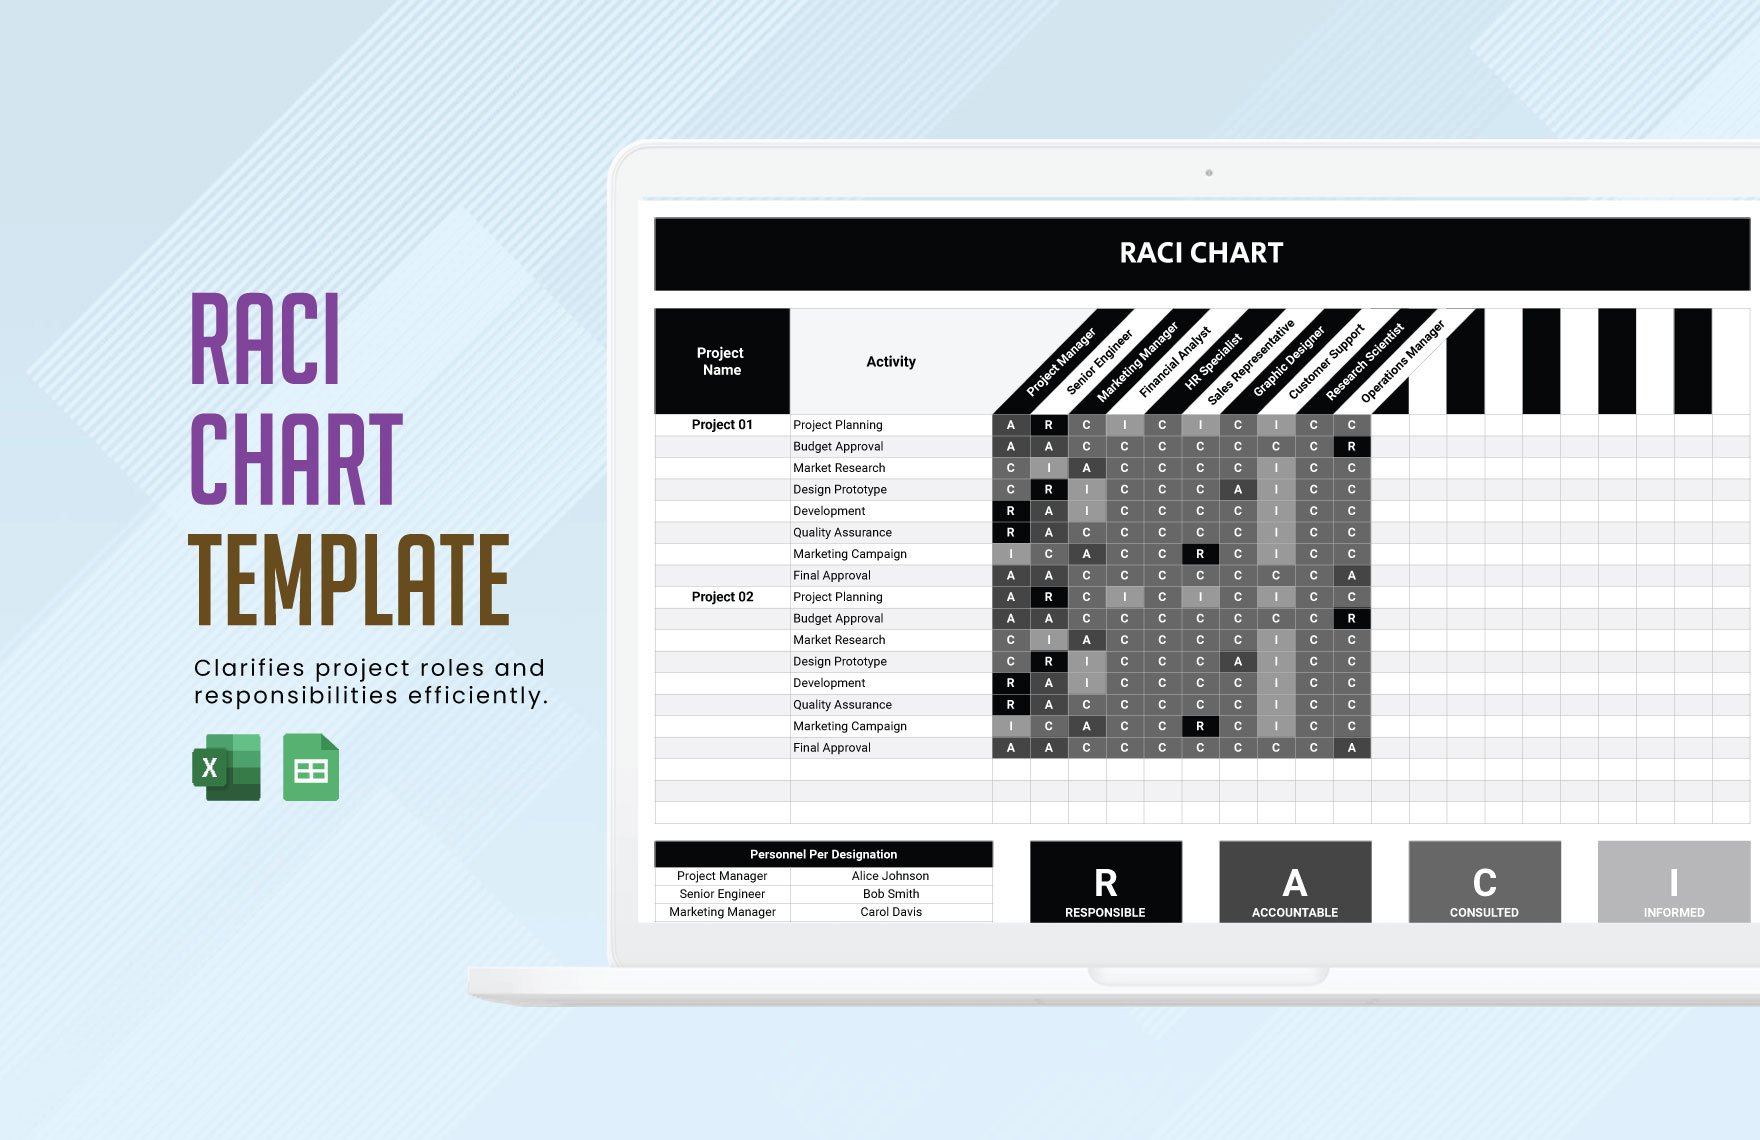
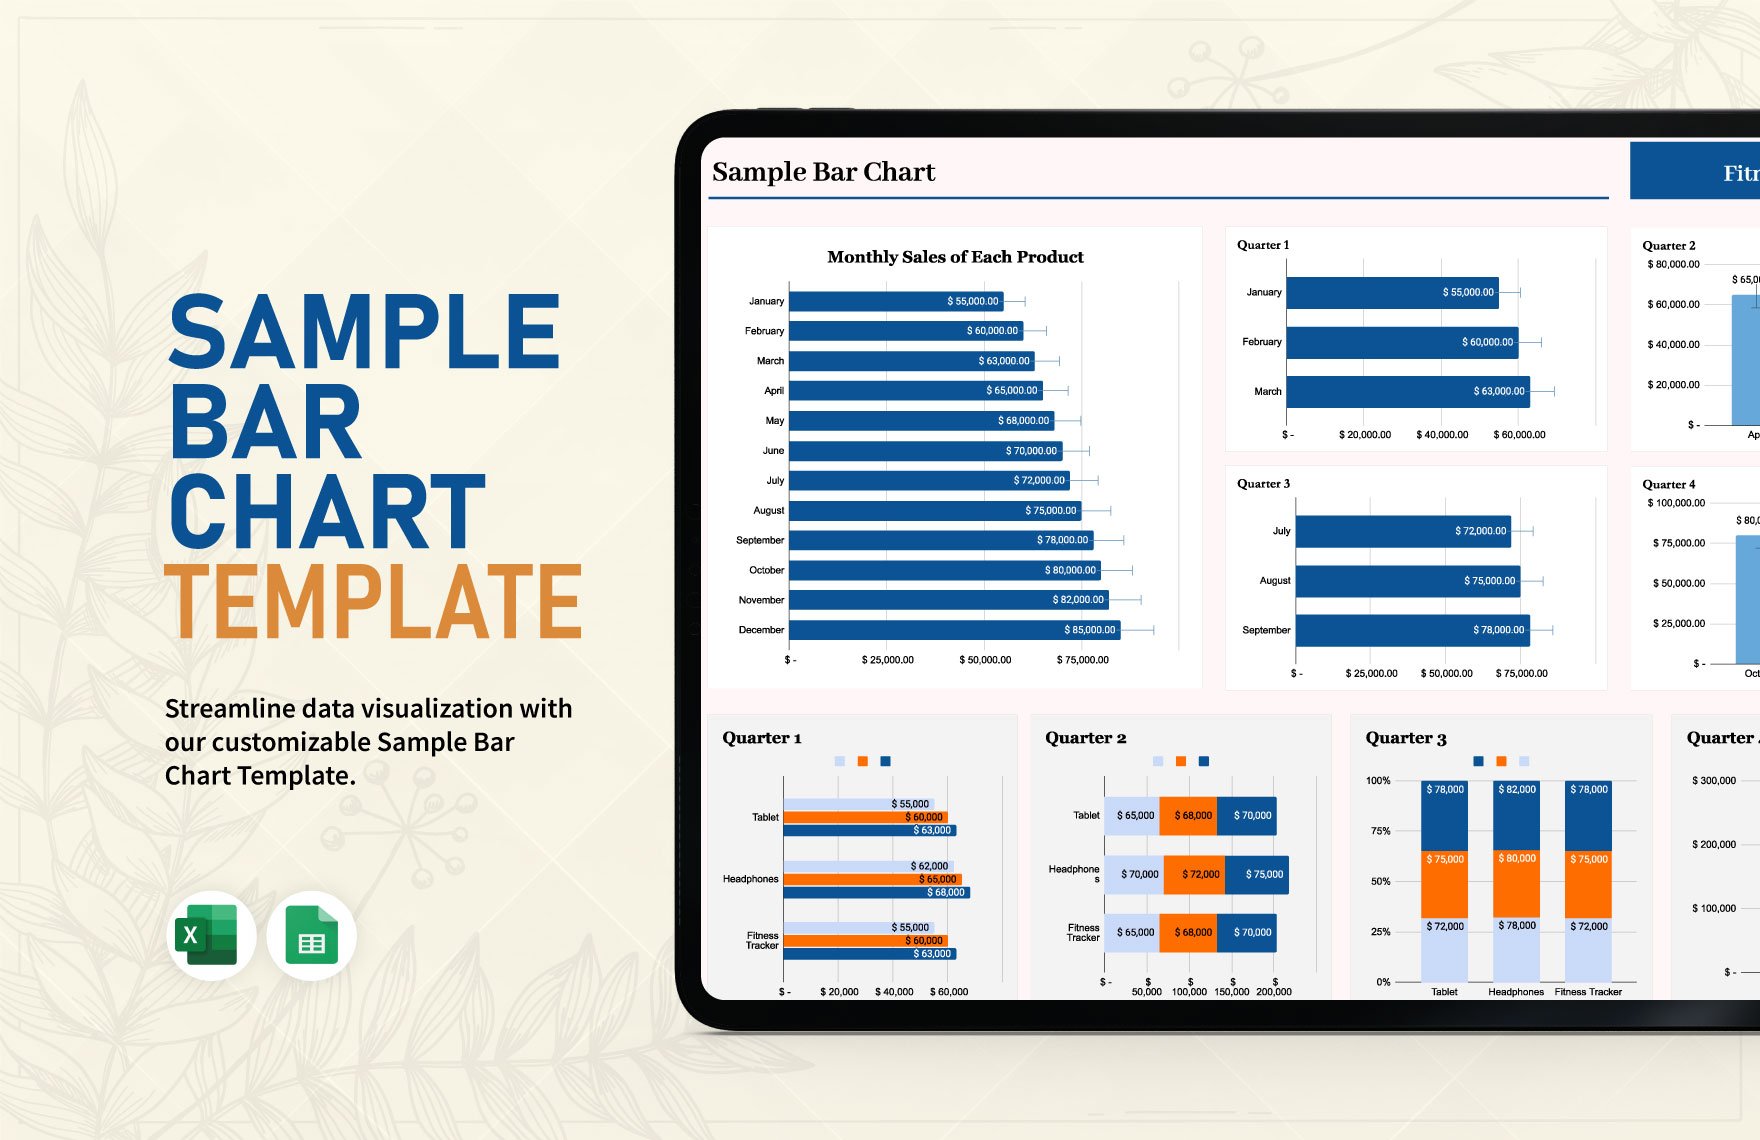
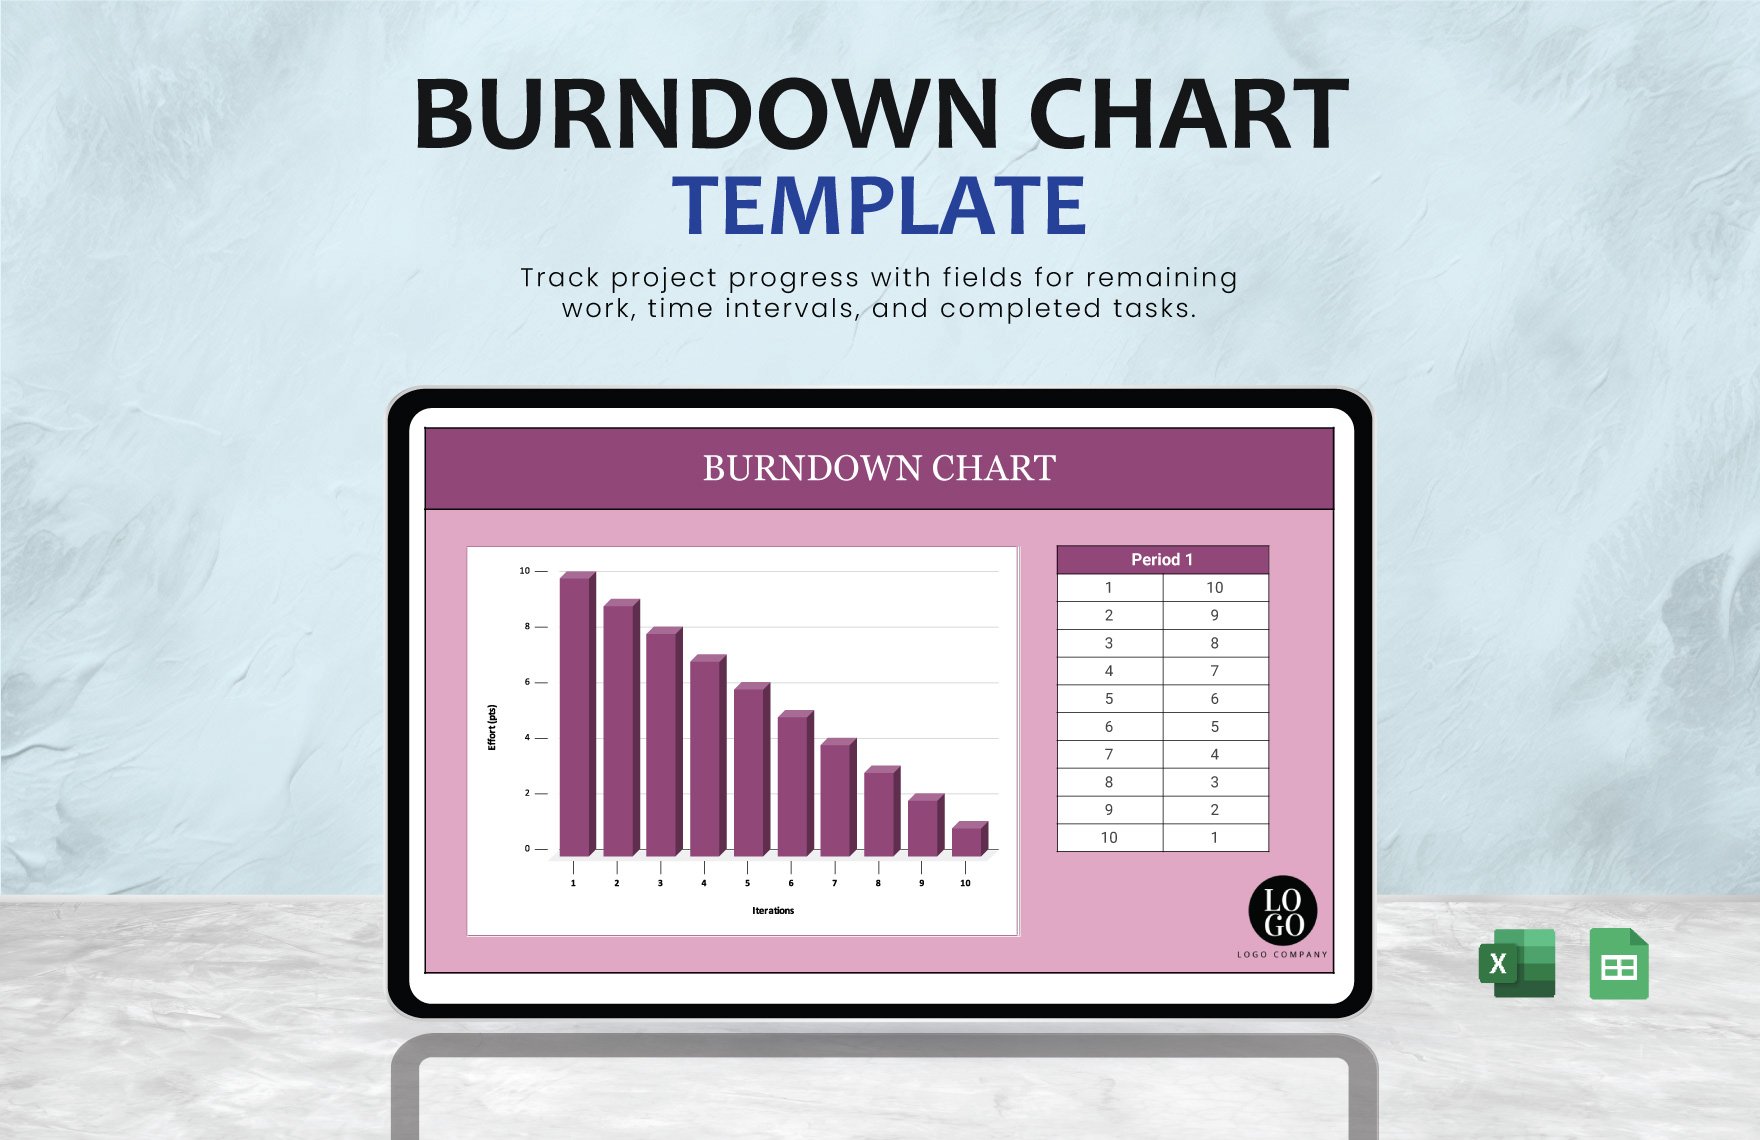
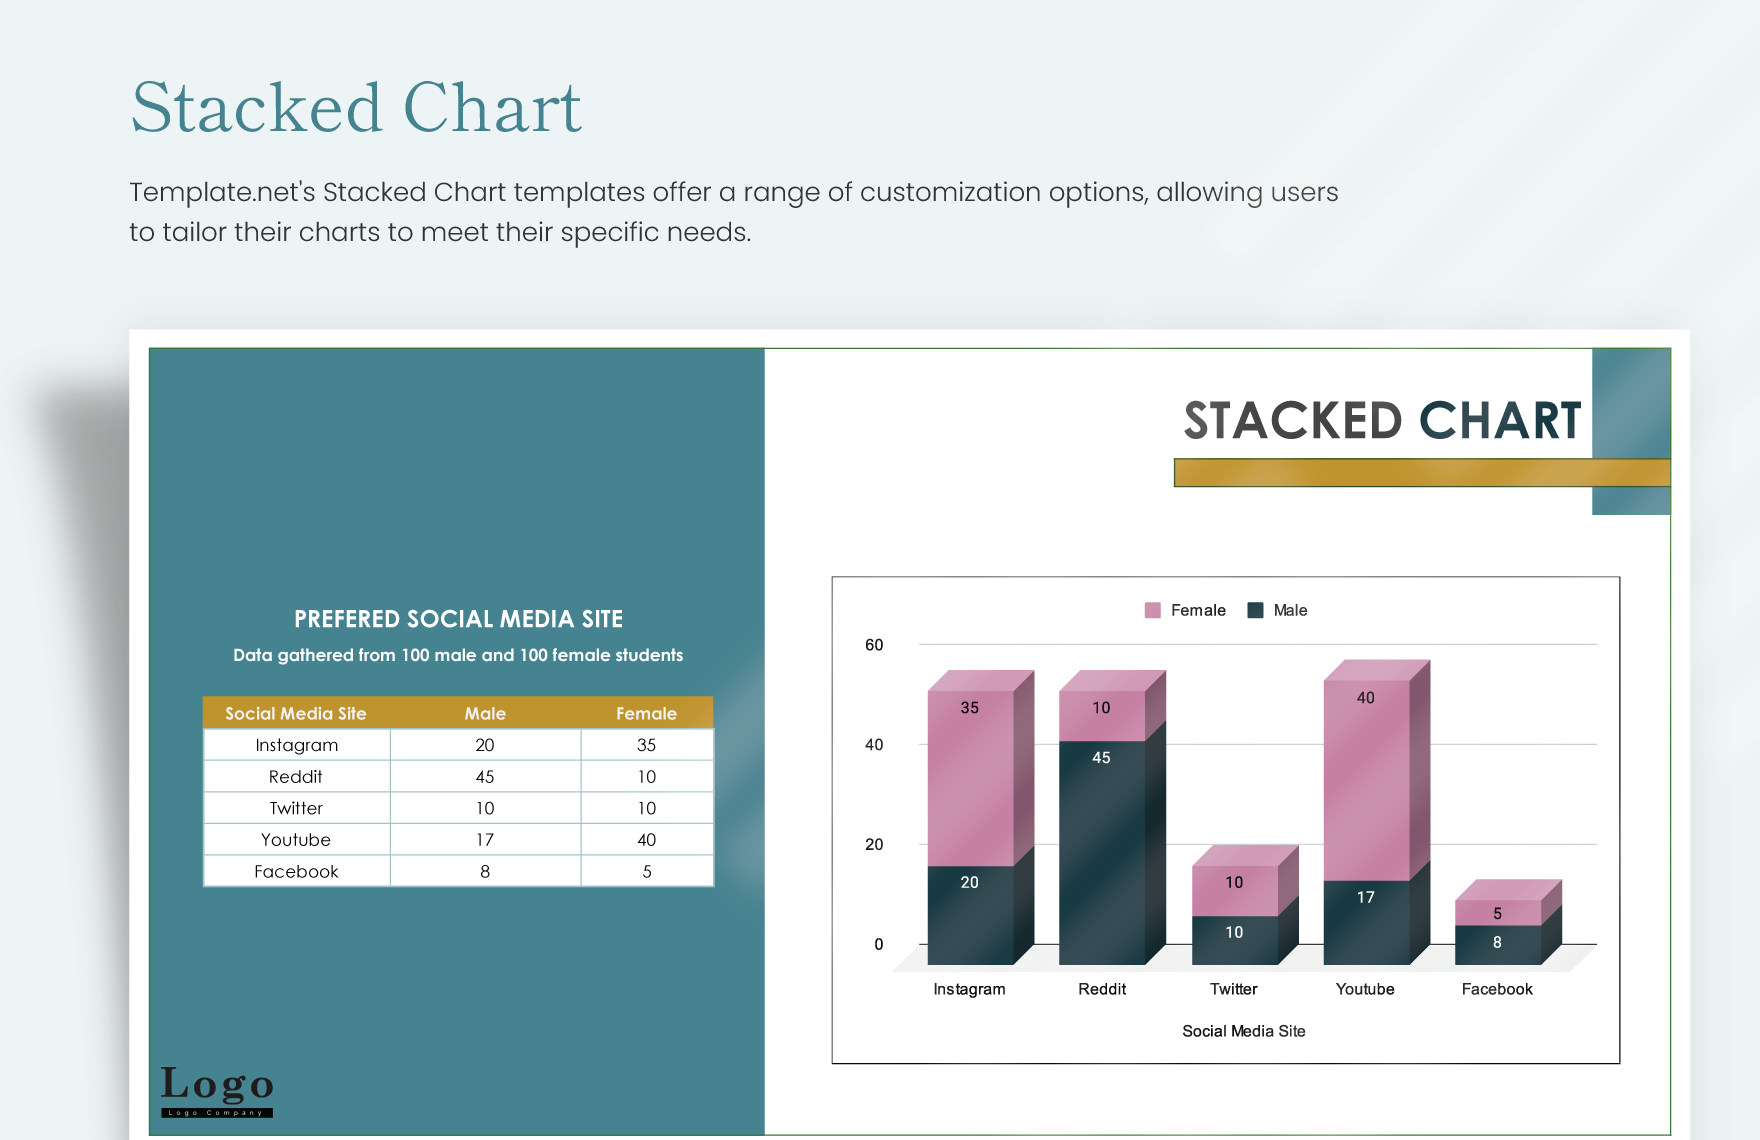
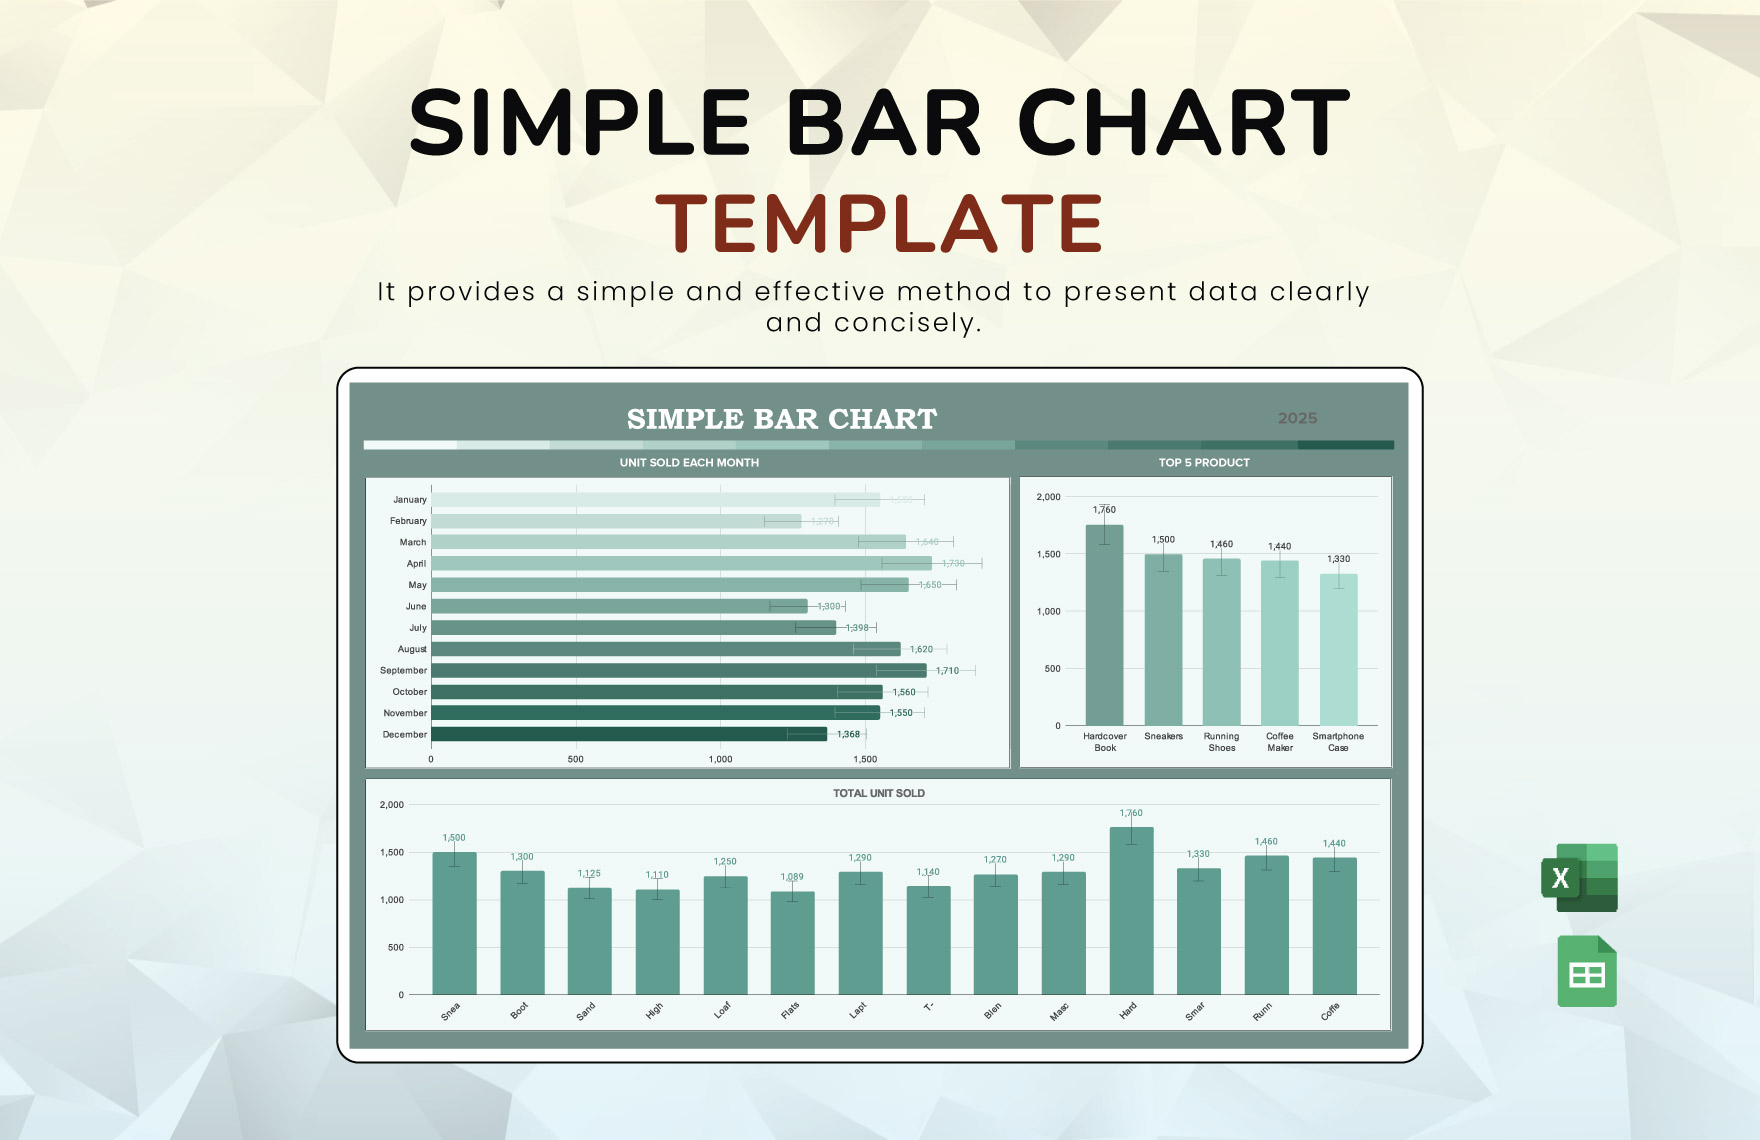
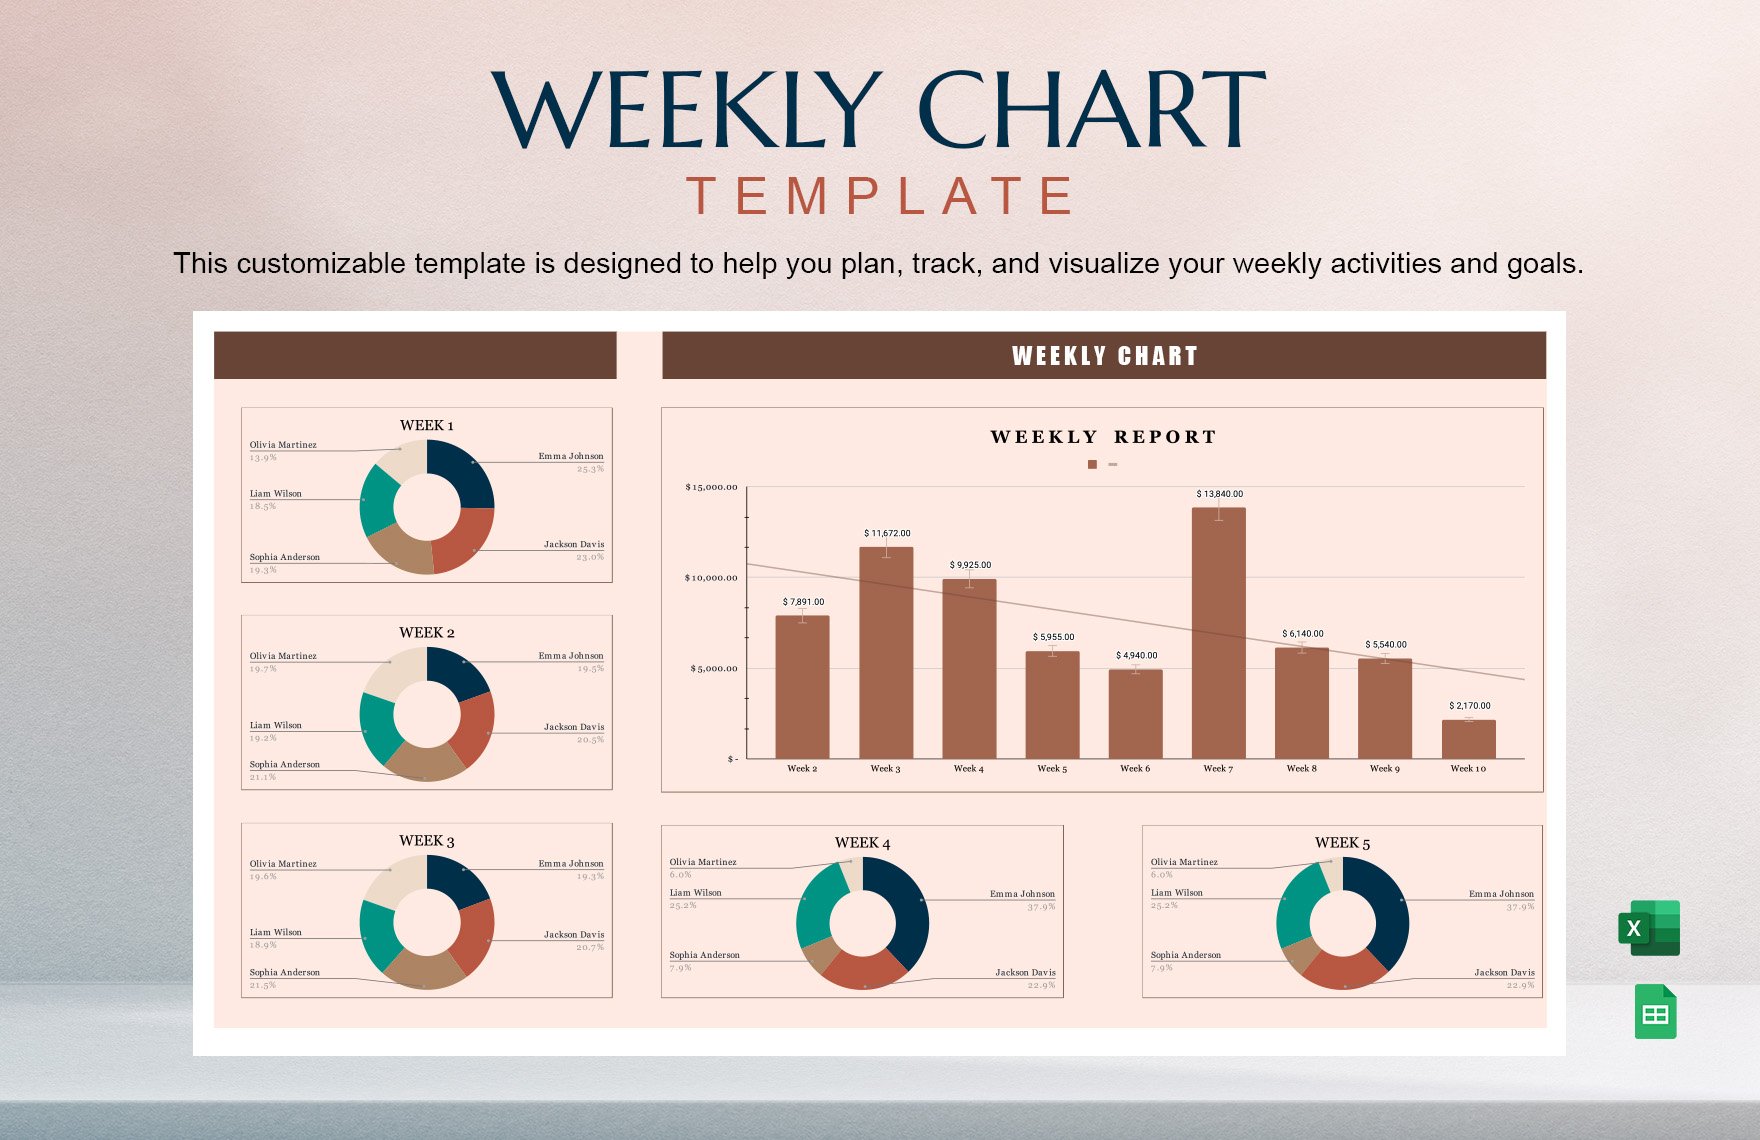
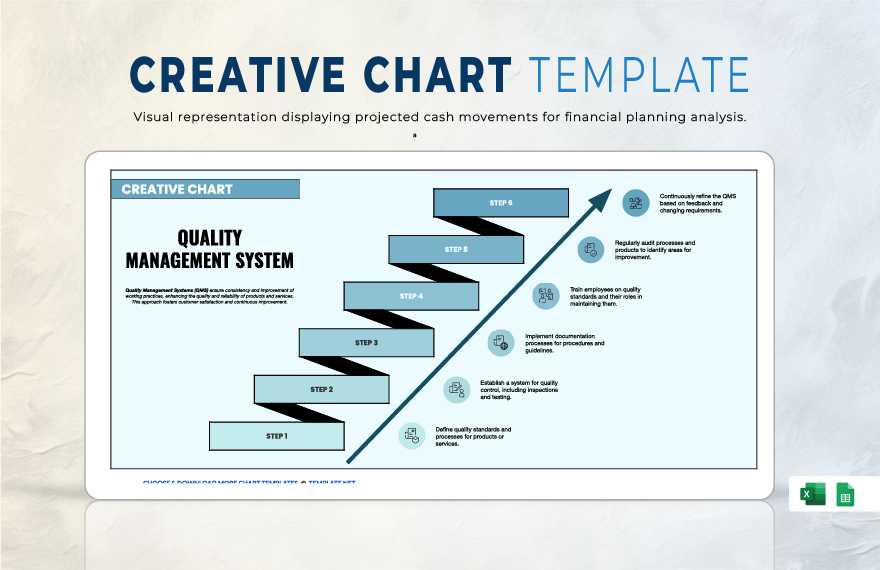
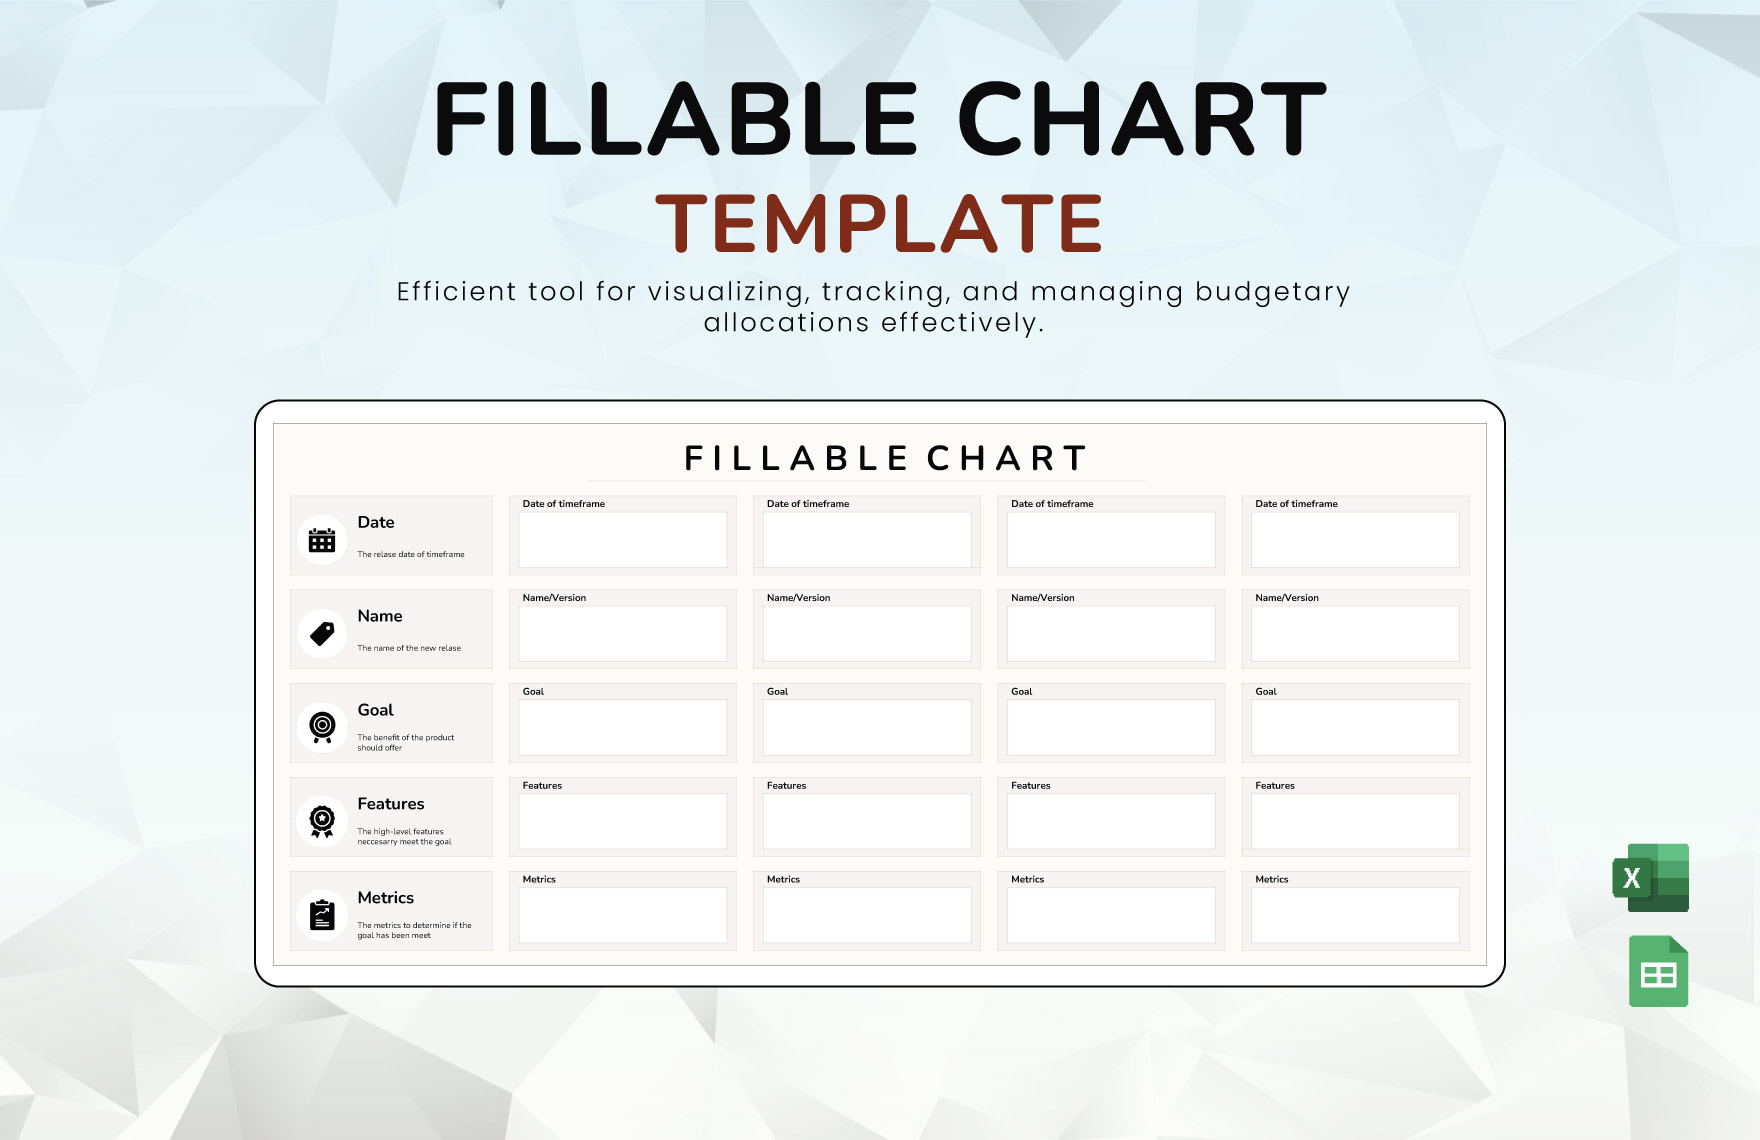
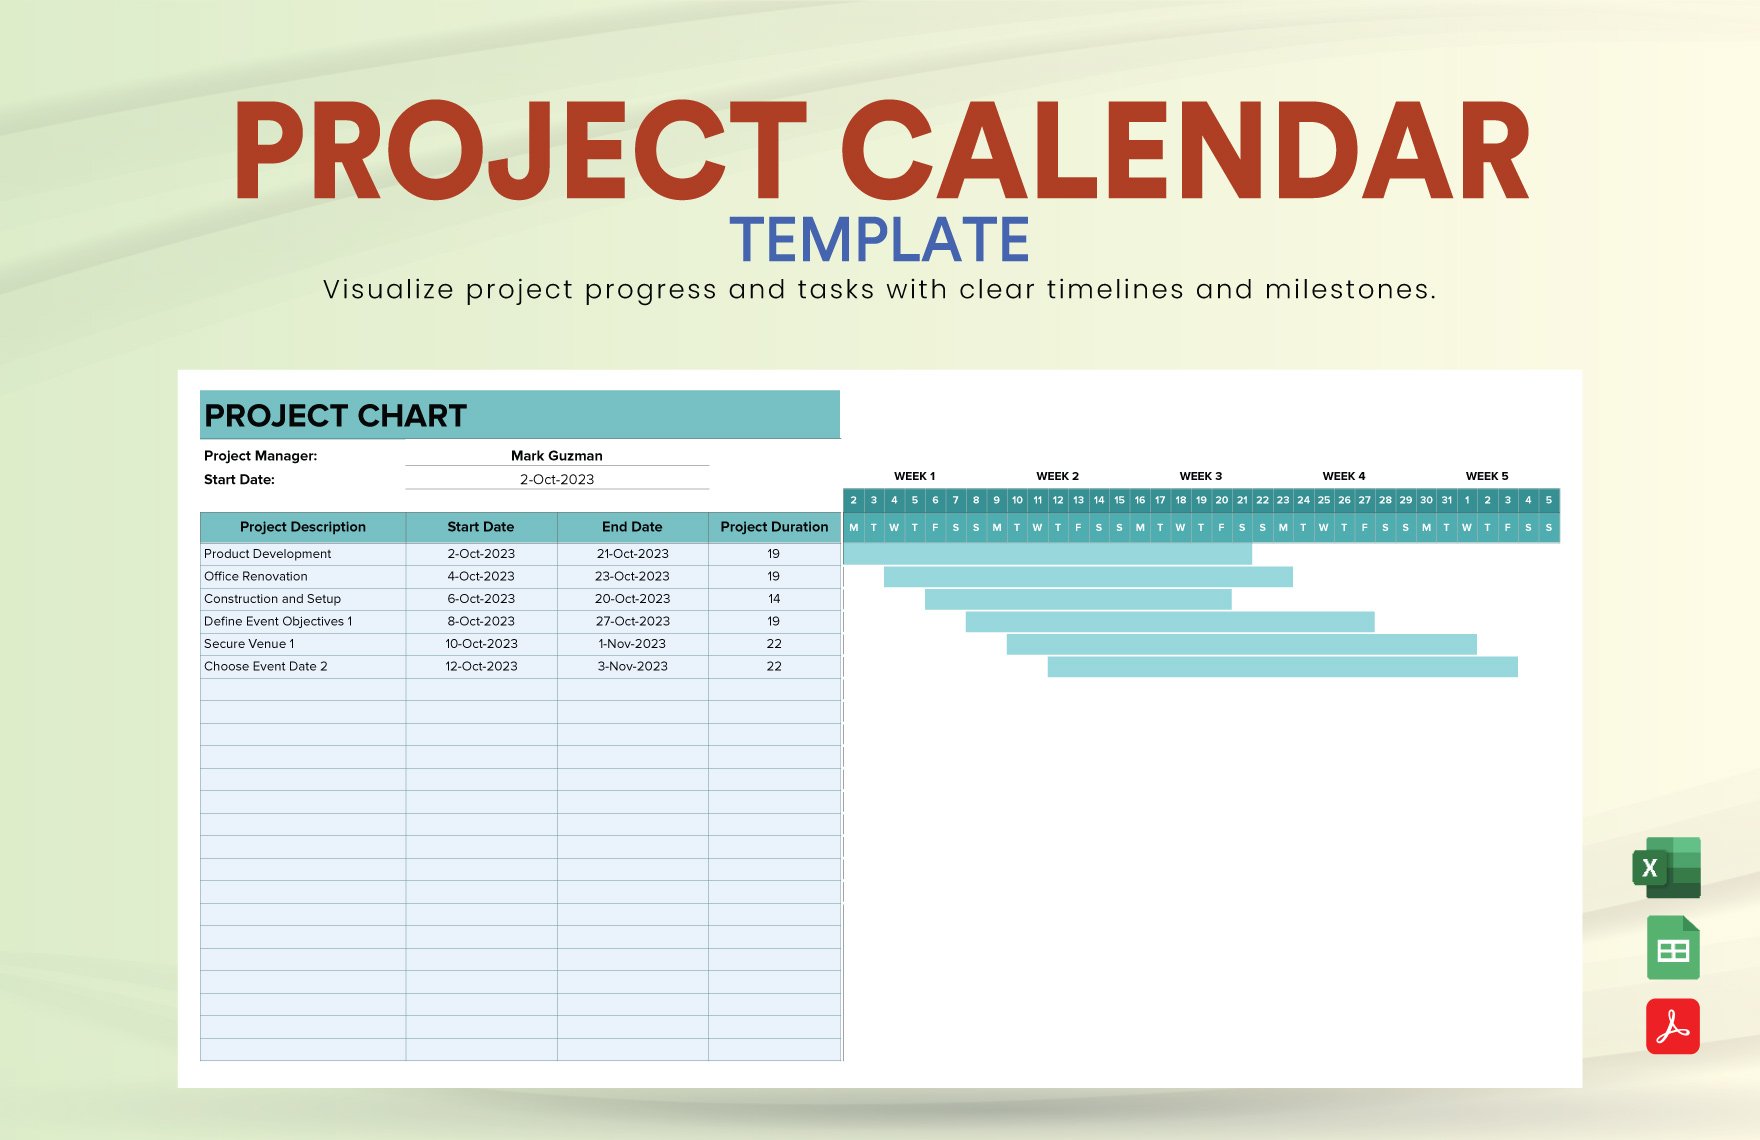
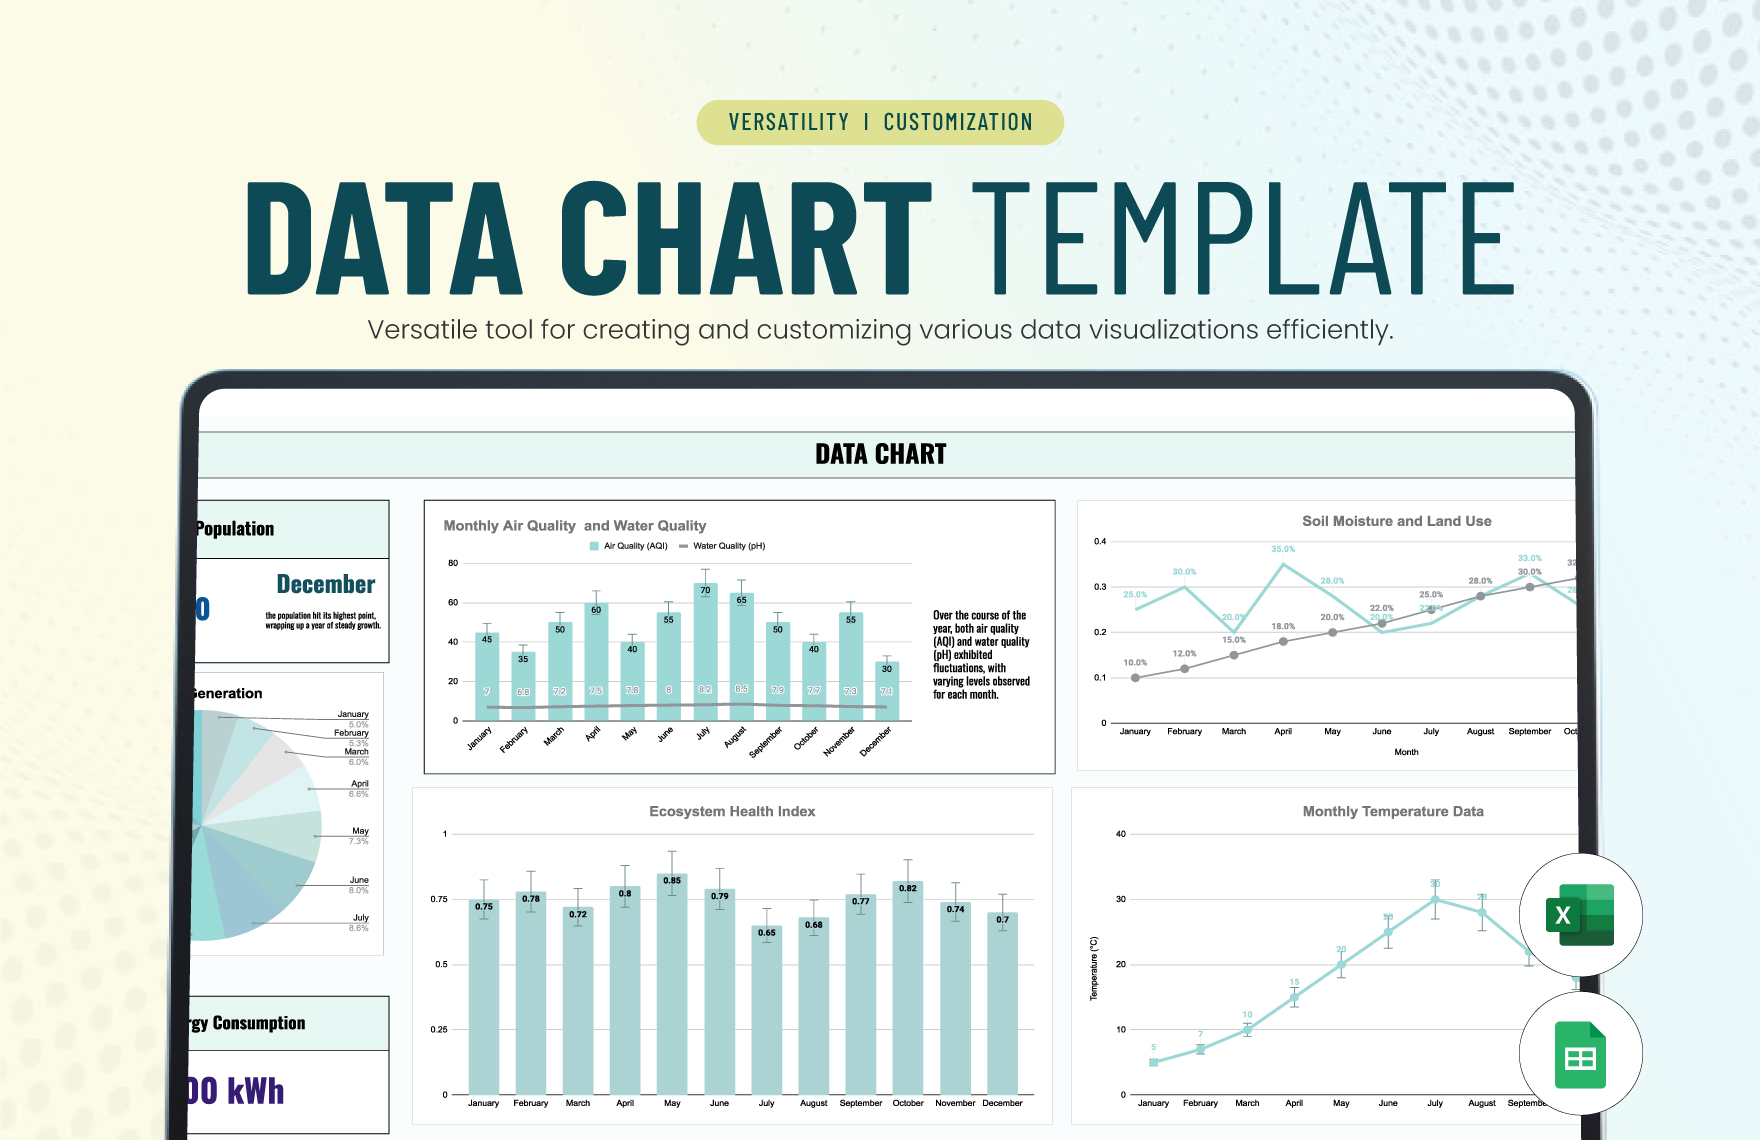
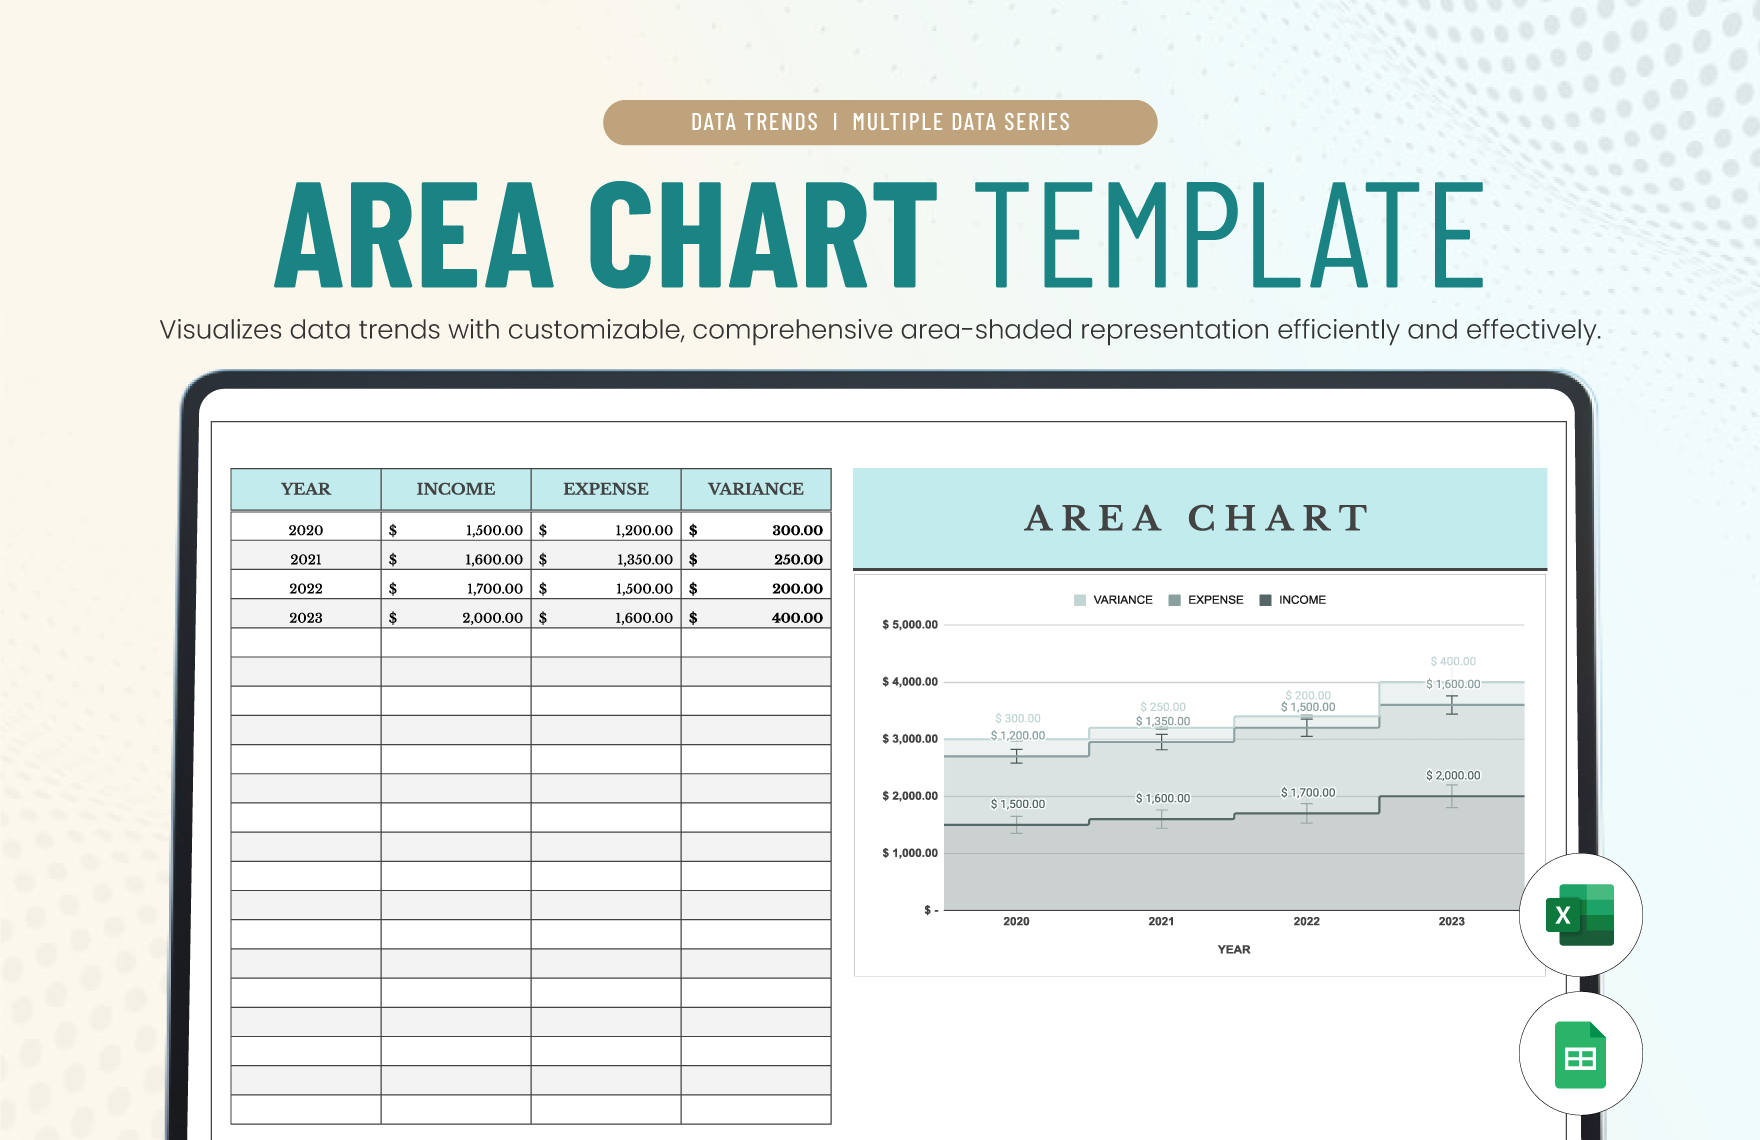
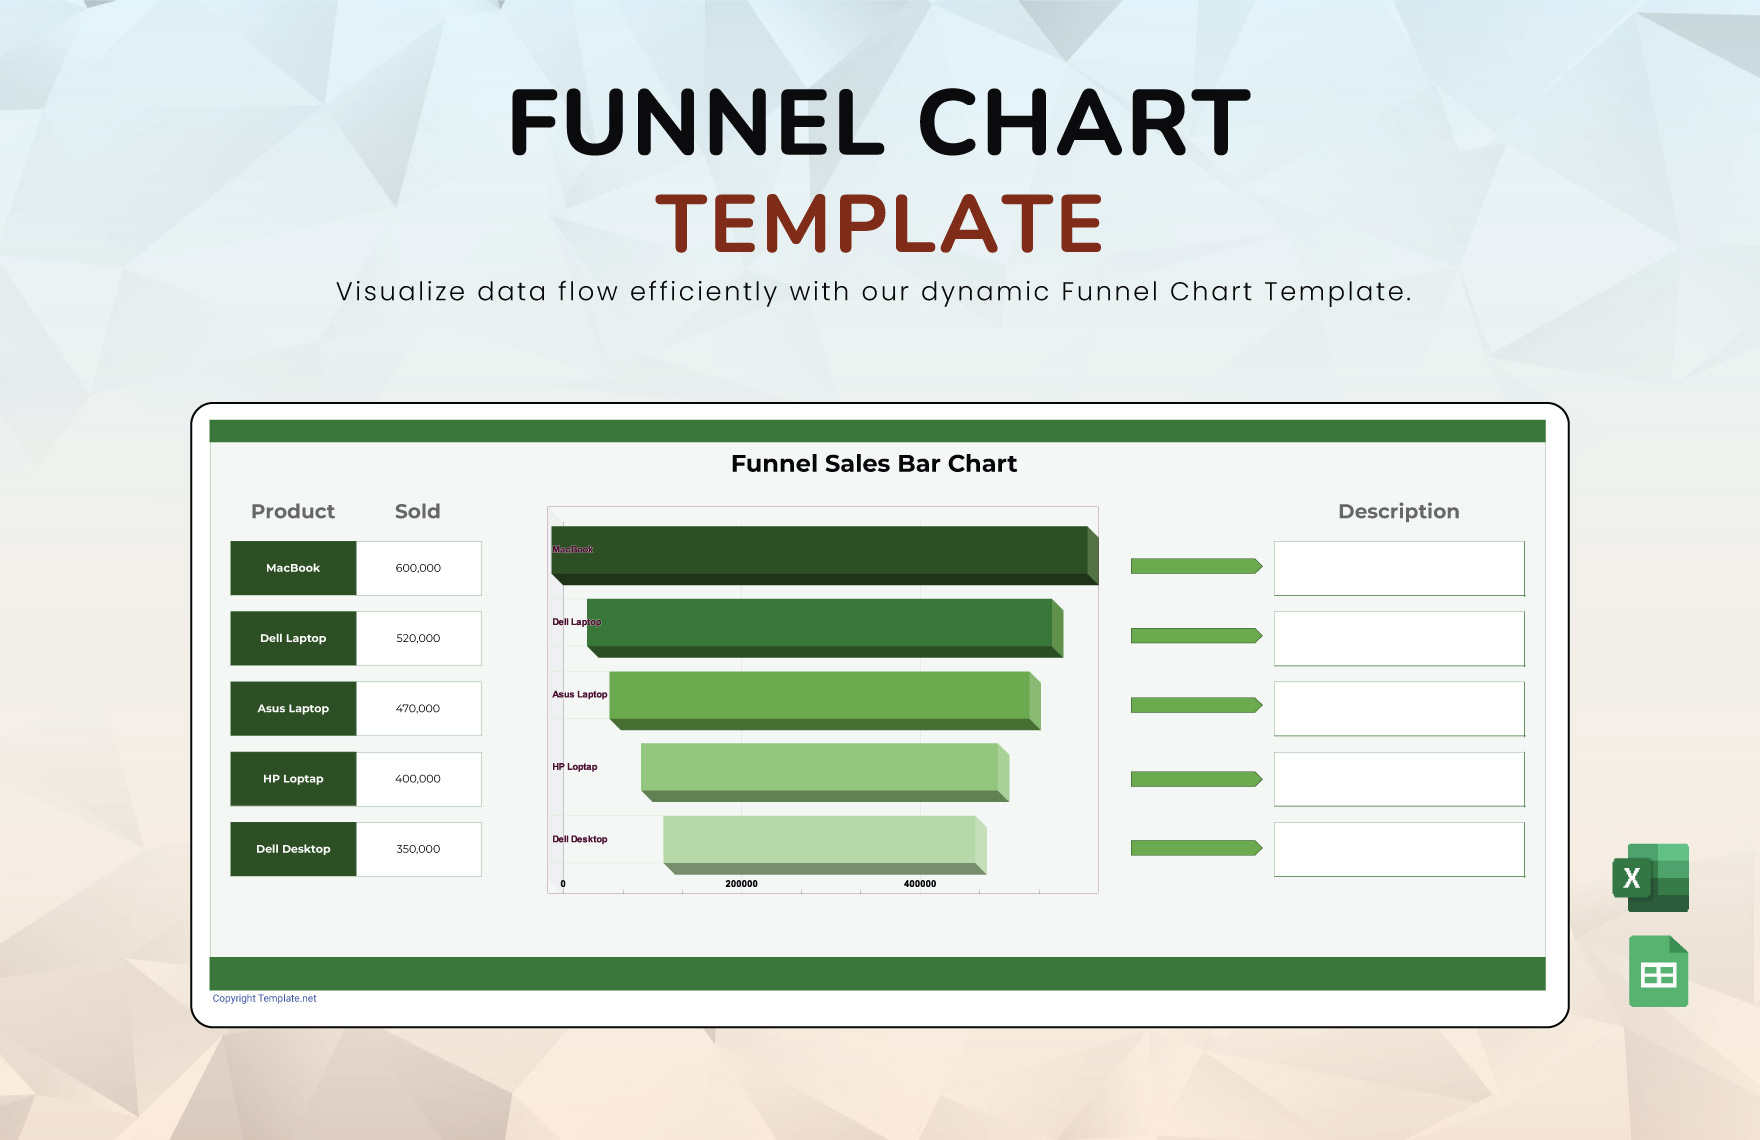
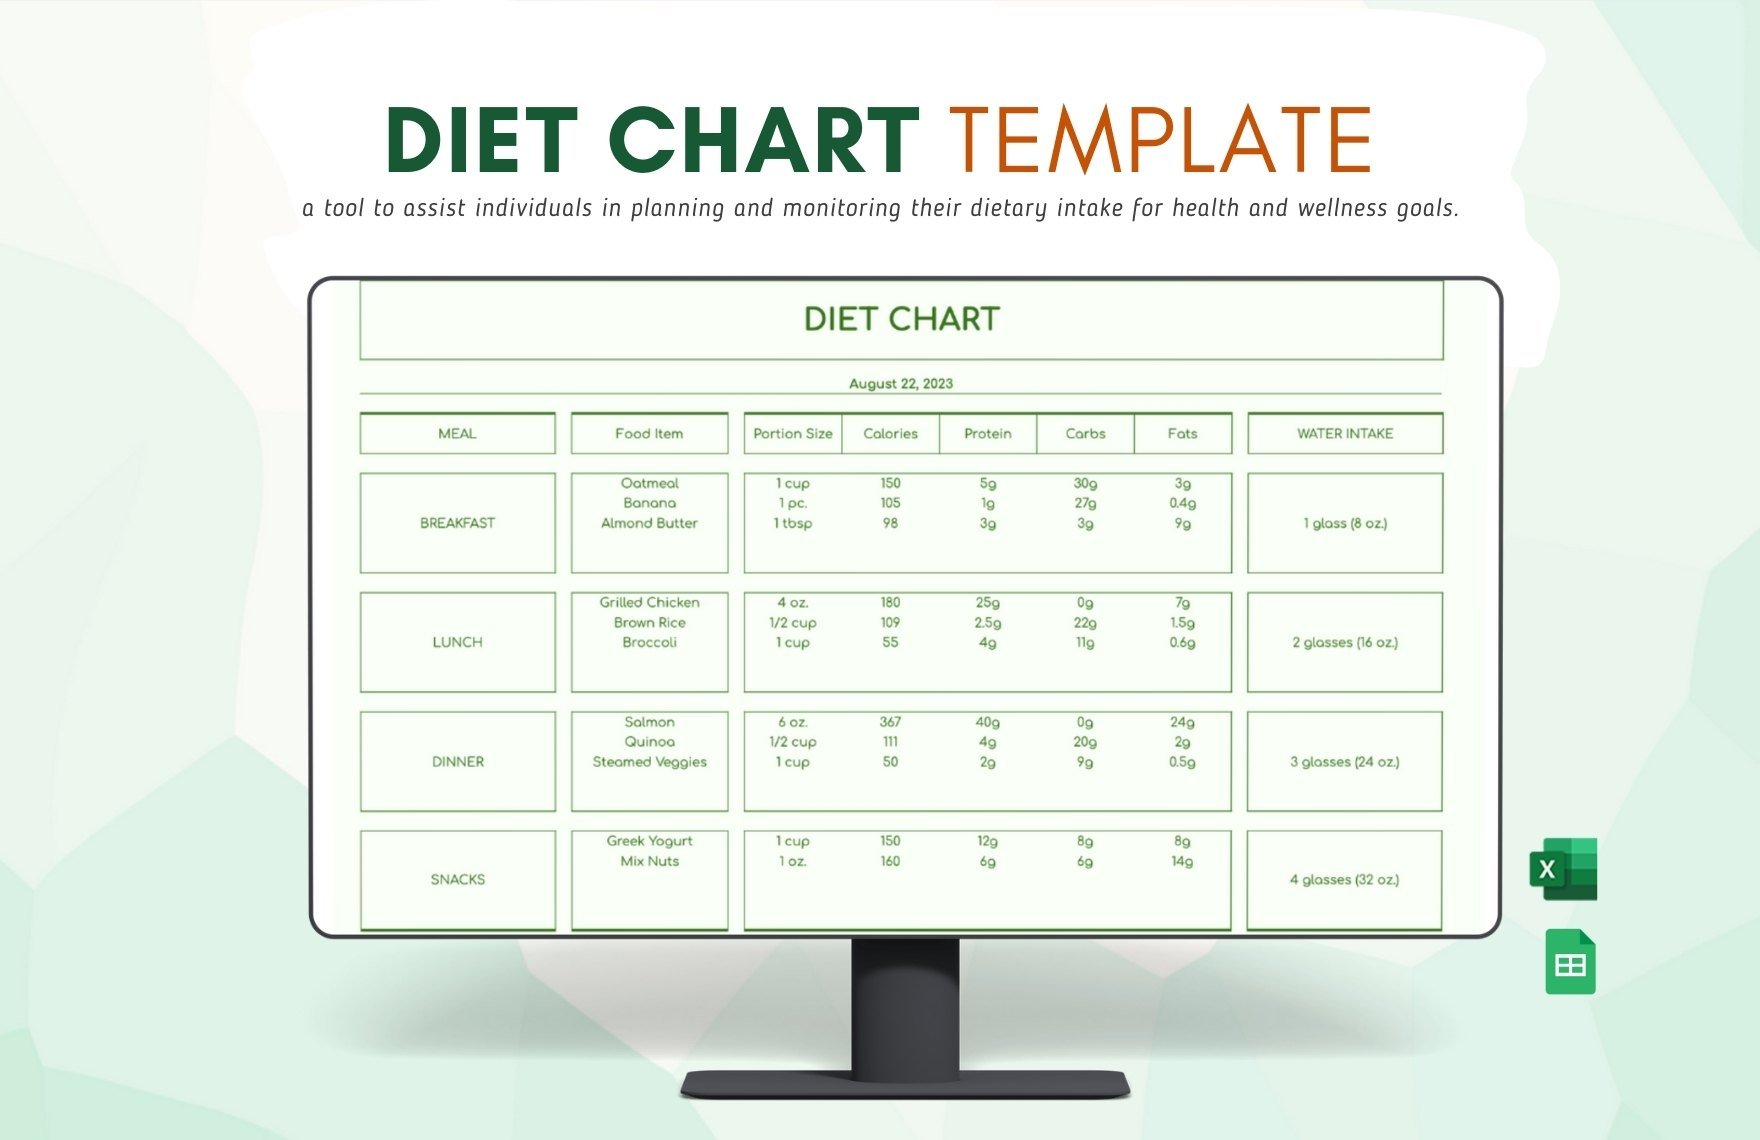
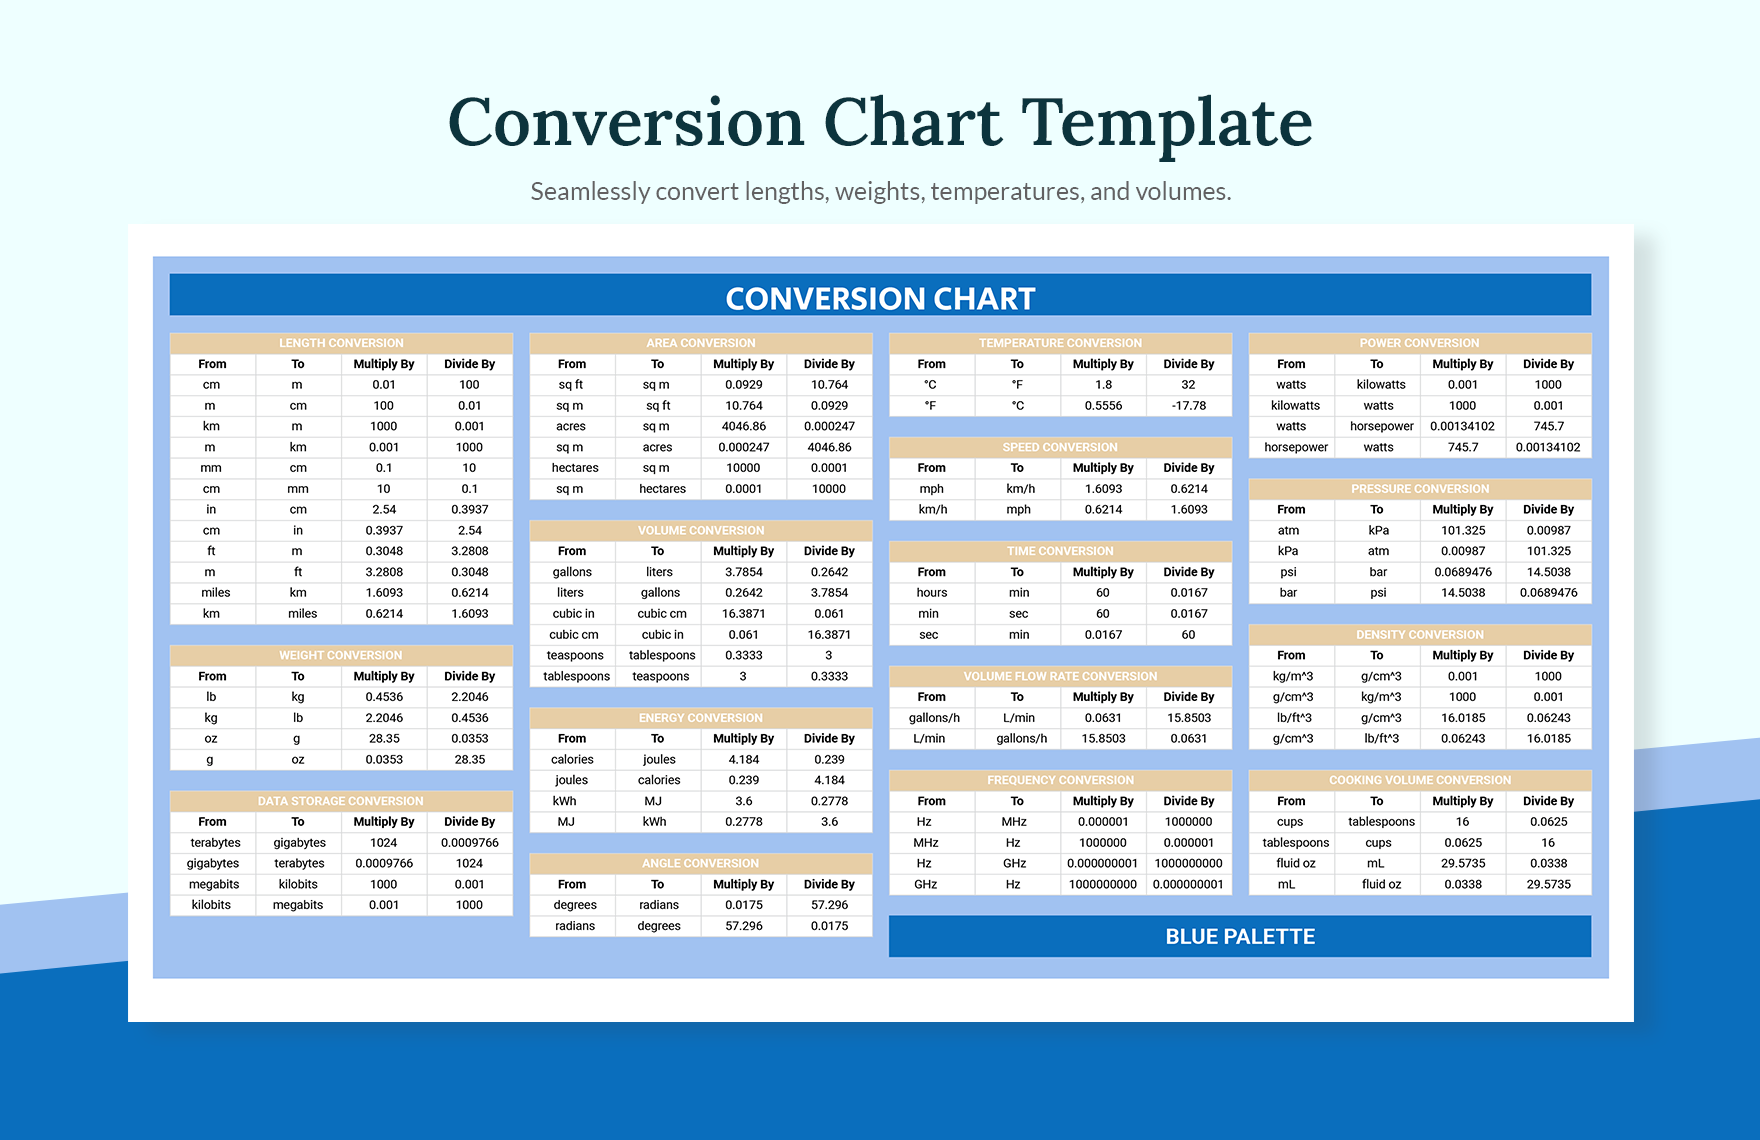
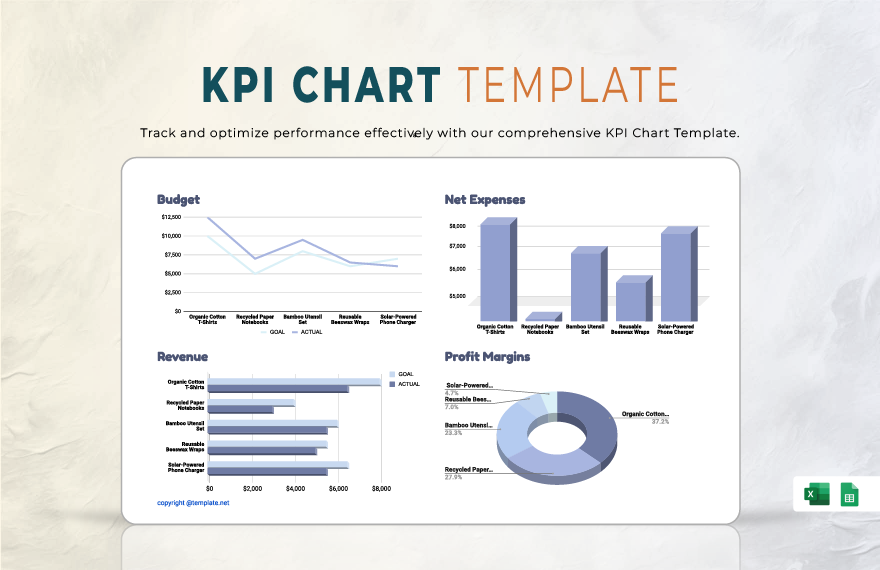
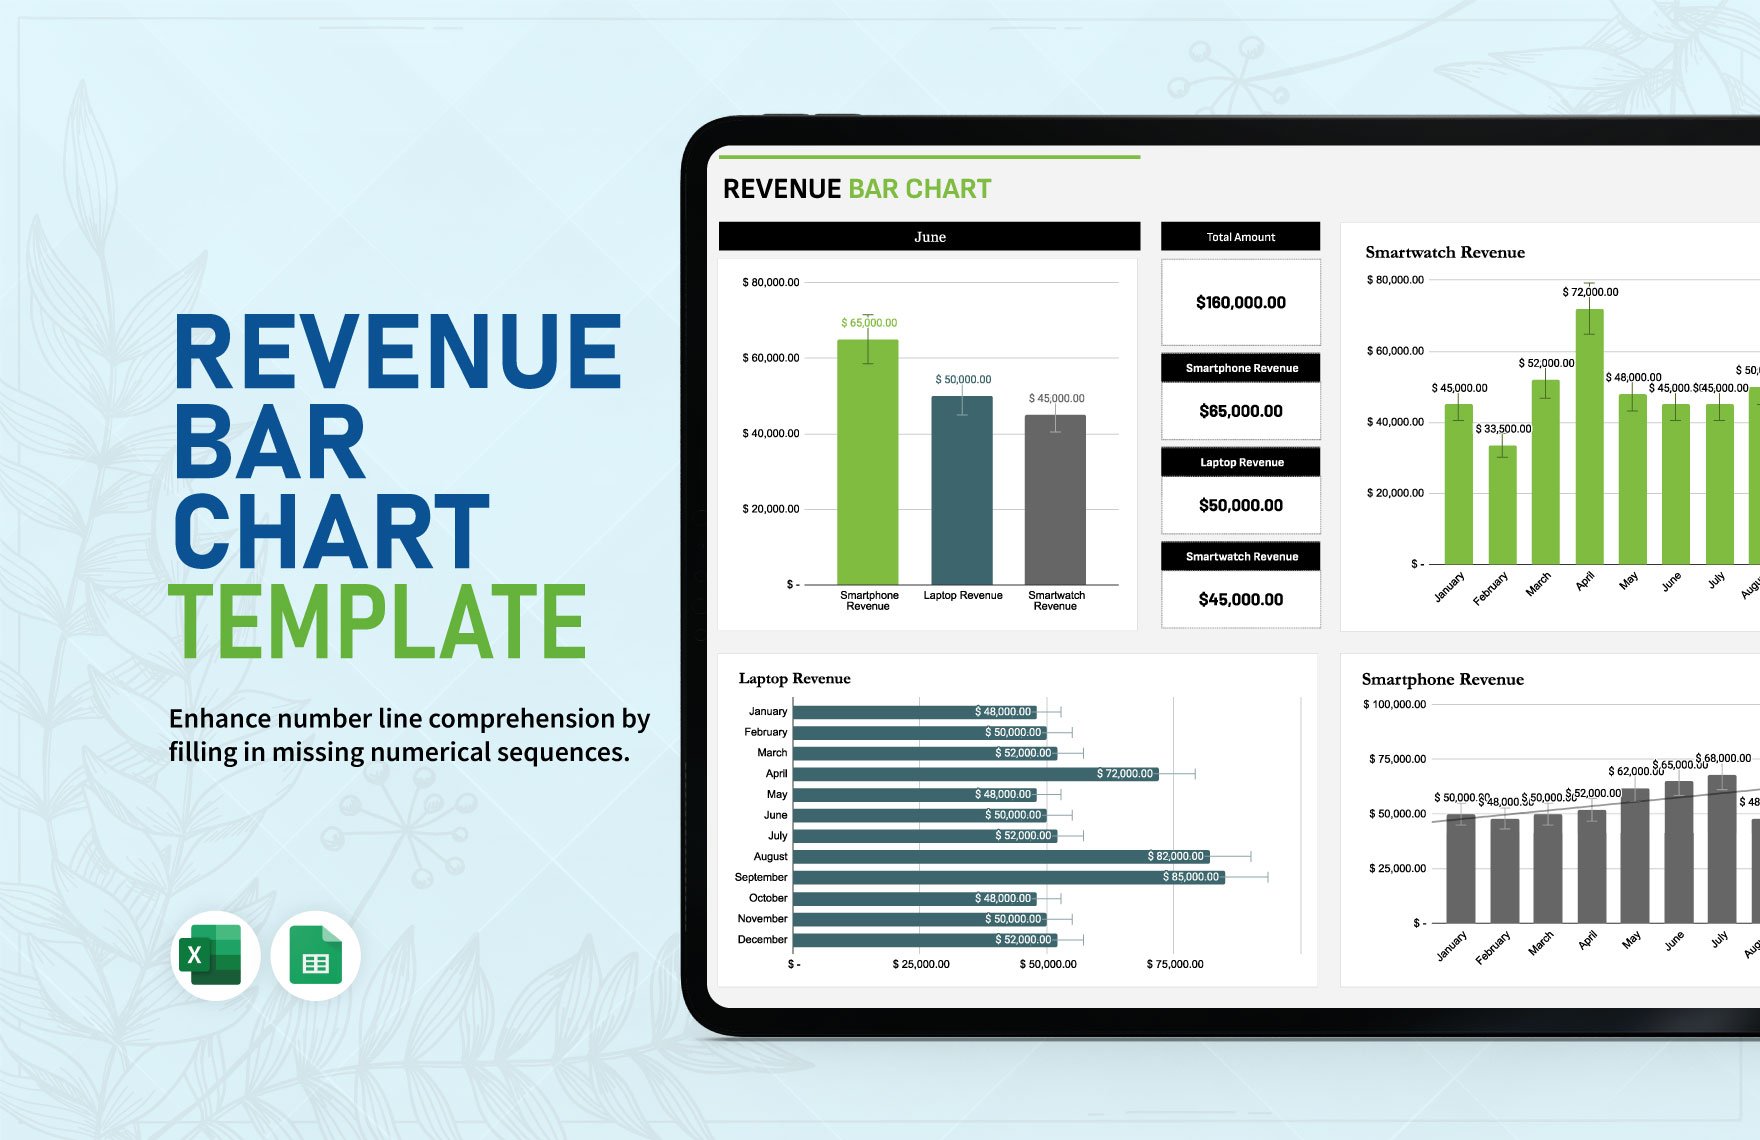
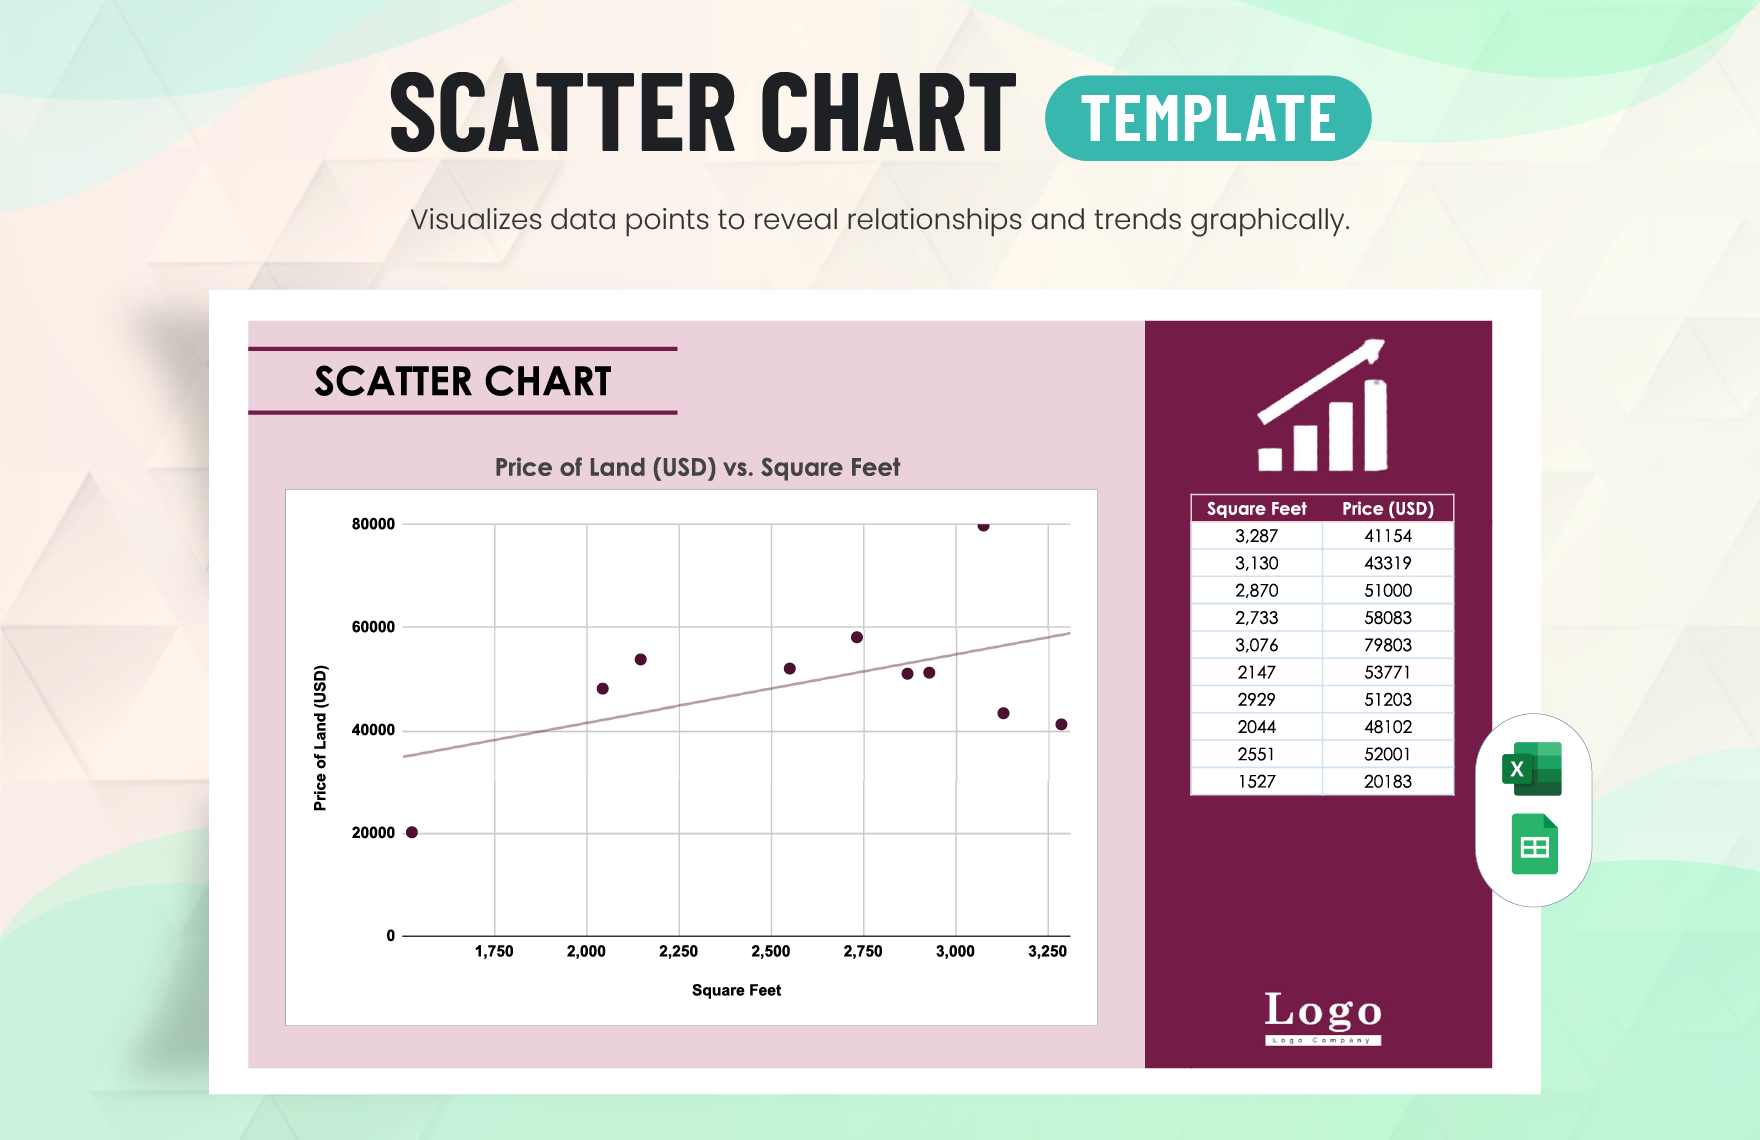
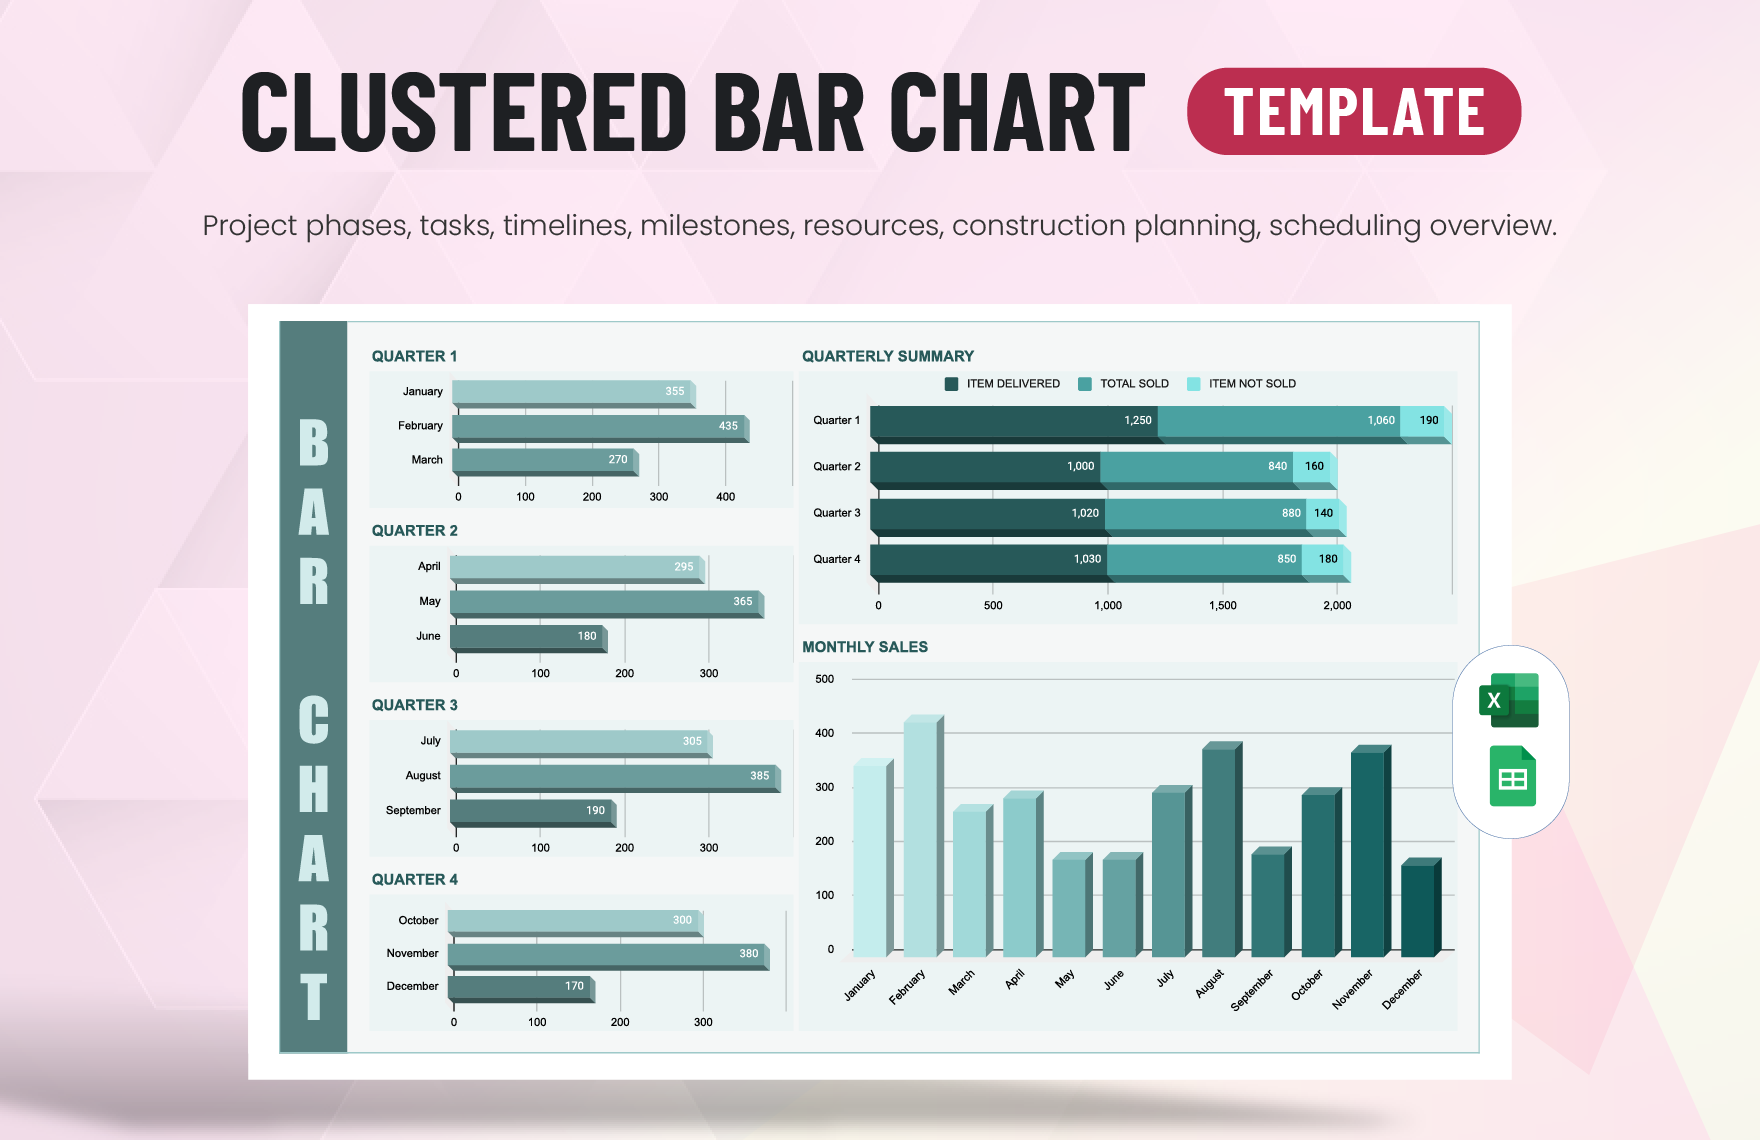
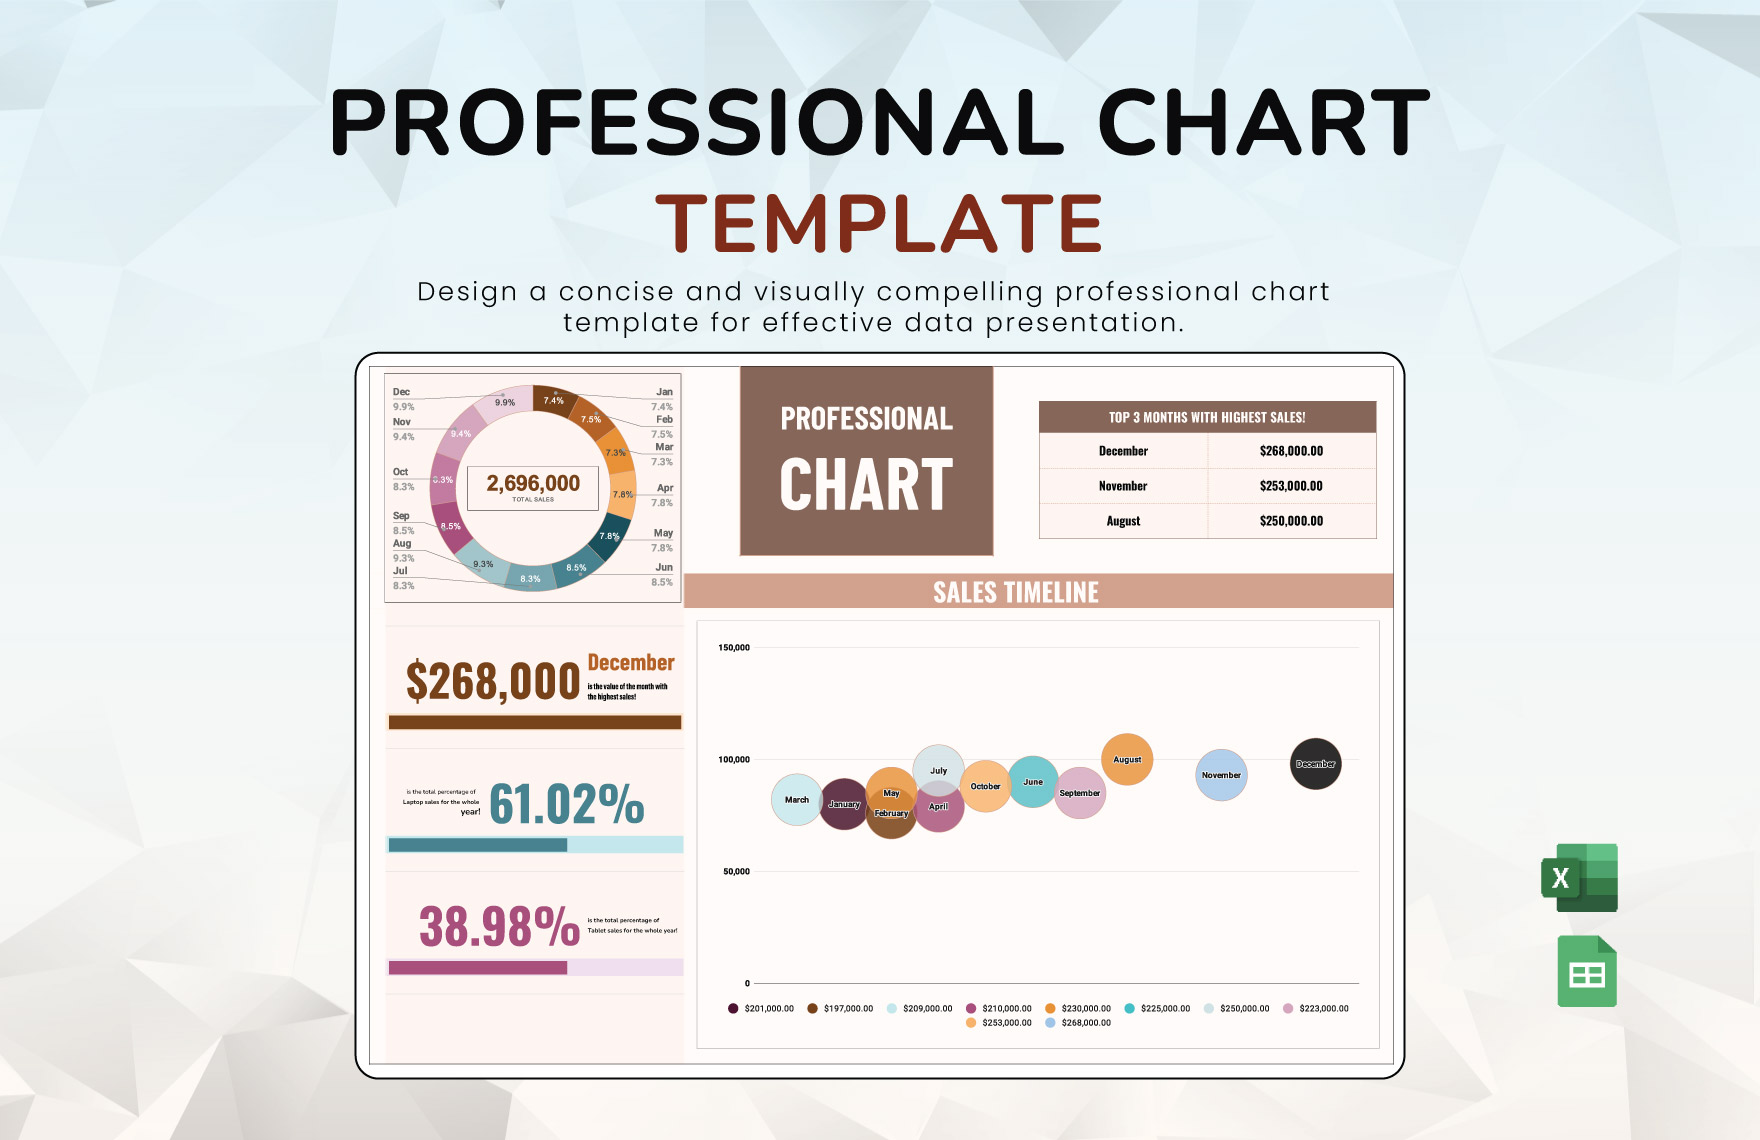
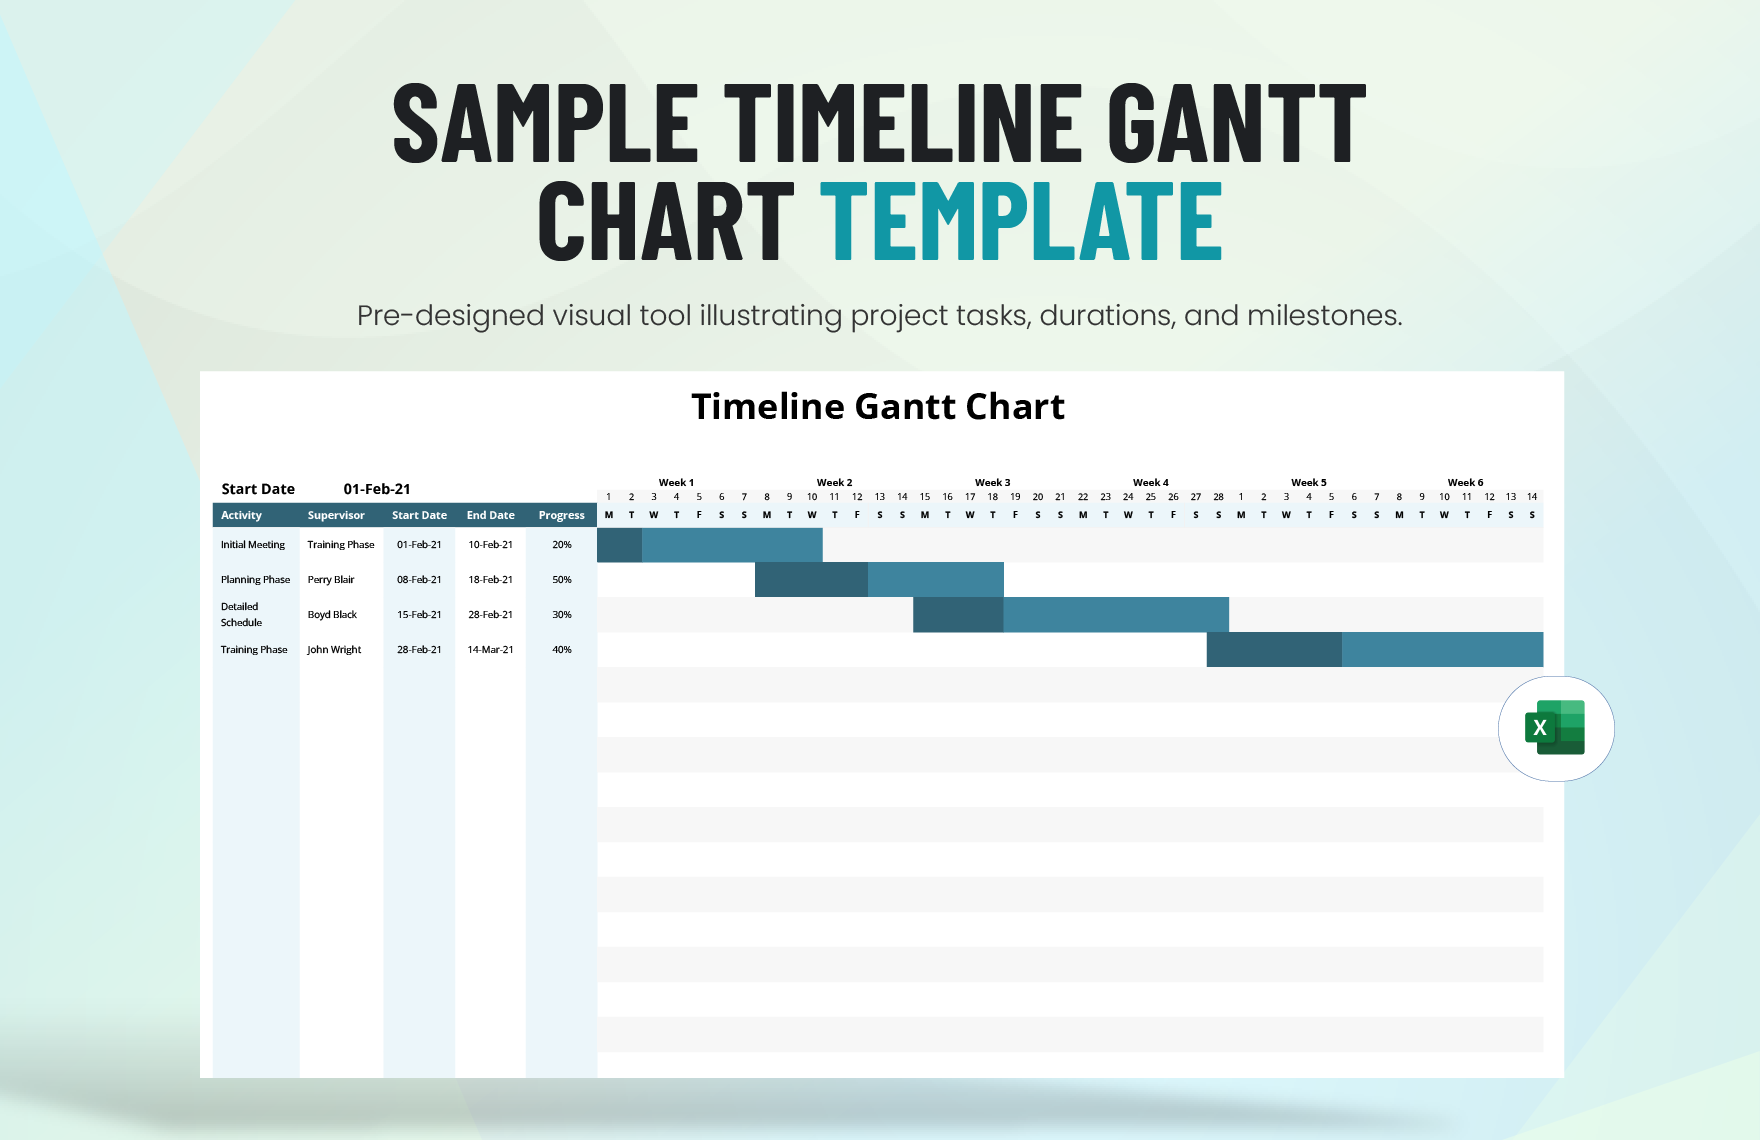
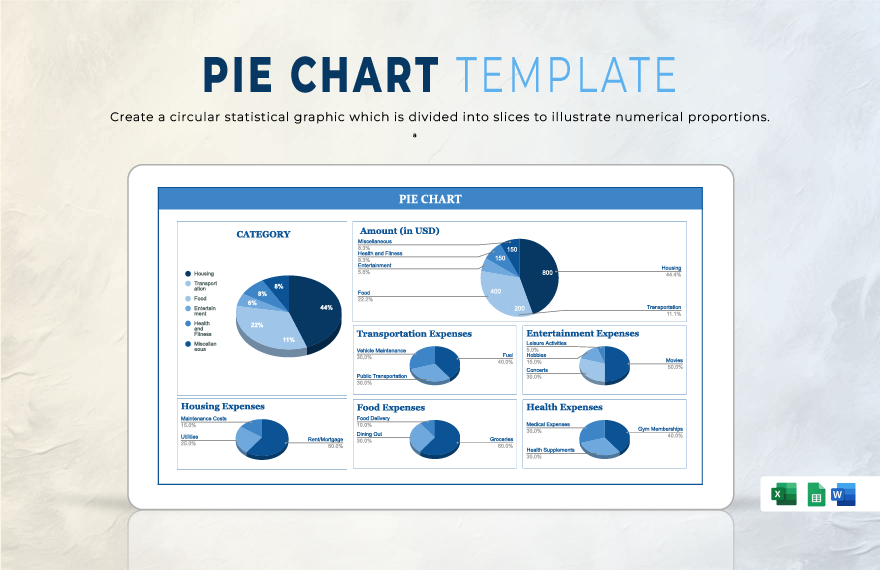
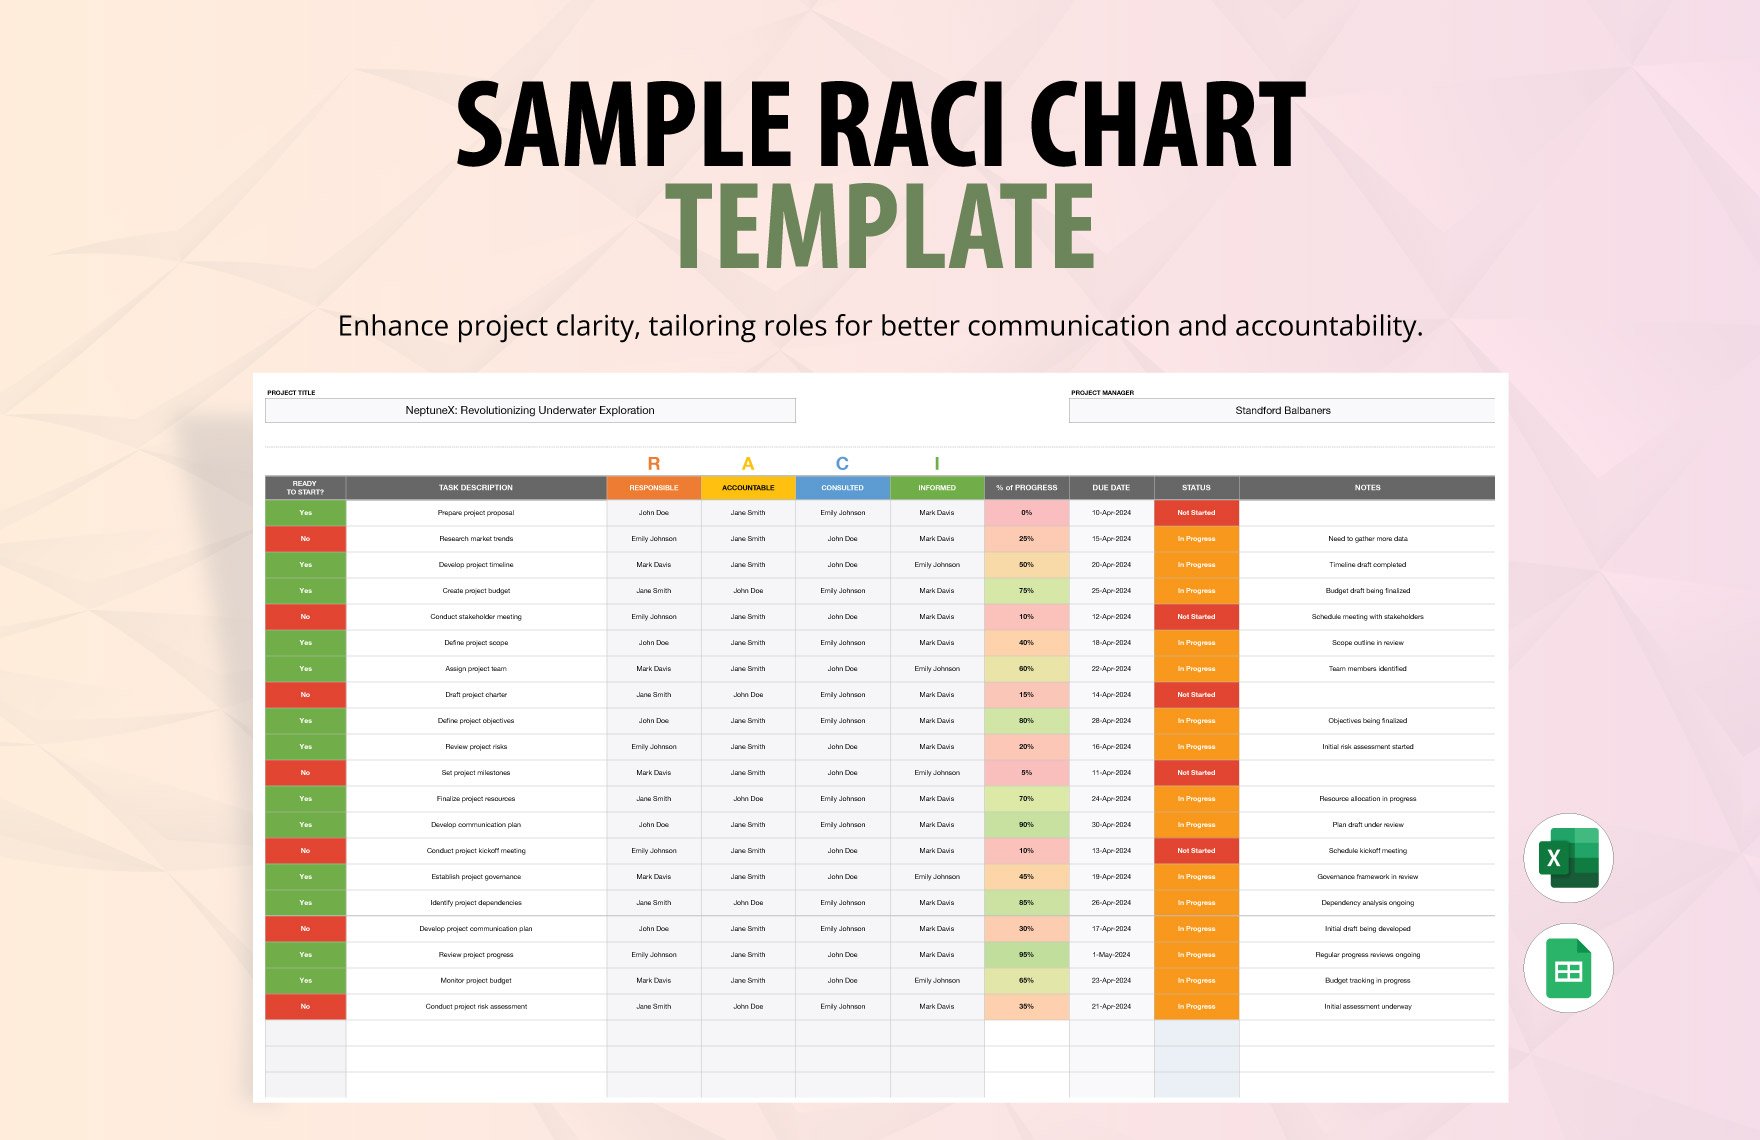
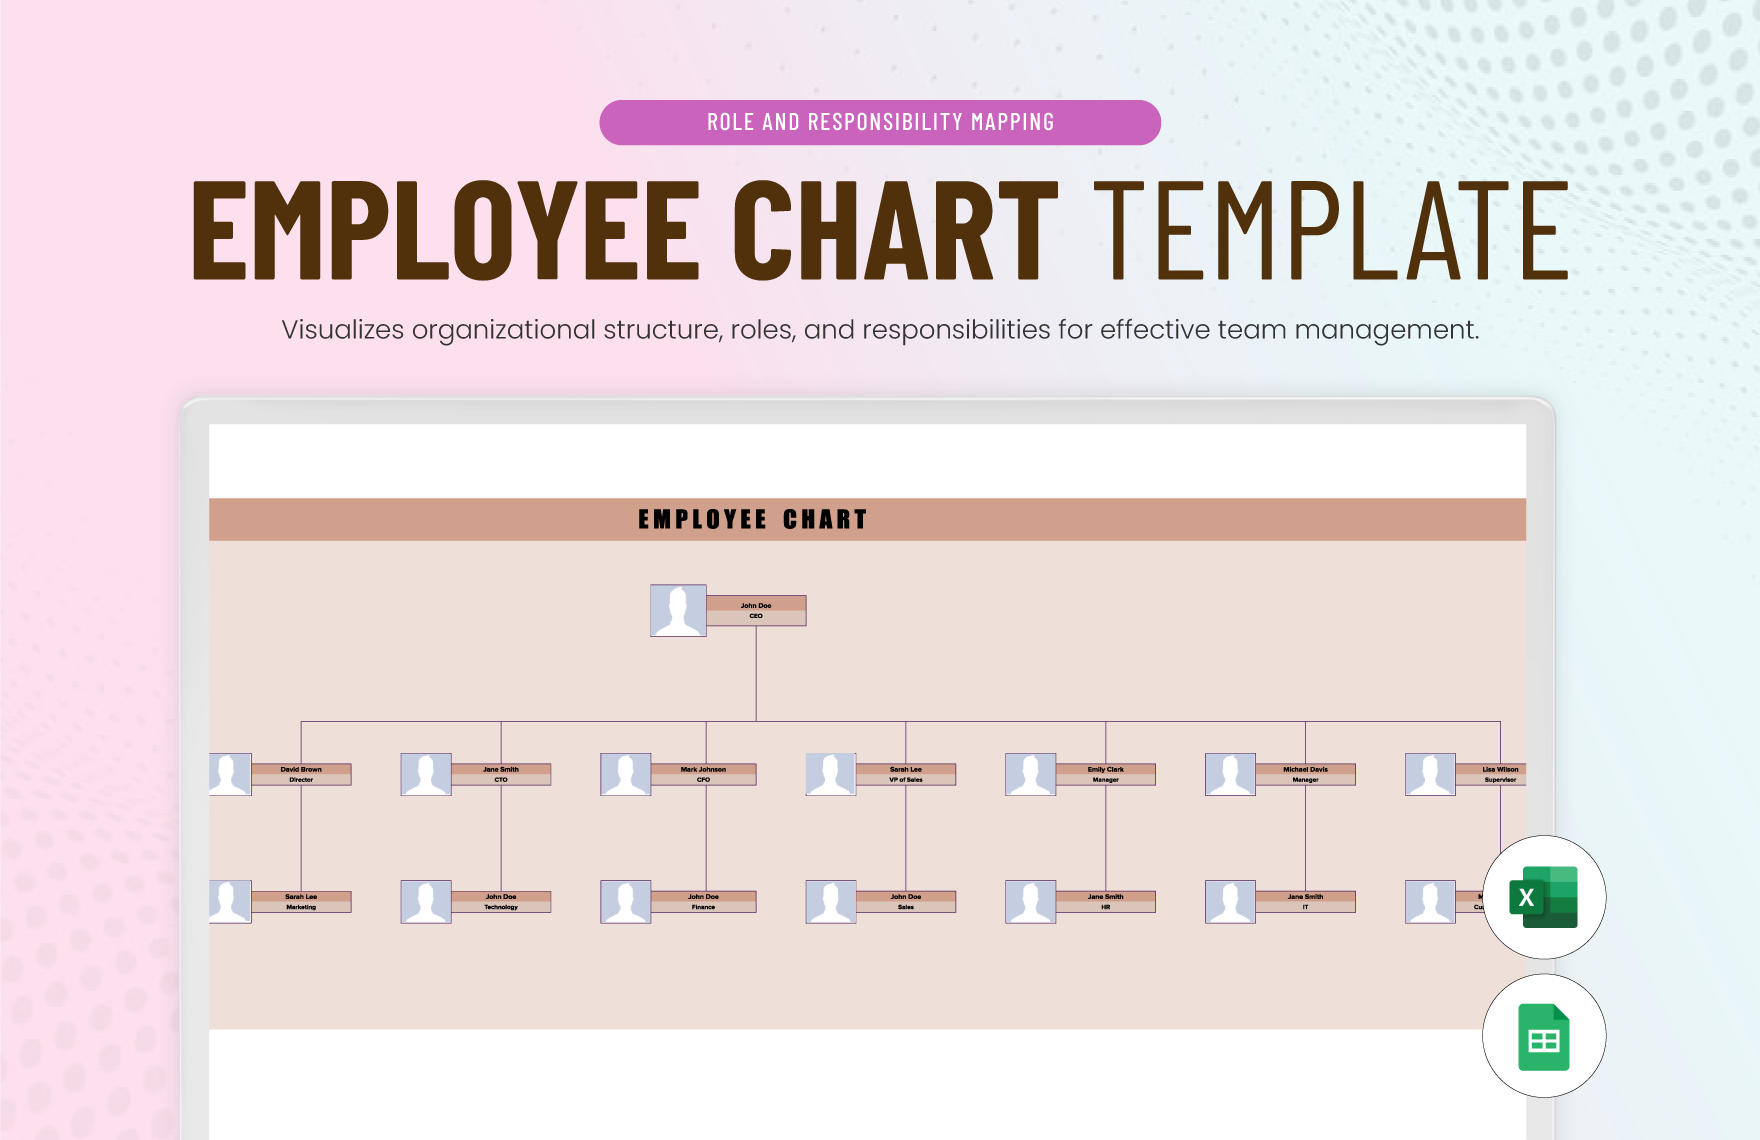
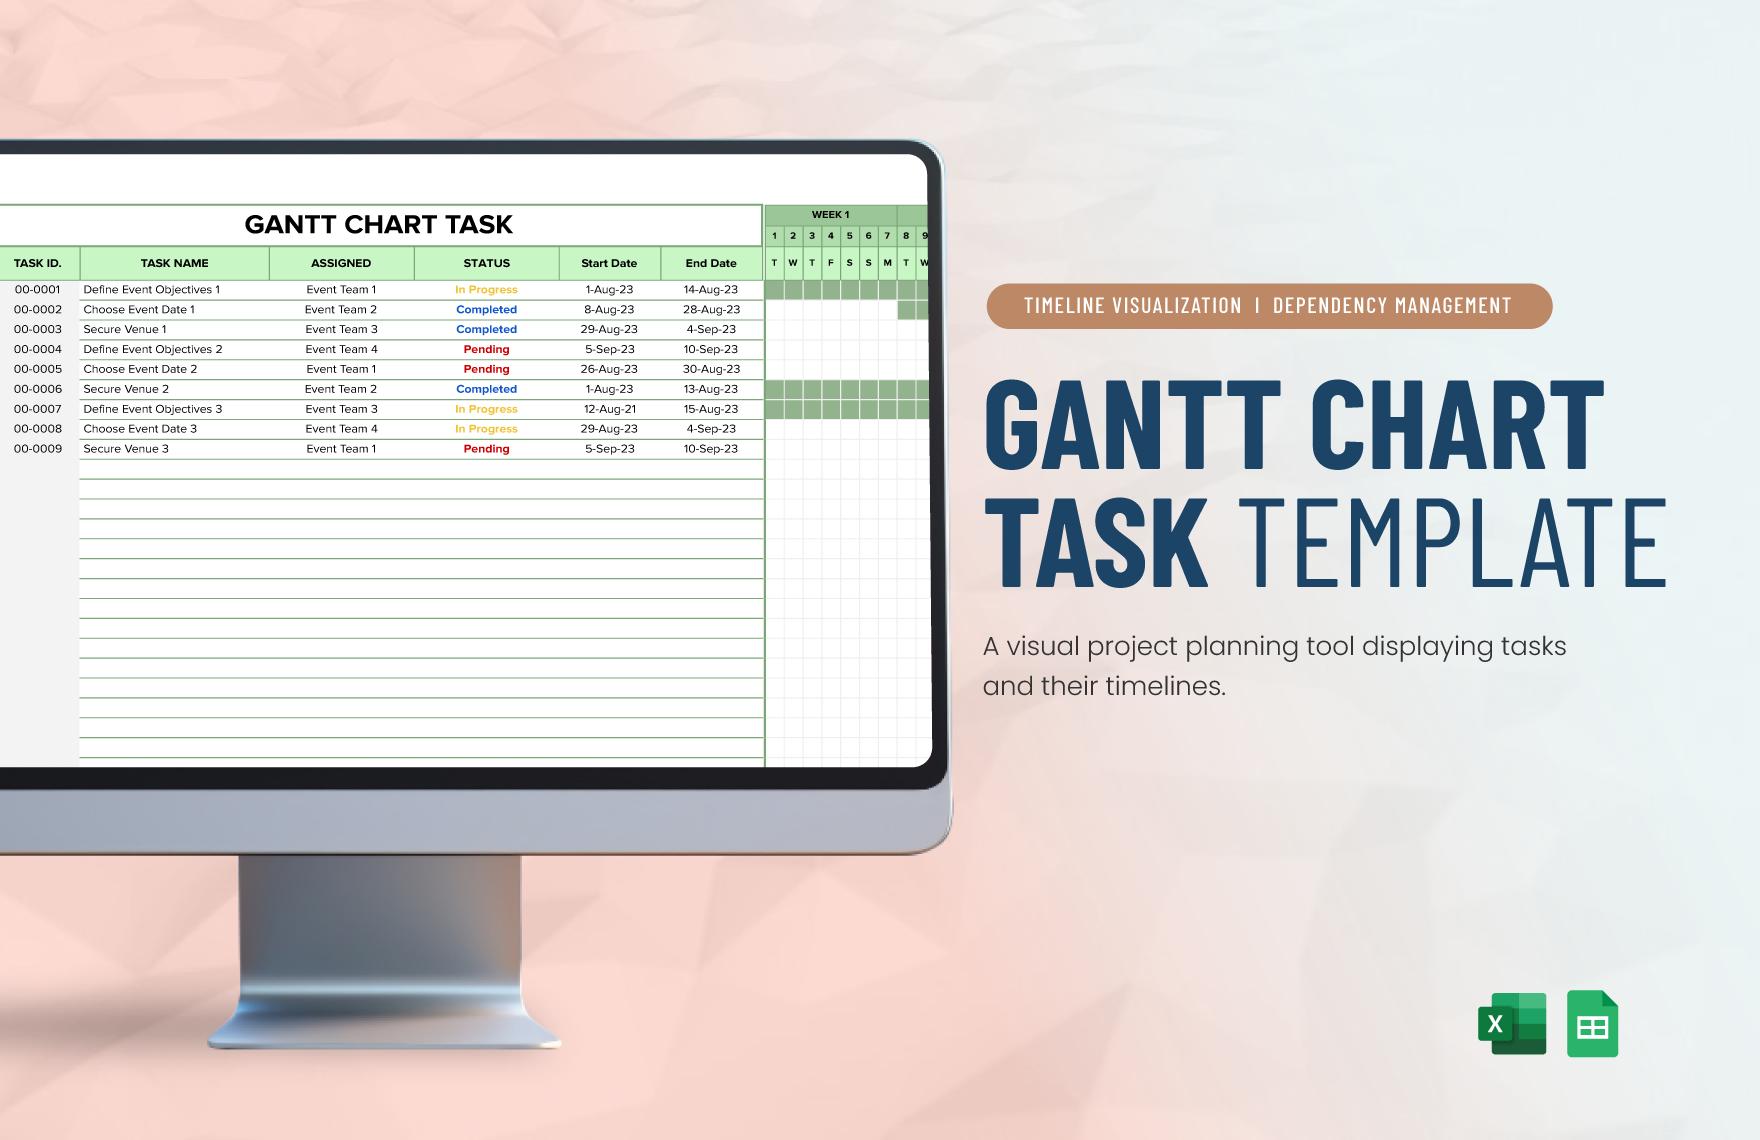
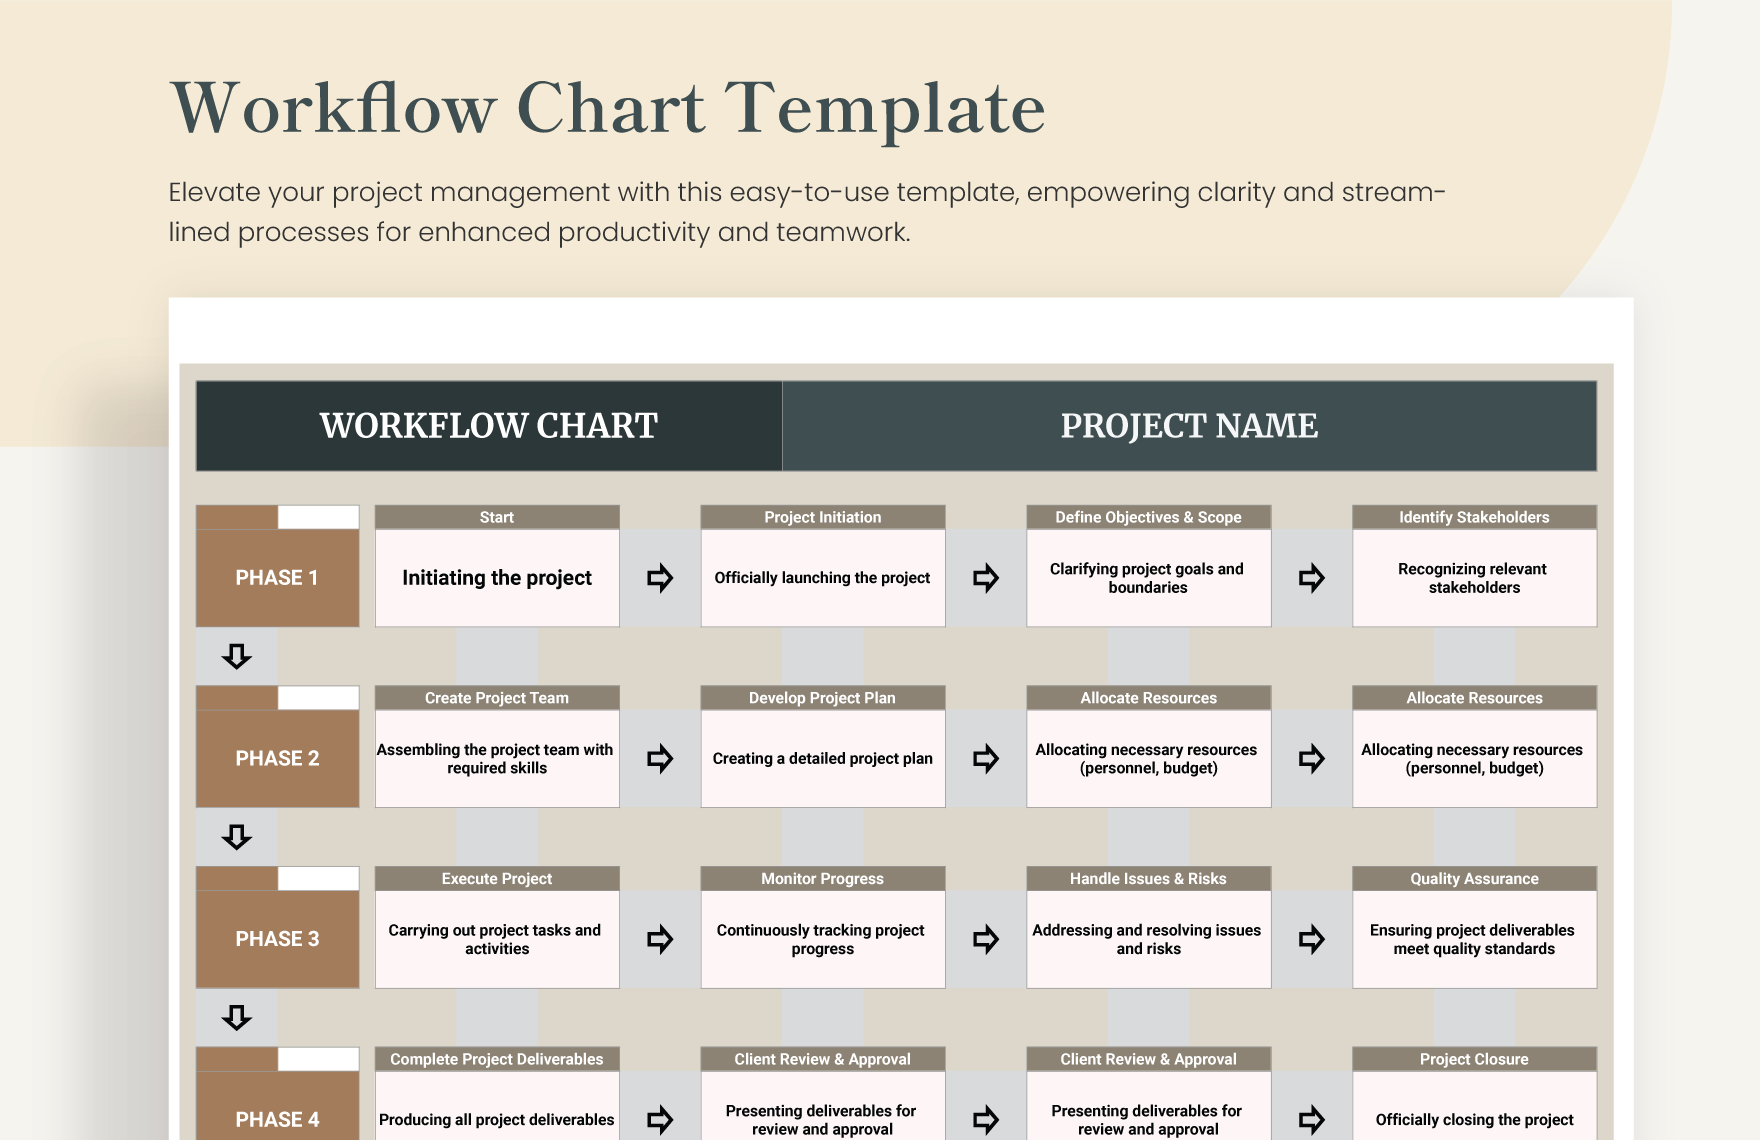
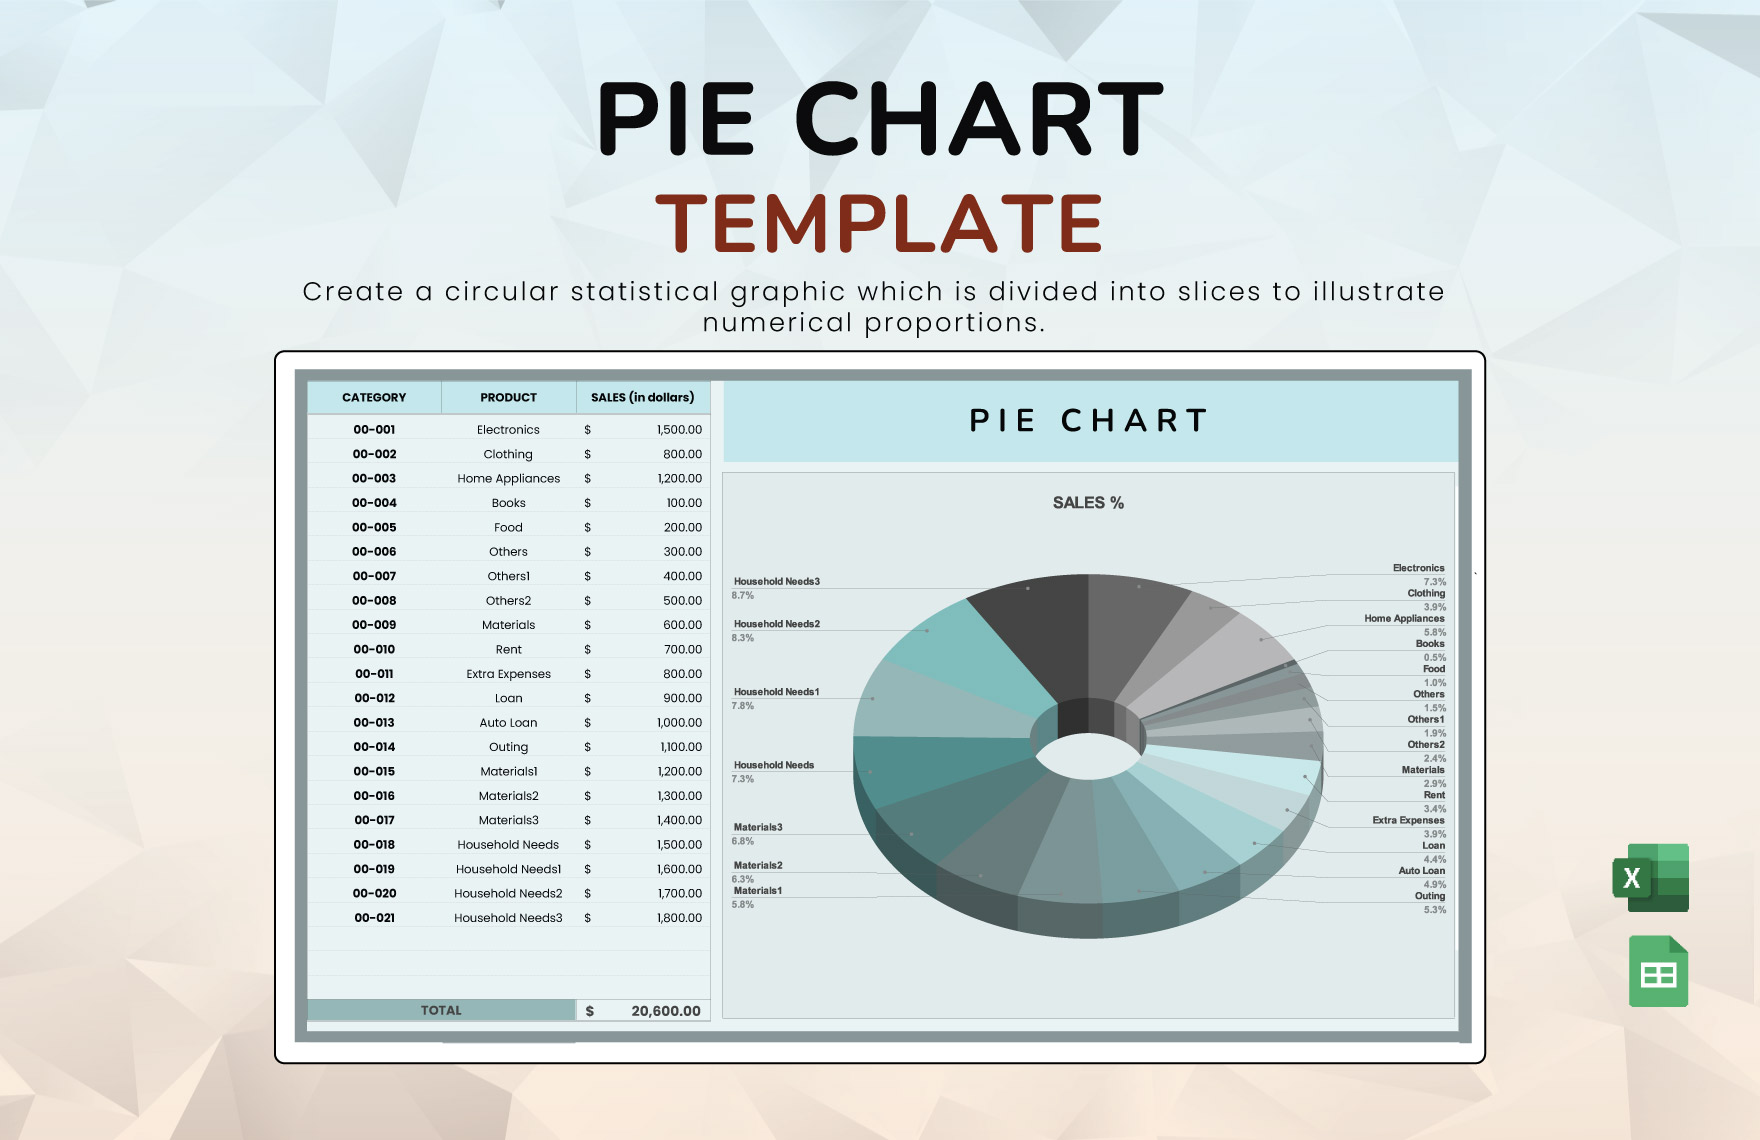
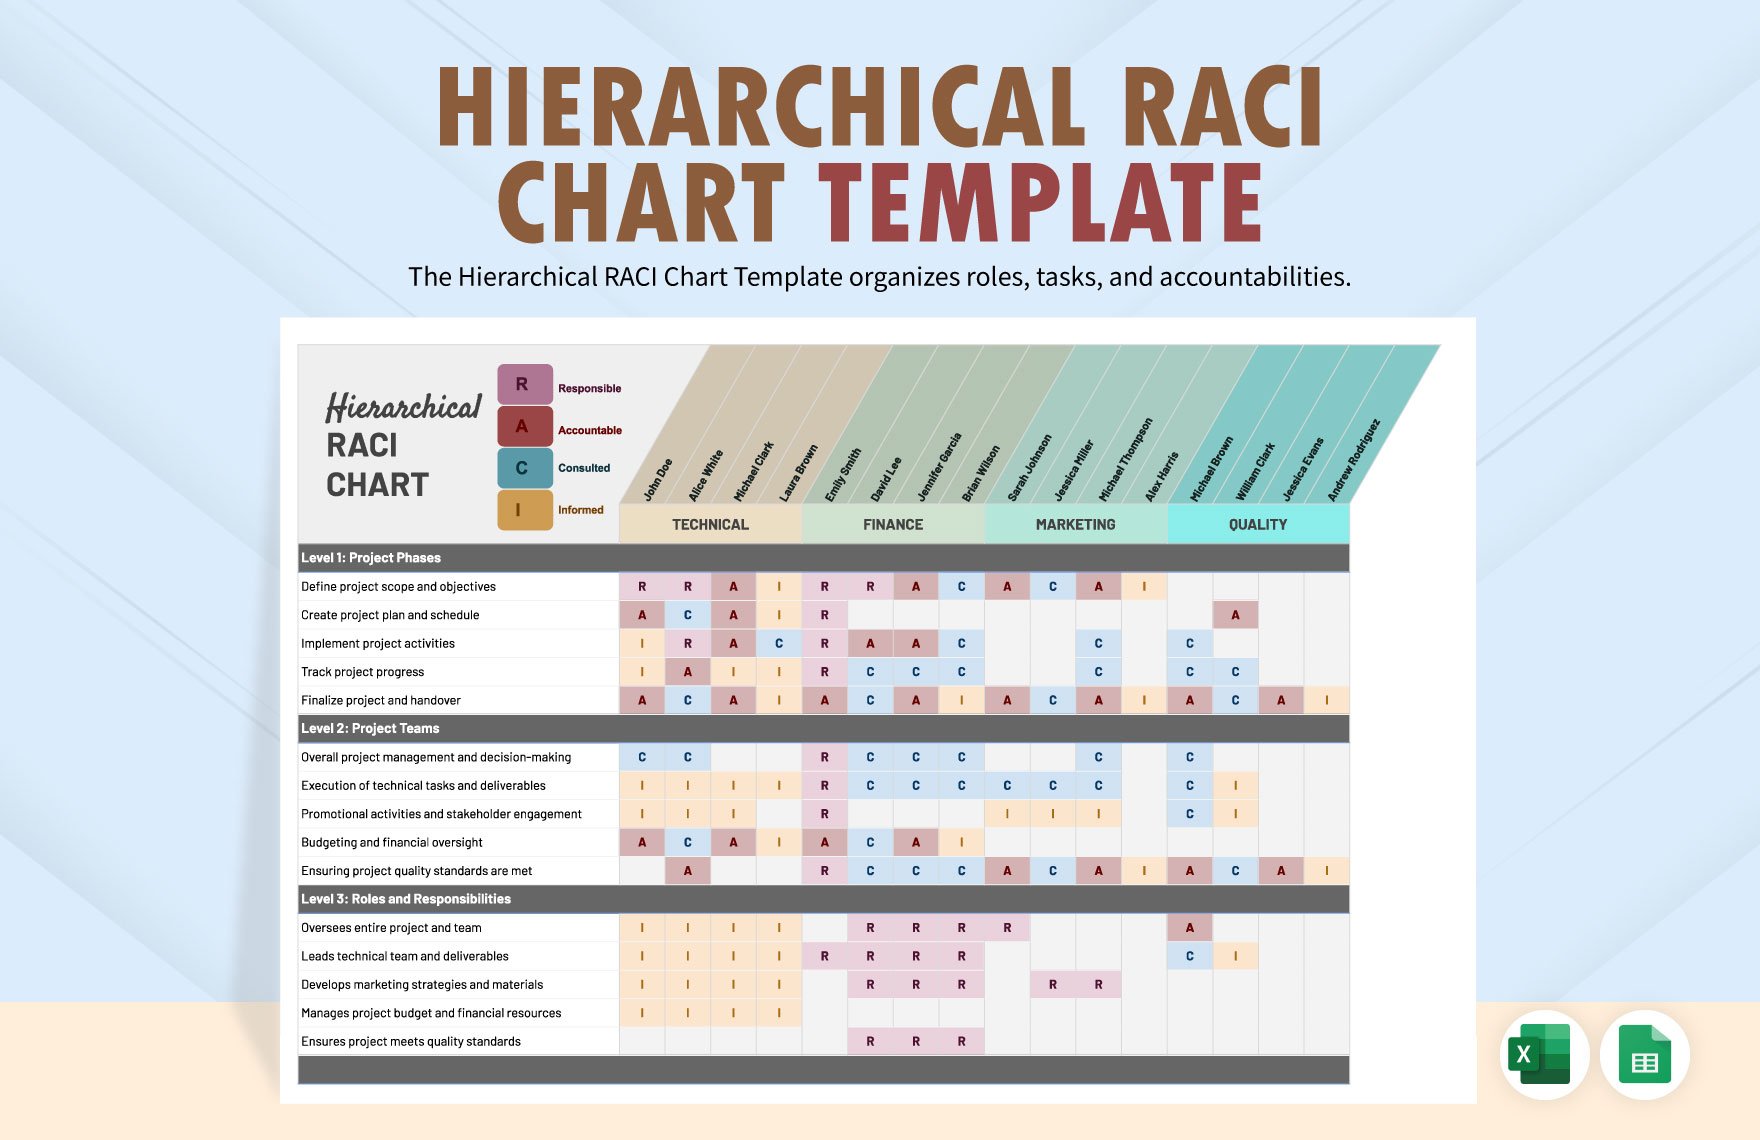
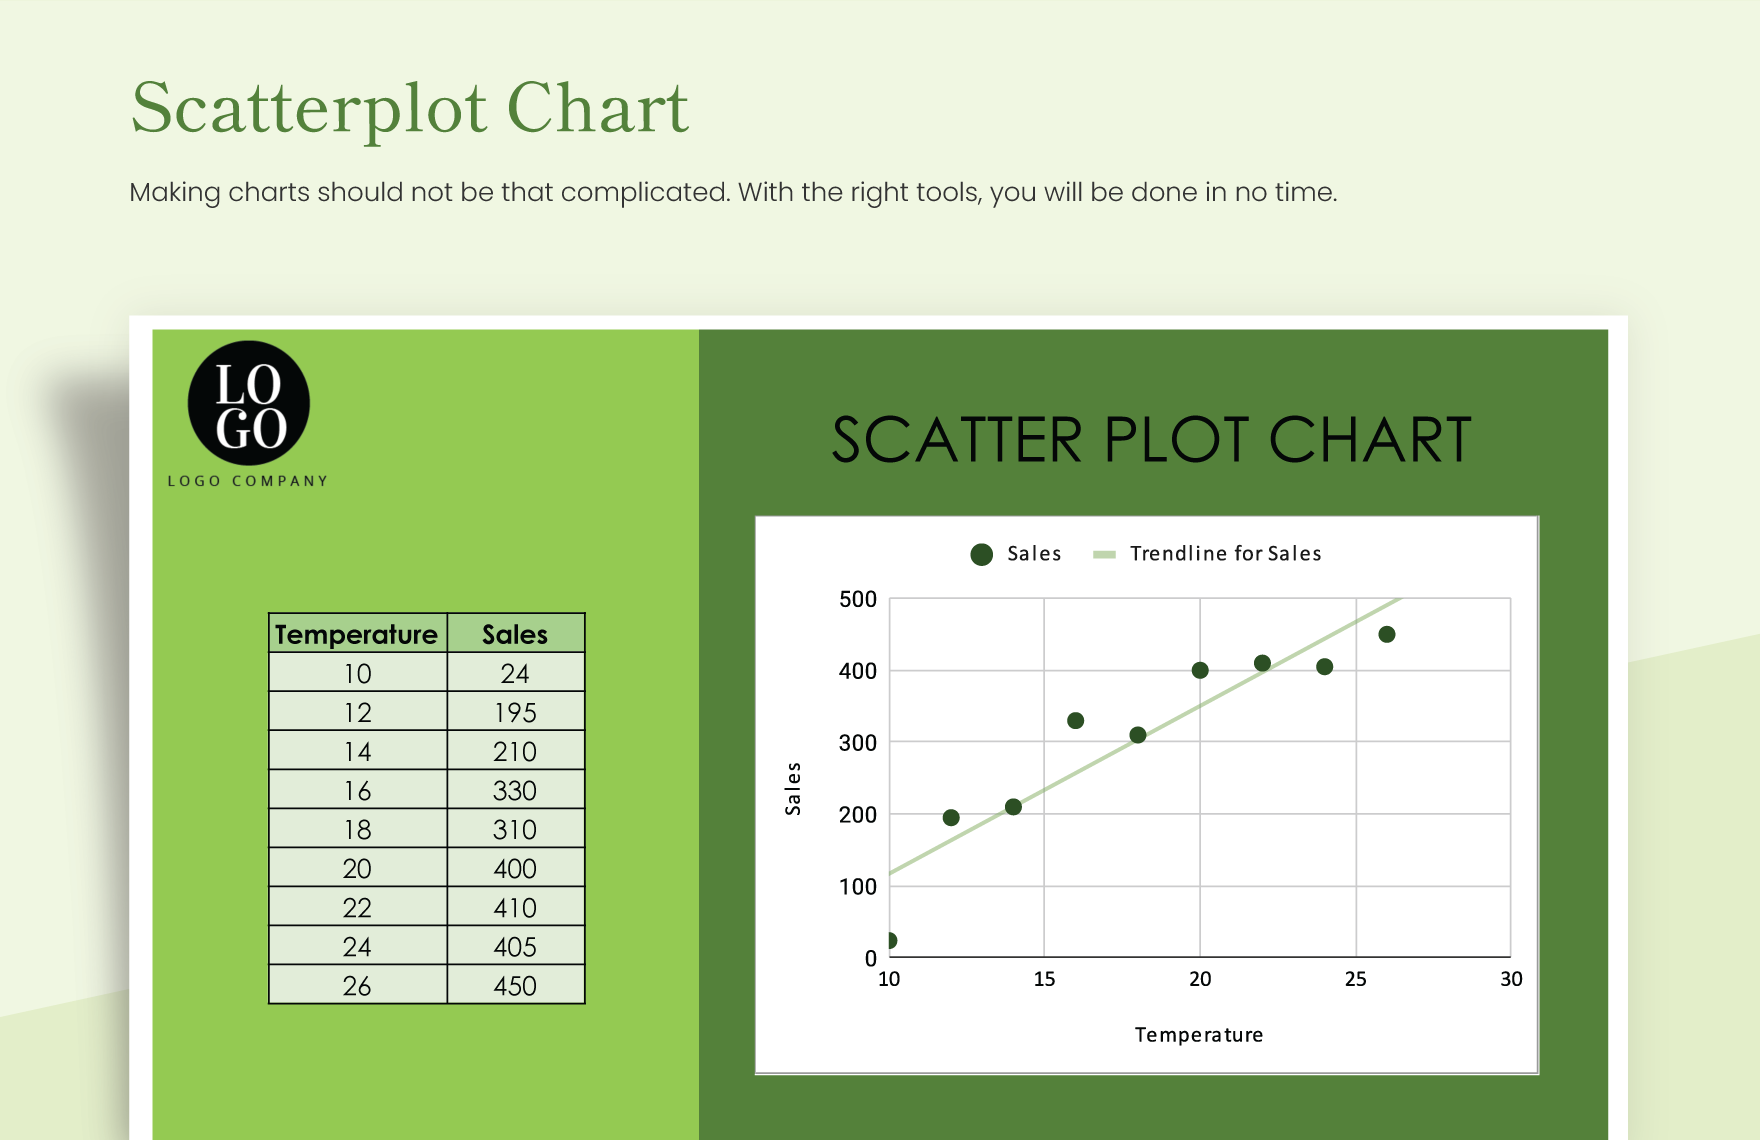
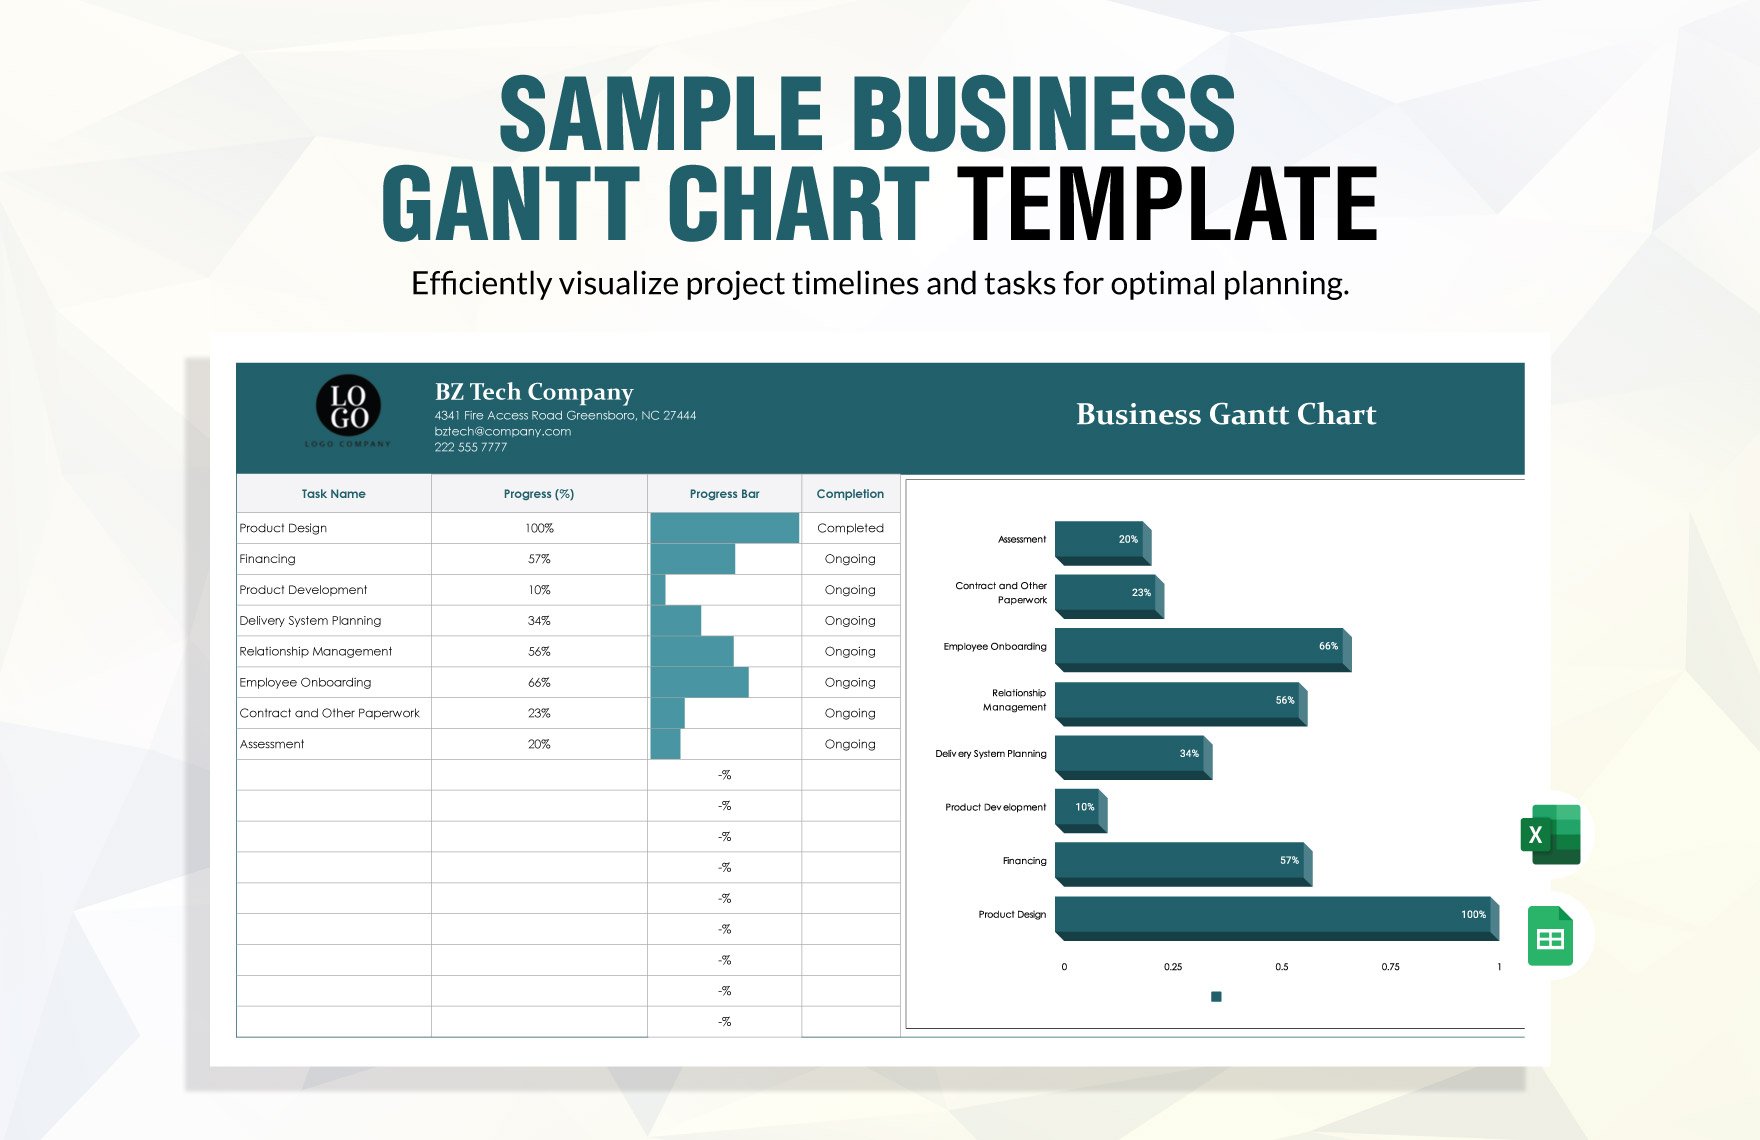
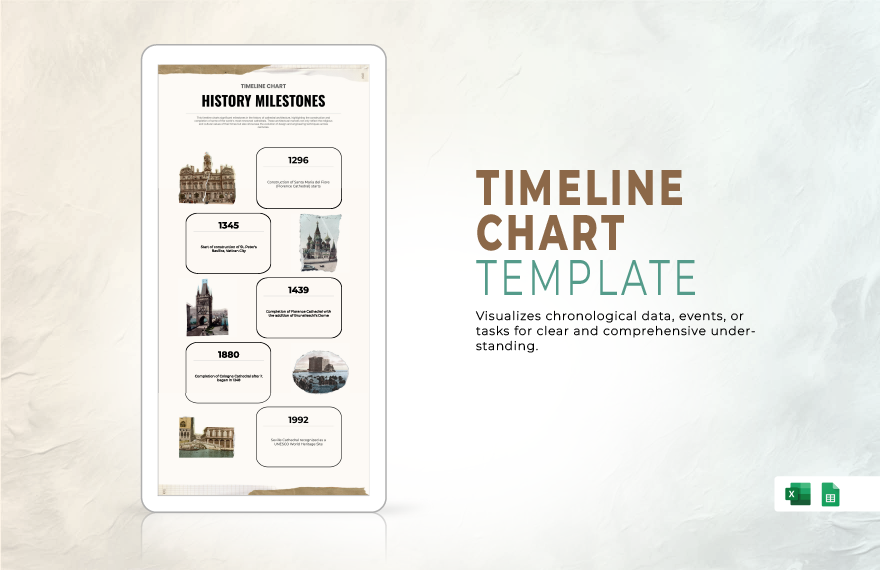
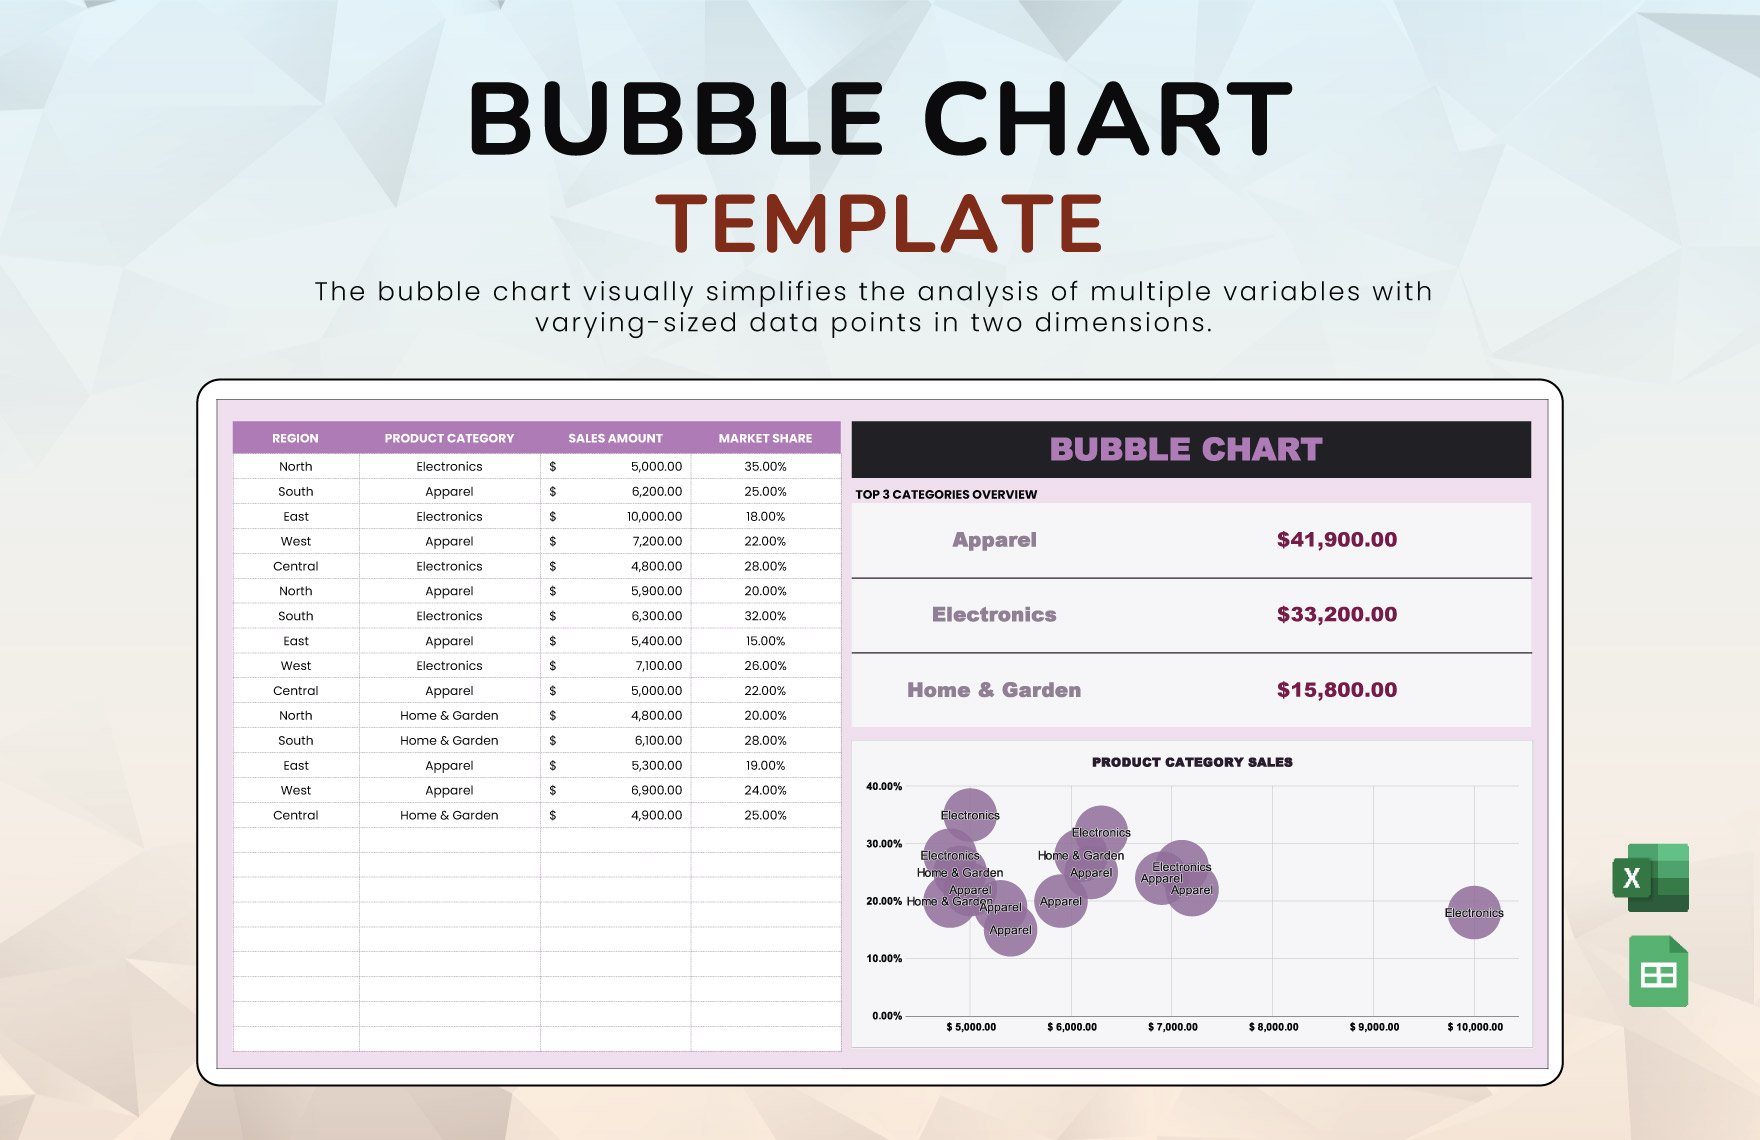
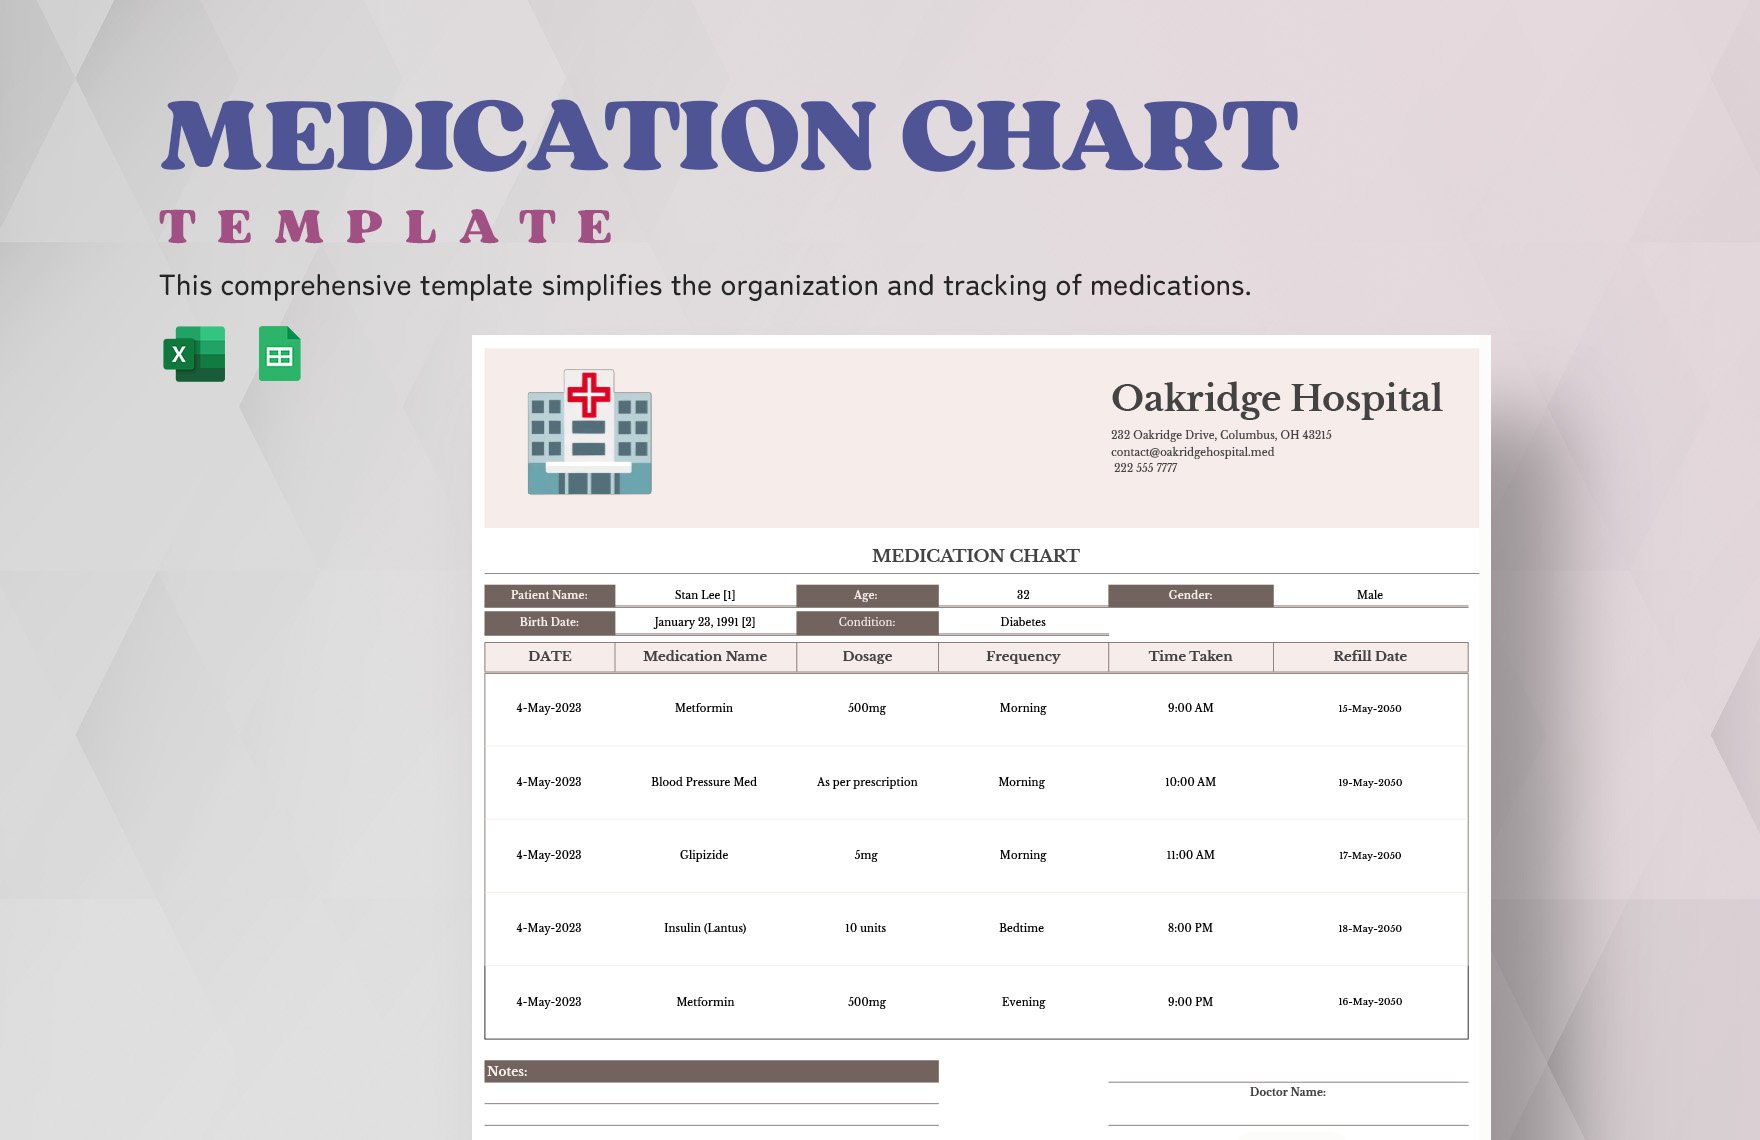
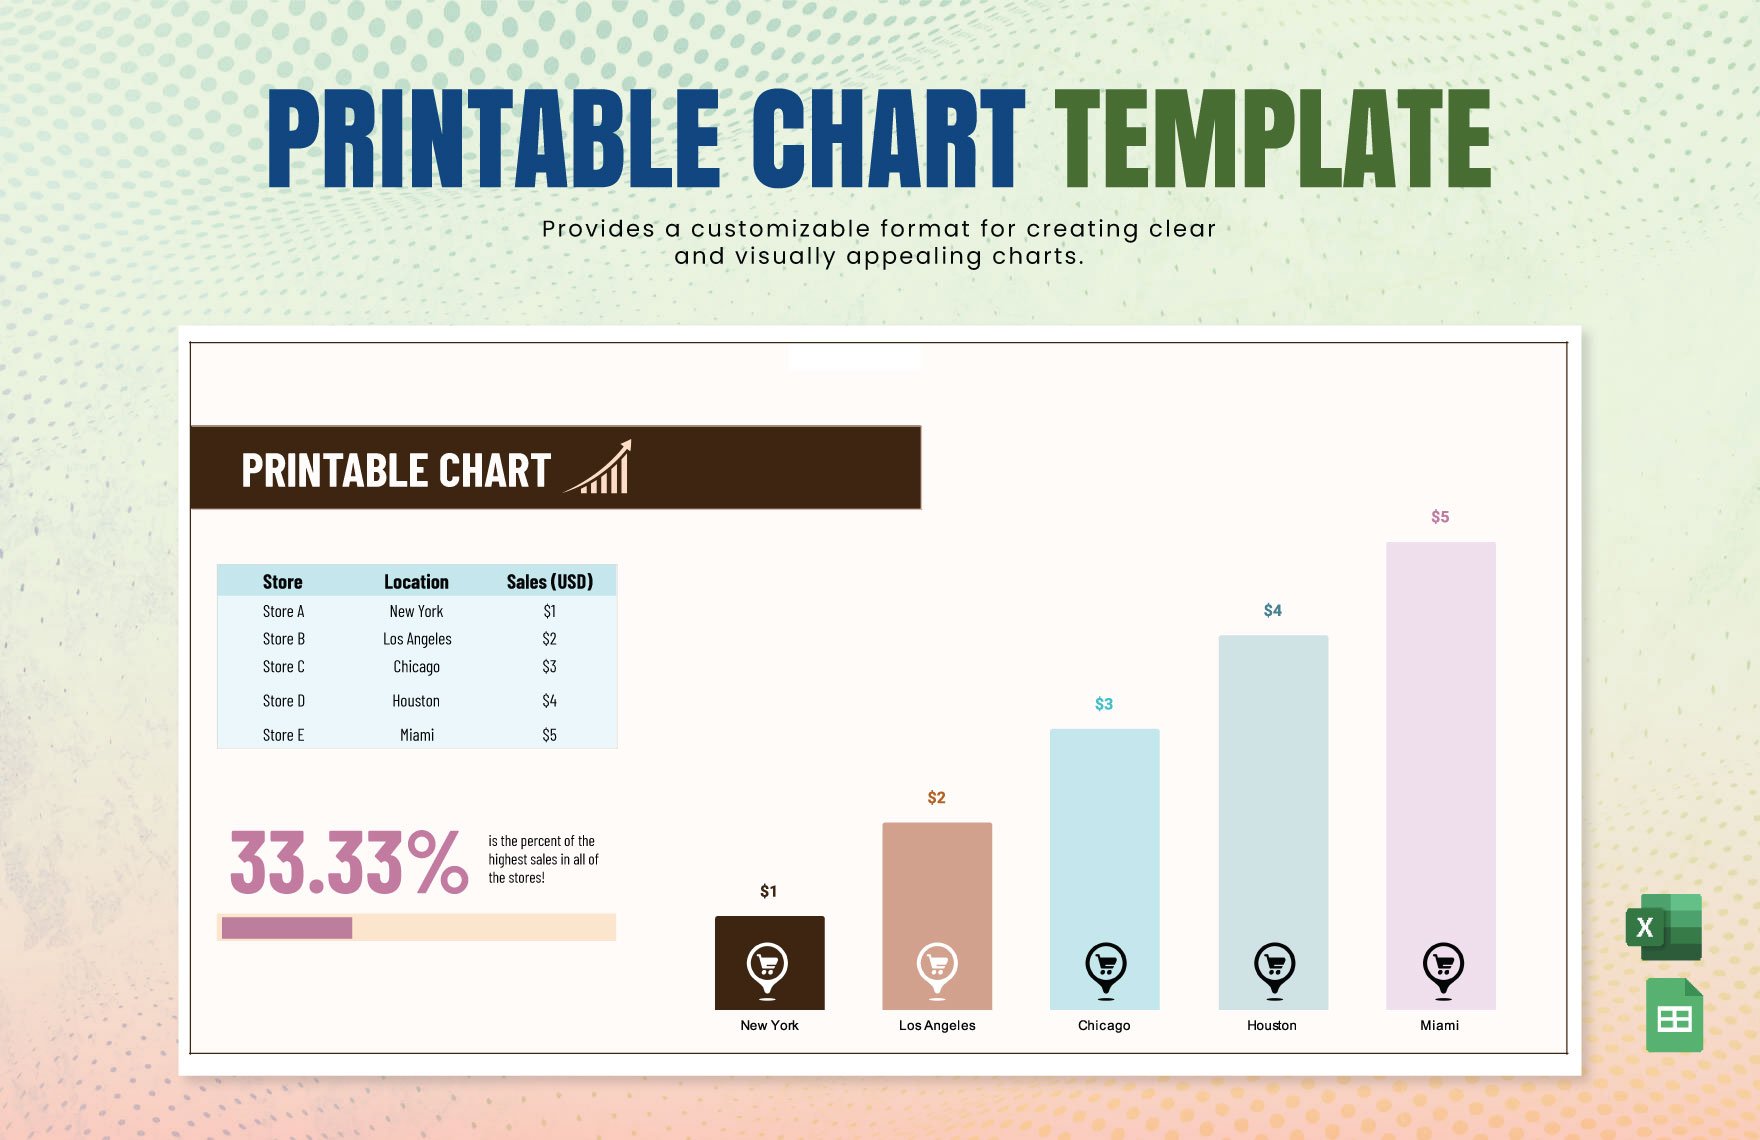
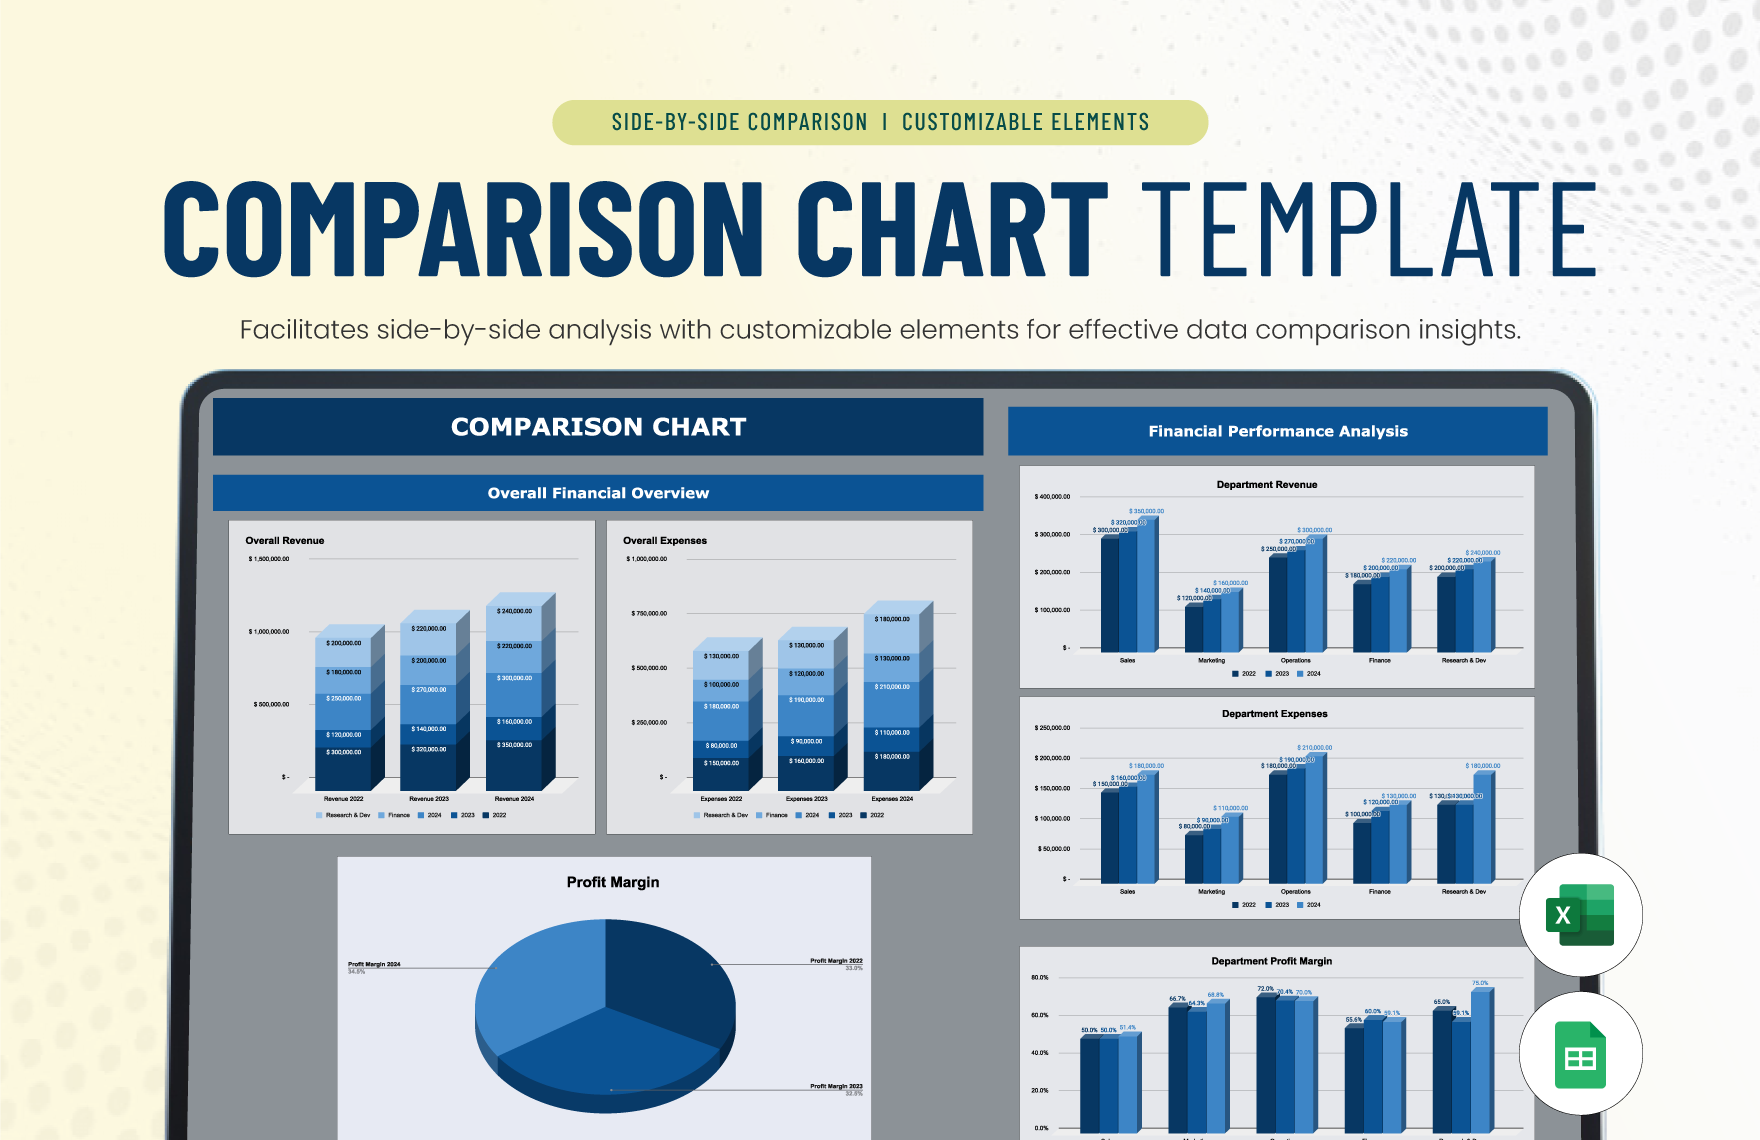
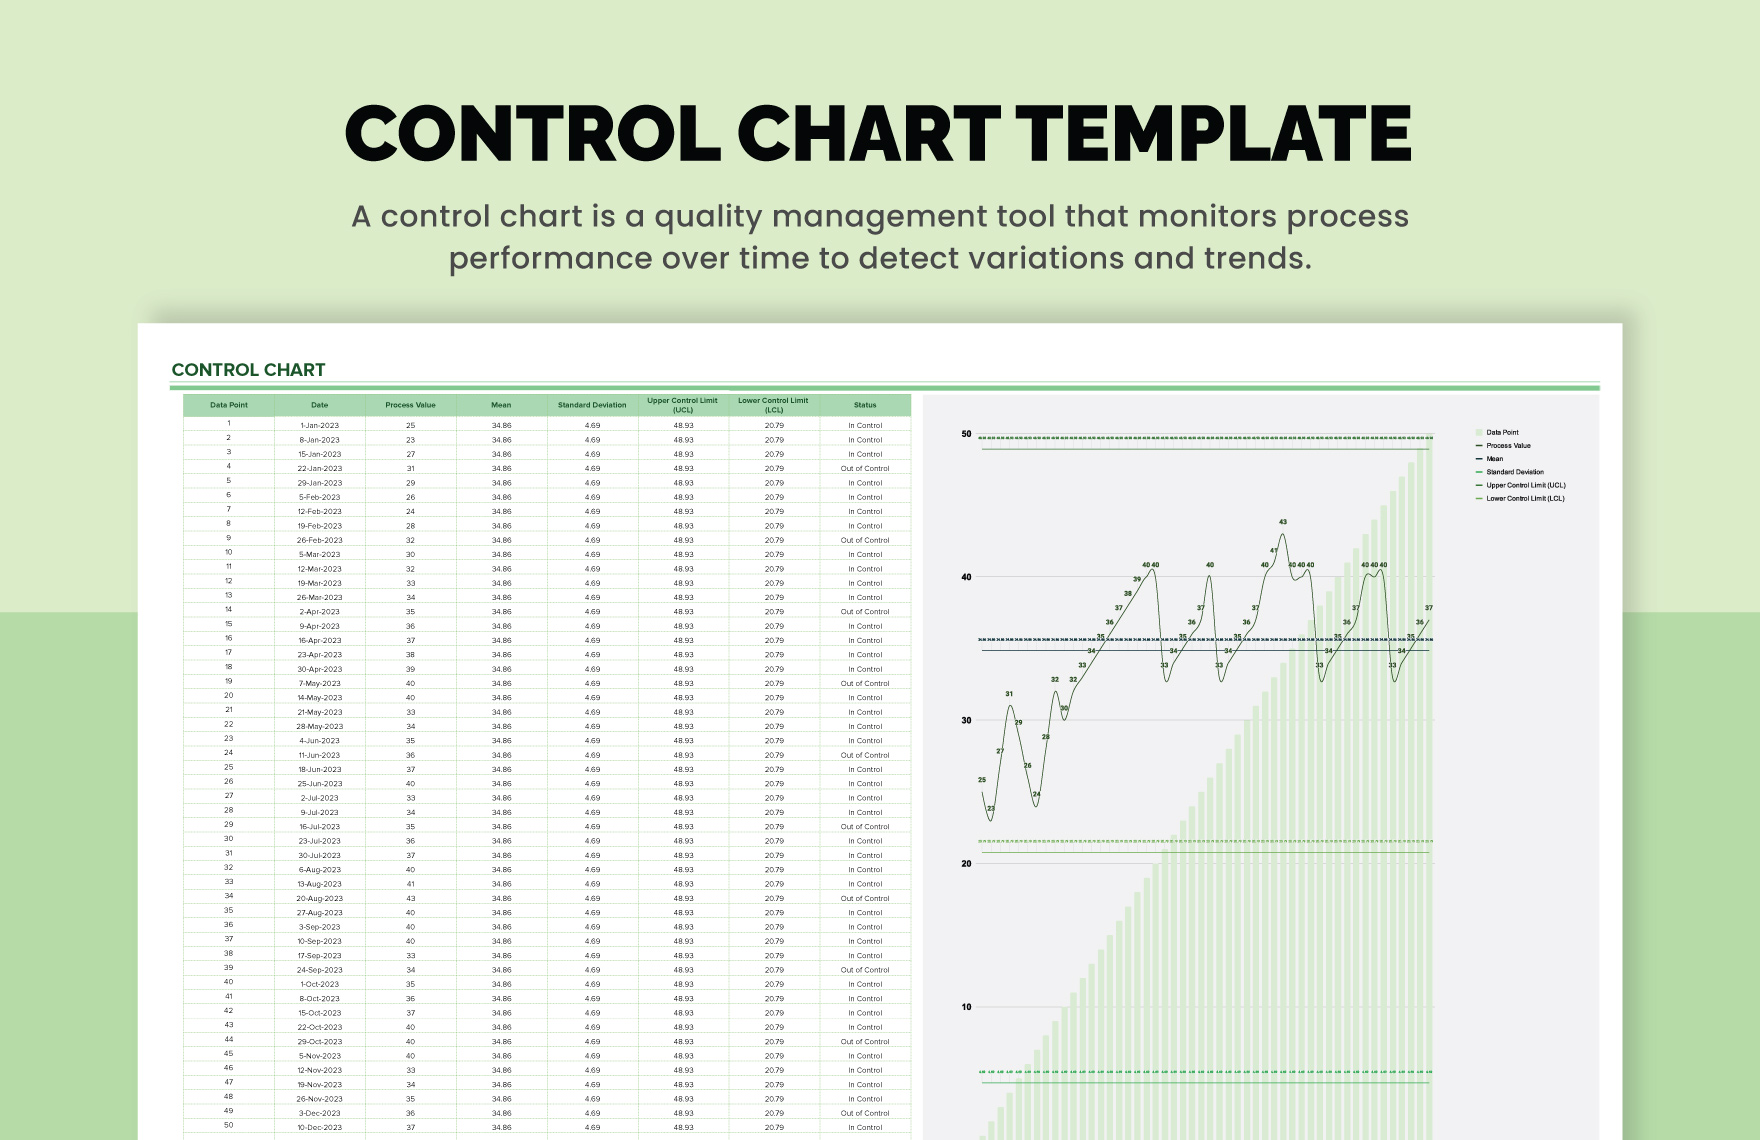
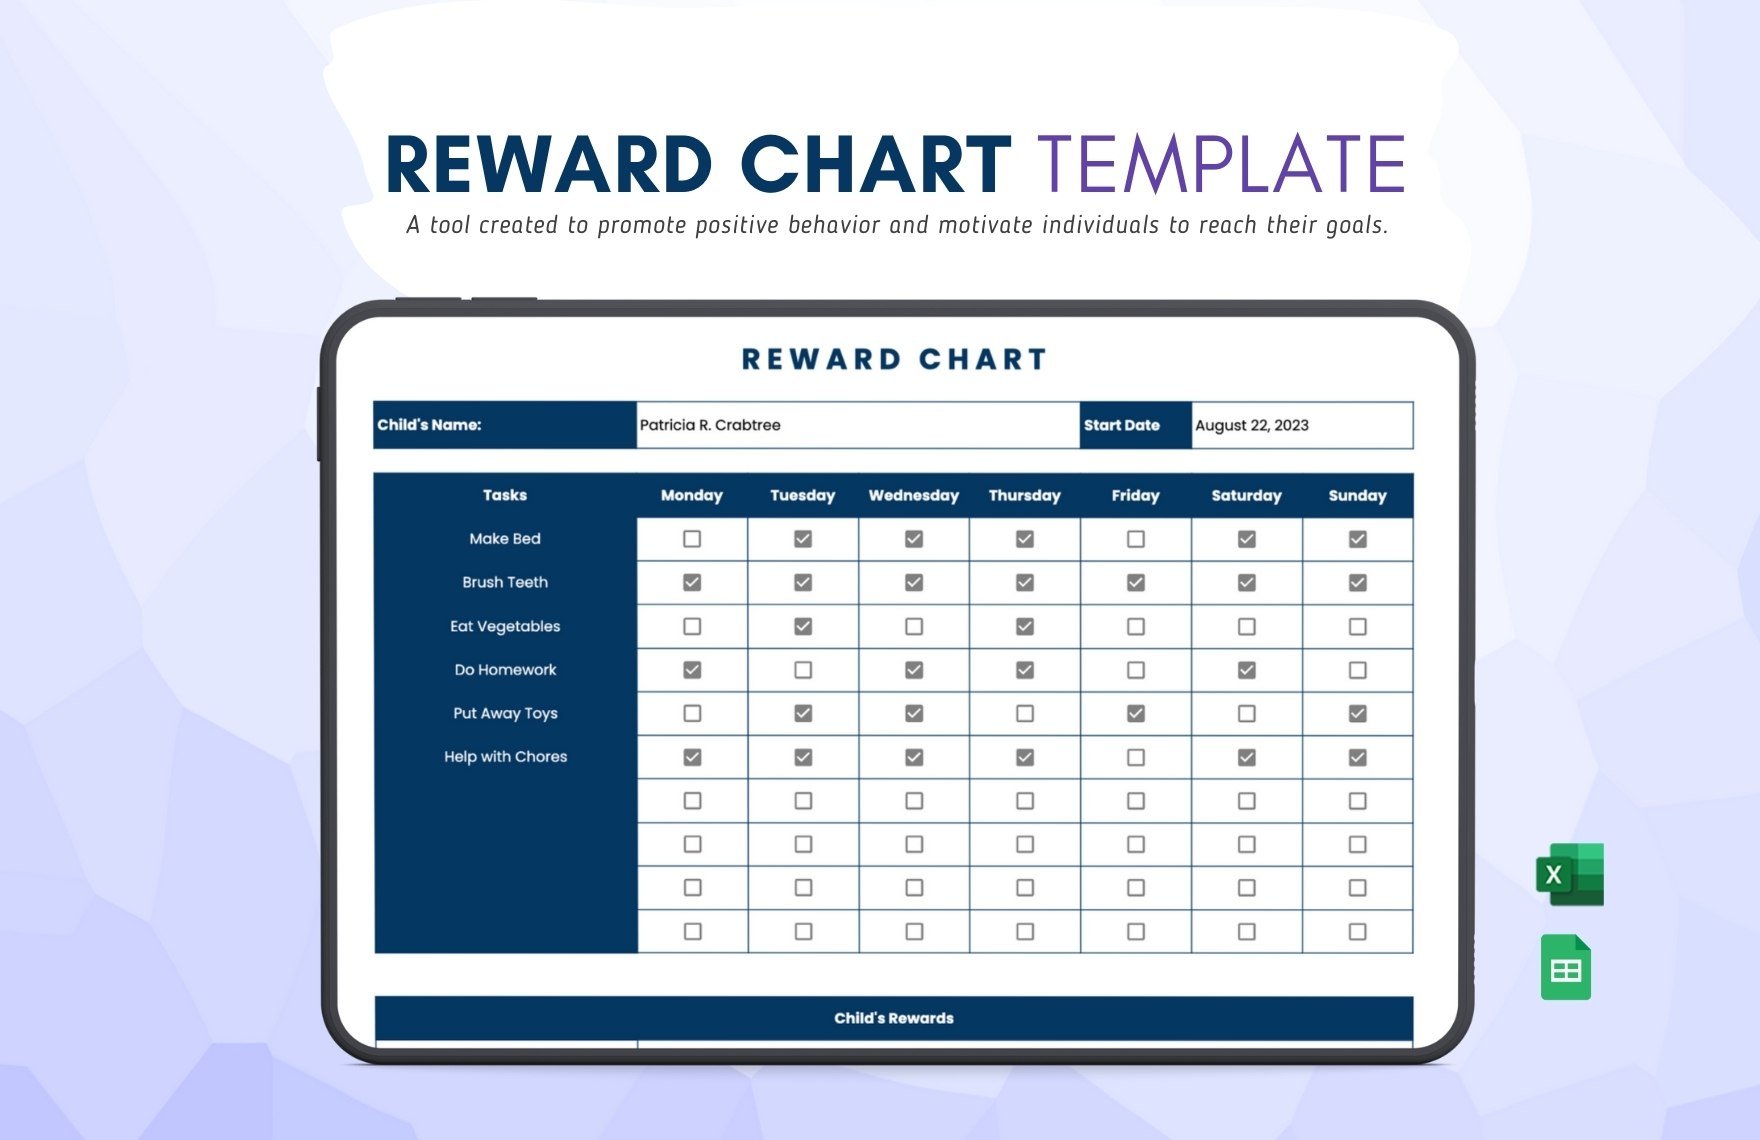
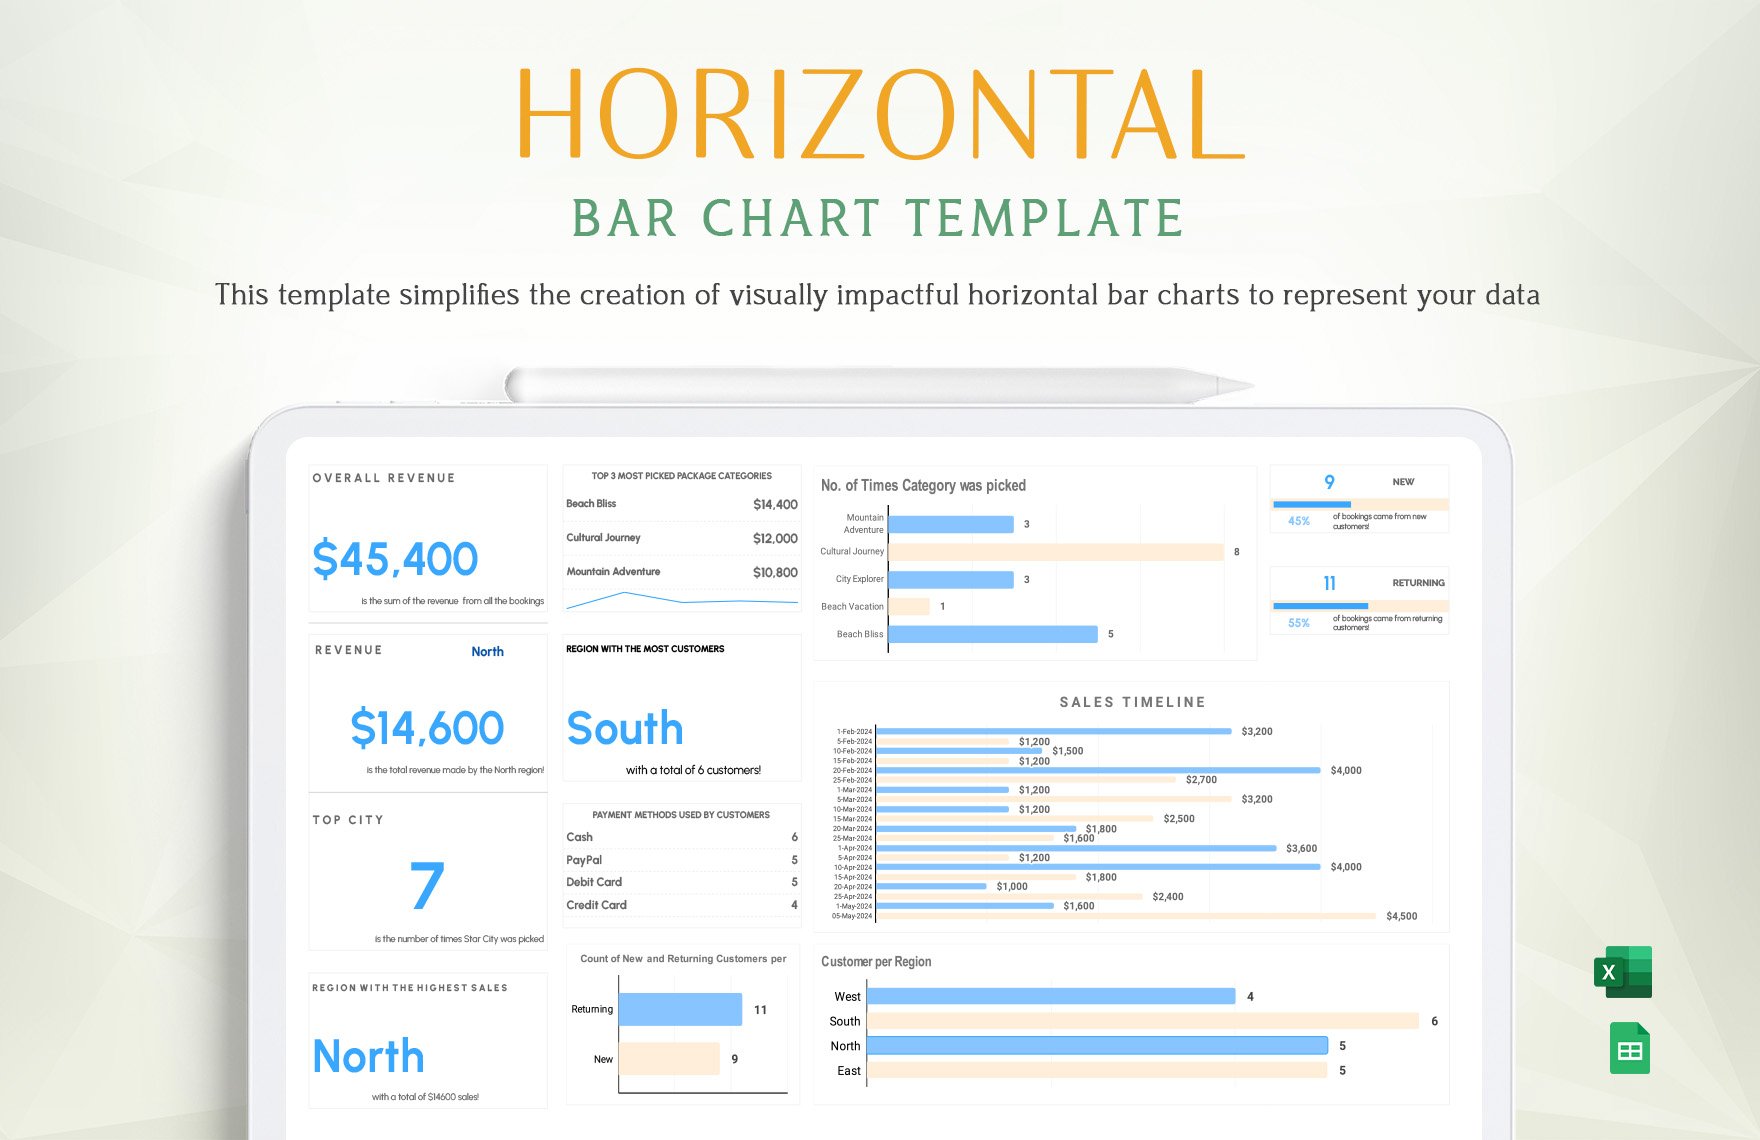
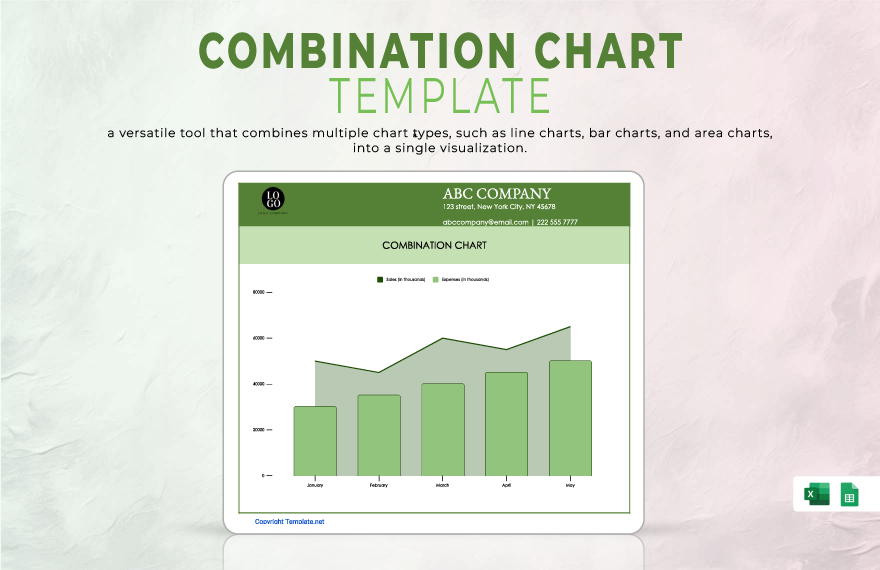
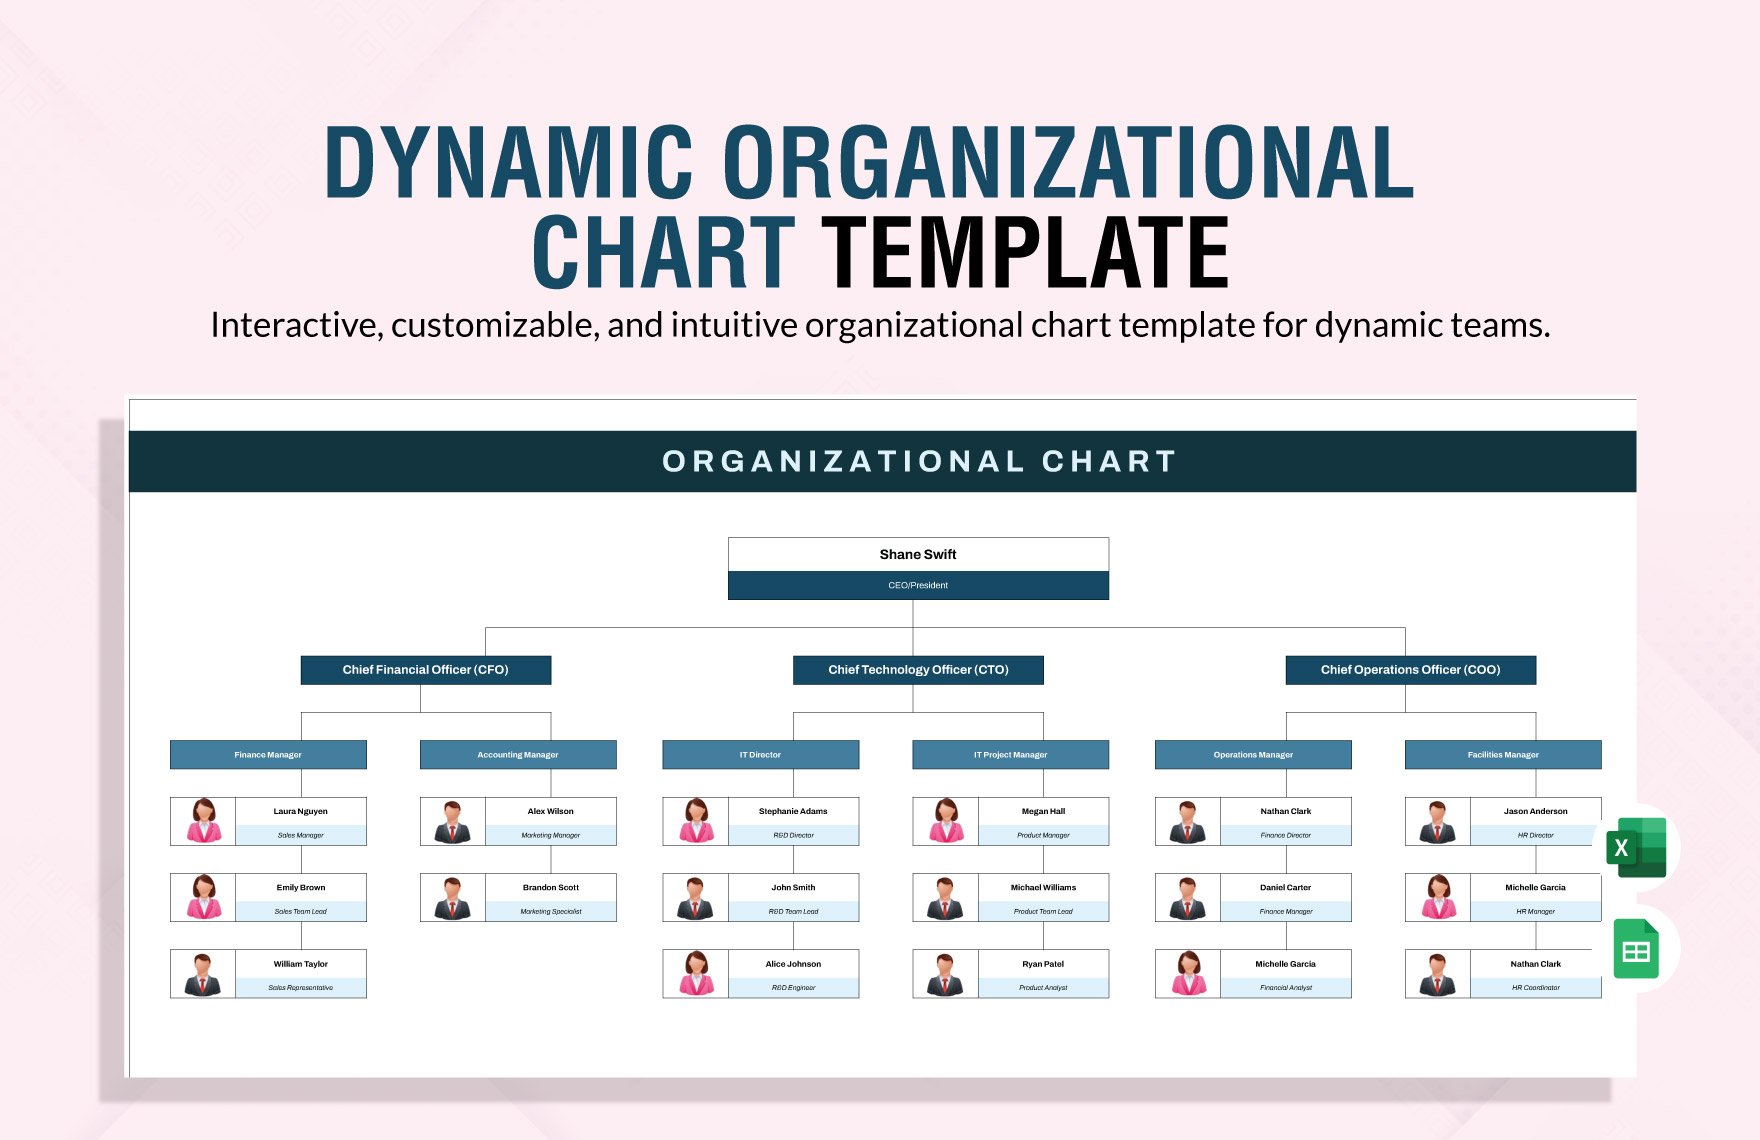
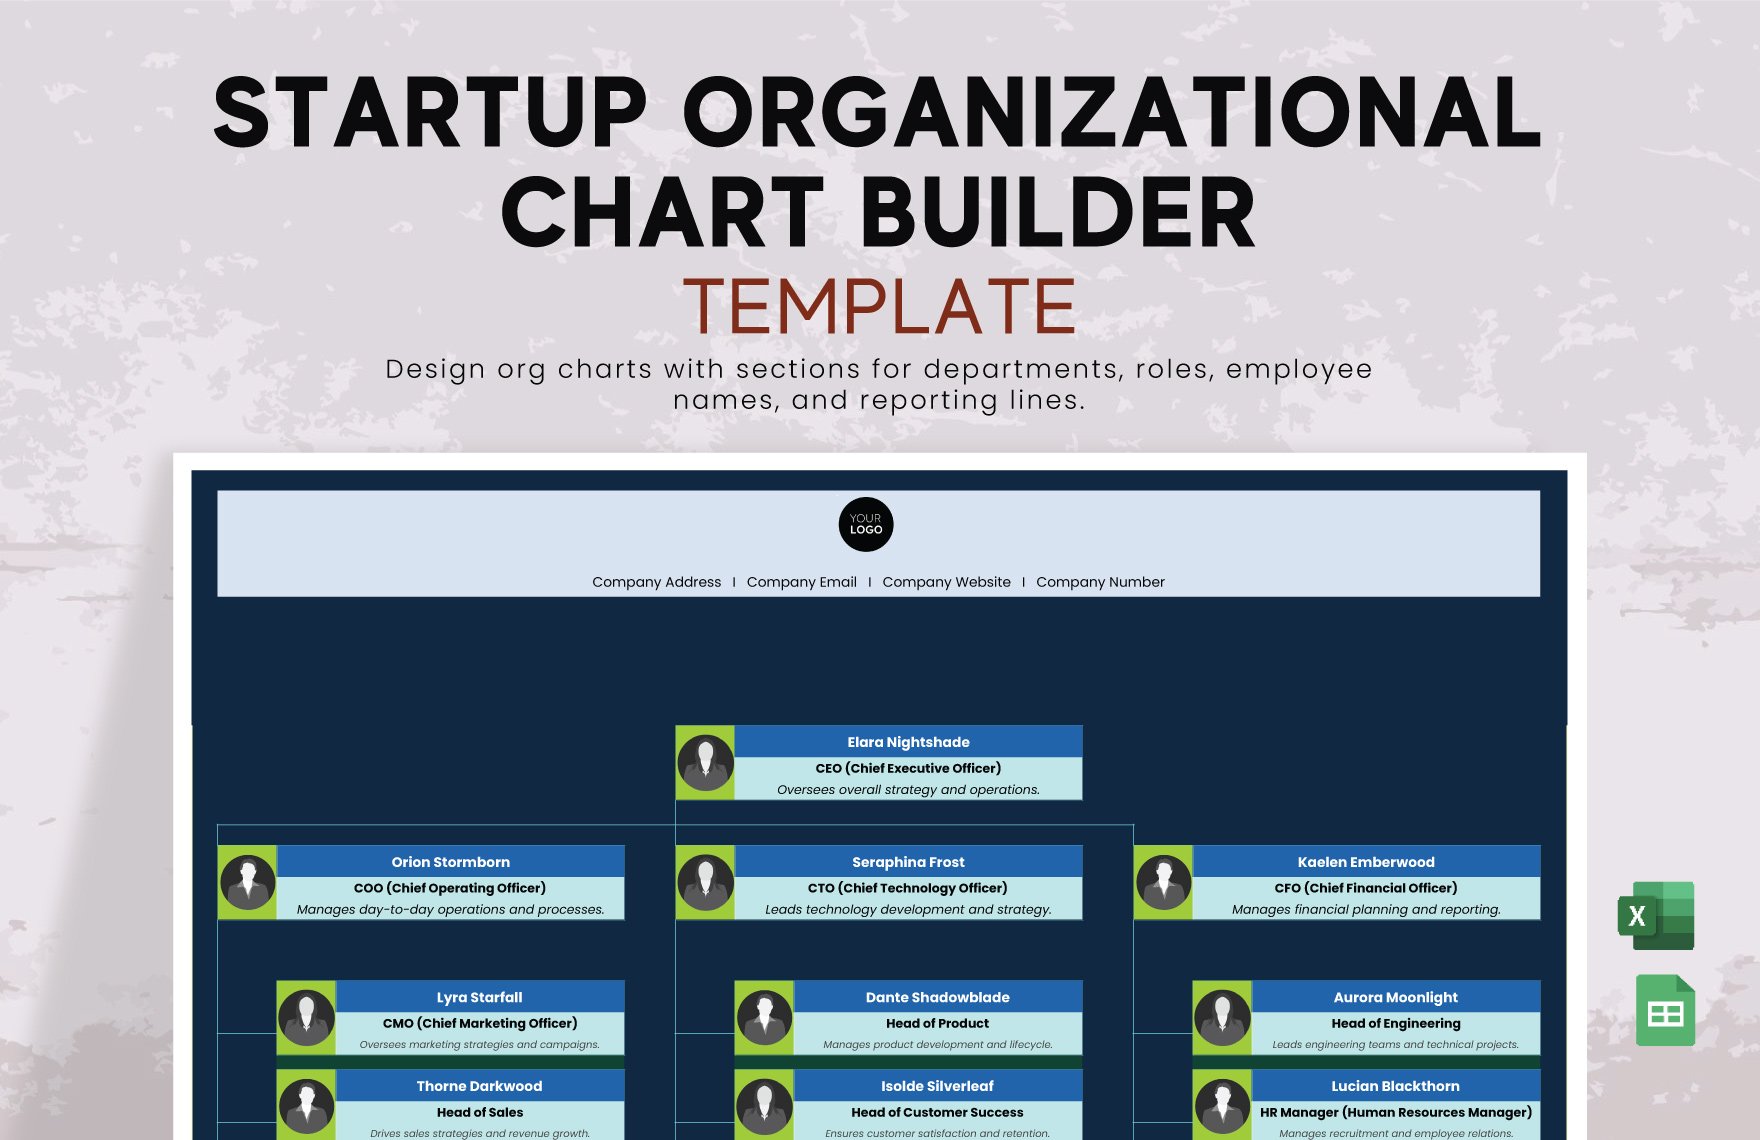
Produce a graphical representation of data in the form of a table, graph, or diagram with our ready-made chart templates. These files are easily editable and 100% customizable in several software programs, including Microsoft Excel. You can make use of our professionally designed templates in various fields such as in schools, businesses, organizations, or even for personal use. Here in template.net, we have the chart templates you need—be it an organizational chart, flowchart, pie chart, and a whole lot more! Download our chart templates now, and communicate multiple data sets effectively!
How to Create a Chart in Microsoft Excel?
Charts can simplify even the most complex data. Unlike lengthy statements and countless words, a visual representation of information makes it easier for individuals to remember essential details. Moreover, documents or articles with charts, diagrams, or graphs look more interesting than with blocks of text alone. For this reason, individuals and organizations make use of illustrations in print materials, business presentations, reports, presentation of survey results, and others. Aside from that, one can also use a chart to track performance, plot a schedule, or have an organized seating arrangement. Common types of charts include line graph, area graph, scatter plot, bar graph, and pie chart. If you need help in creating a graphical representation of numerical data or information, we got your back! Provided below are five simple steps to guide you in creating a sample chart with the use of Microsoft Excel.
1. Gather Information
Before you begin drafting a chart or graph, you first need to gather all the information which you will make a visual presentation of. If you are about to create a wedding seating chart for a smooth-flowing seating process, make sure that you have a list of the guests who confirmed their attendance for the event. Regardless of the type of chart, you are going to make, be it an organizational chart, flow chart, Gantt chart, pie chart, etc., gathering the necessary information is an essential step. It helps you create a graph or diagram with no hassle later on.
2. Open Microsoft Excel
Microsoft Excel is a spreadsheet program that has built-in features enabling users to map or plot a graph for both qualitative and quantitative data. Through this program, you can create any type of chart you want based on the data you have at hand. Whether you are creating a Gantt chart, line graph, bubble chart, budget worksheet, organizational flow chart, or other kinds of chart, Microsoft Excel will make the process easier for you.
3. Enter Data
Before typing in the information, be sure to determine if it is quantitative or qualitative. For quantitative data, you may create a bar graph, histogram, pie chart, or scatter plot. On the other hand, you can present qualitative data through infographics and timeline chart. For numerical information, you first need to type in the data on the blank cells of the spreadsheet. Make sure that you categorize them in a table-like manner for it to make sense when you insert a graph afterward. However, if you are creating an organizational chart or flowchart, you can insert the shapes first and fill it thereafter.
4. Insert Graph
After typing in the information, Microsoft Excel recommends different types of charts you can make use of to present your data. To insert a graph or chart in Microsoft Excel, you first need to select the cells which contain the information. Be sure to select everything, including the titles and labels. Then, click Insert > Chart and choose a chart type. Now, you have a graph or chart on the spreadsheet.
5. Proofread
Lastly, check the information from the chart title to the multiple data series. Leave no room for errors before you print, publish, or post your chart. As an alternative, you may download our ready-made infographic and chart templates. With our templates, you won’t have to create a chore chart from scratch.


