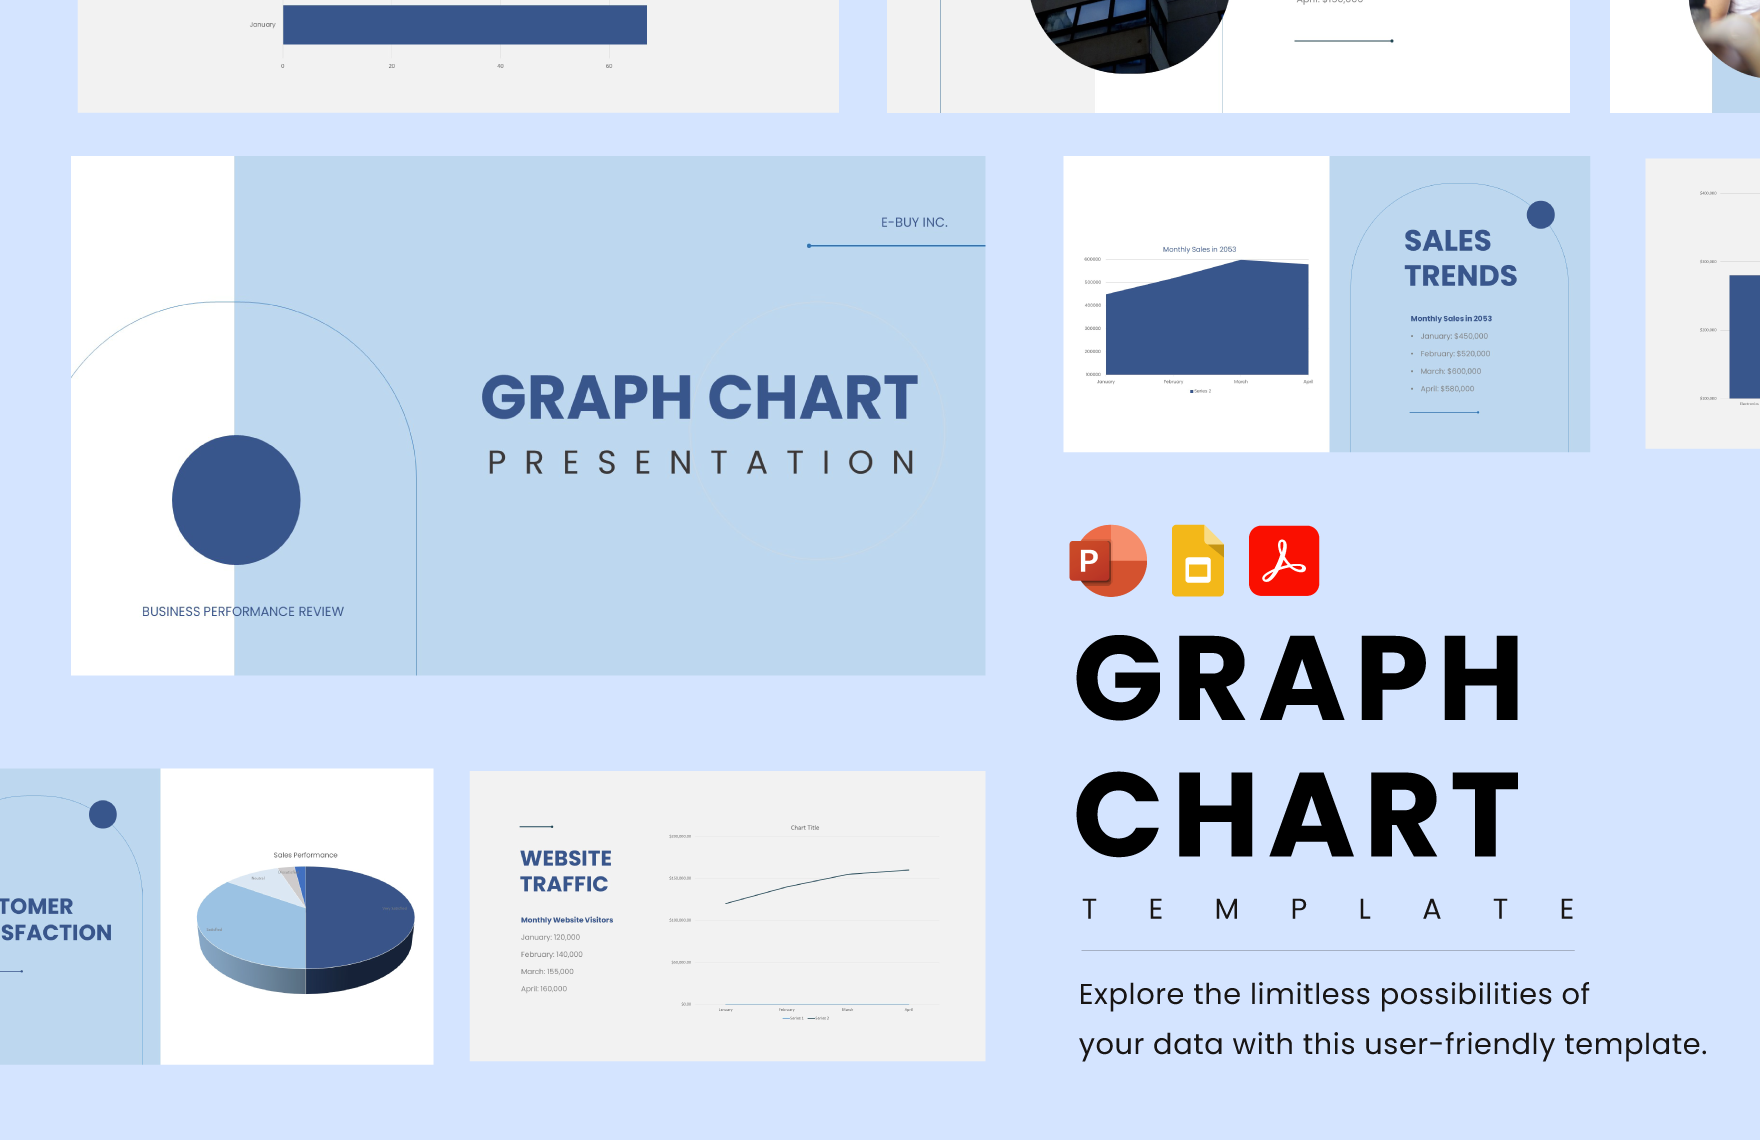
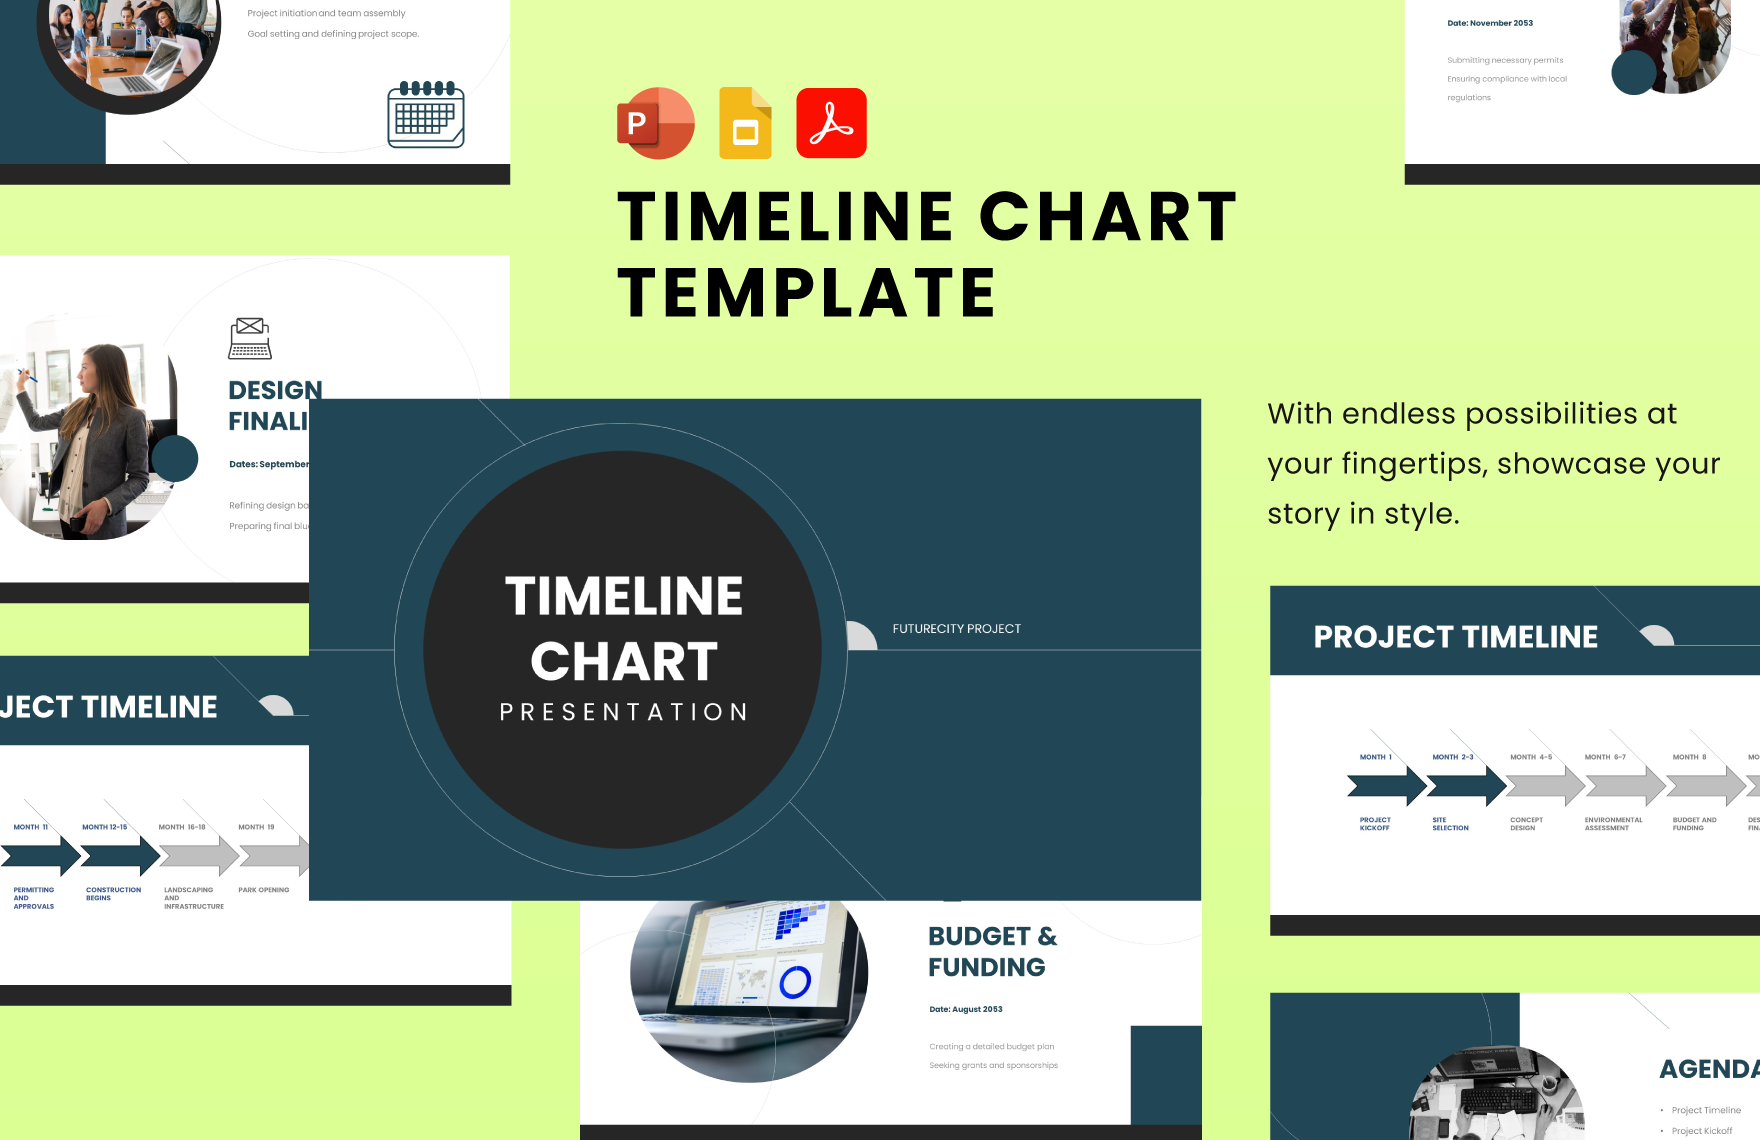
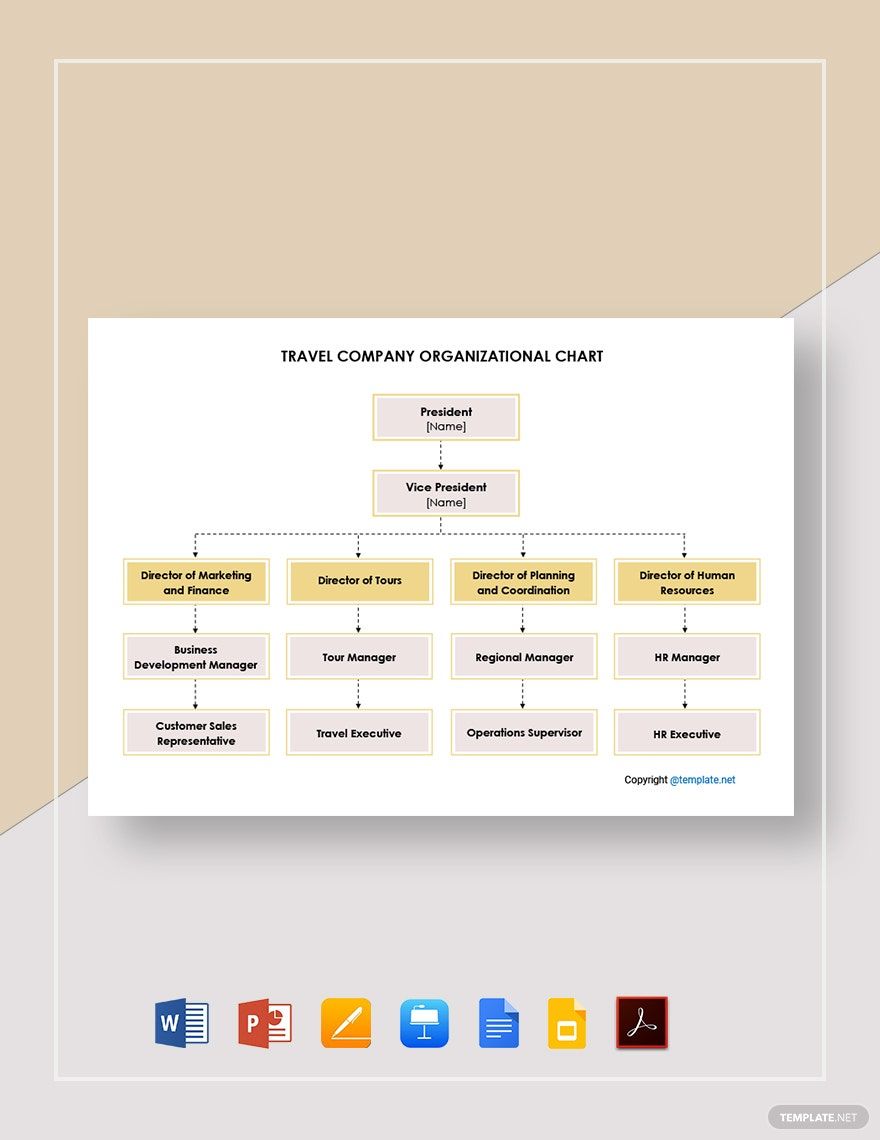
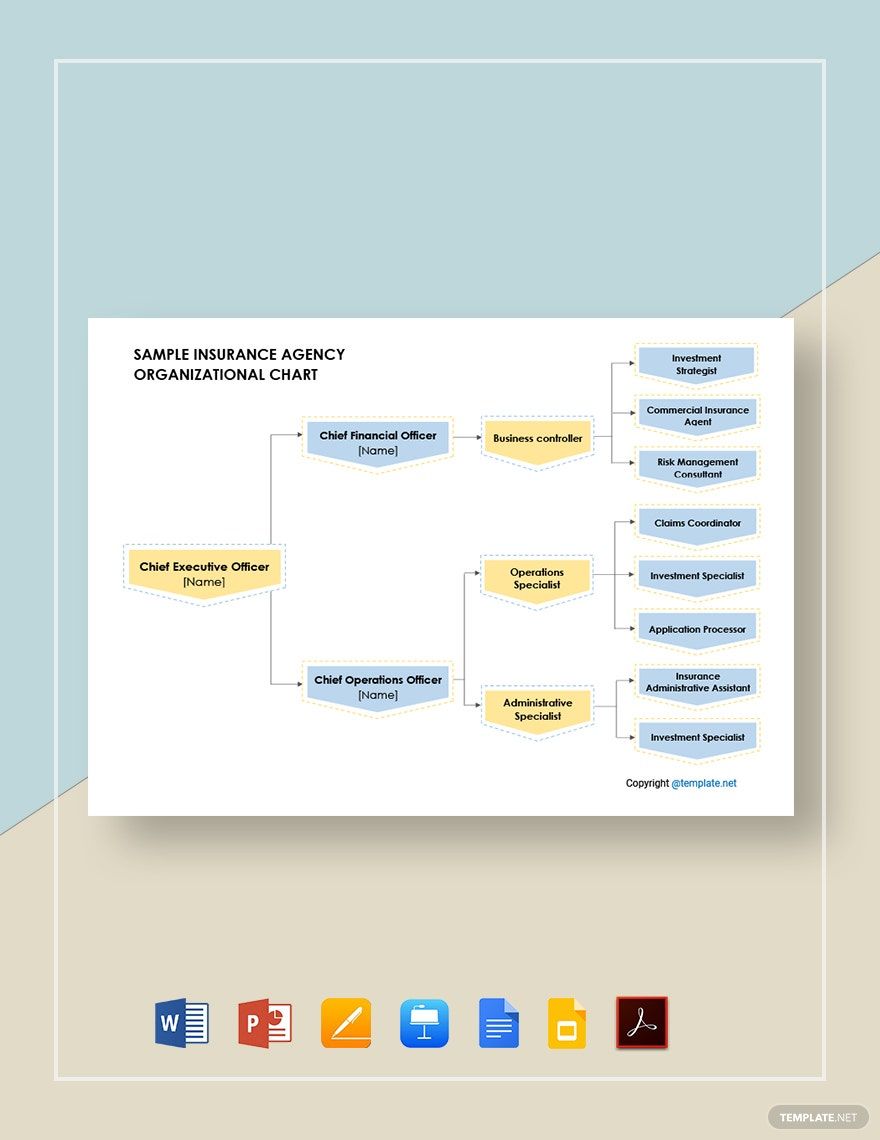
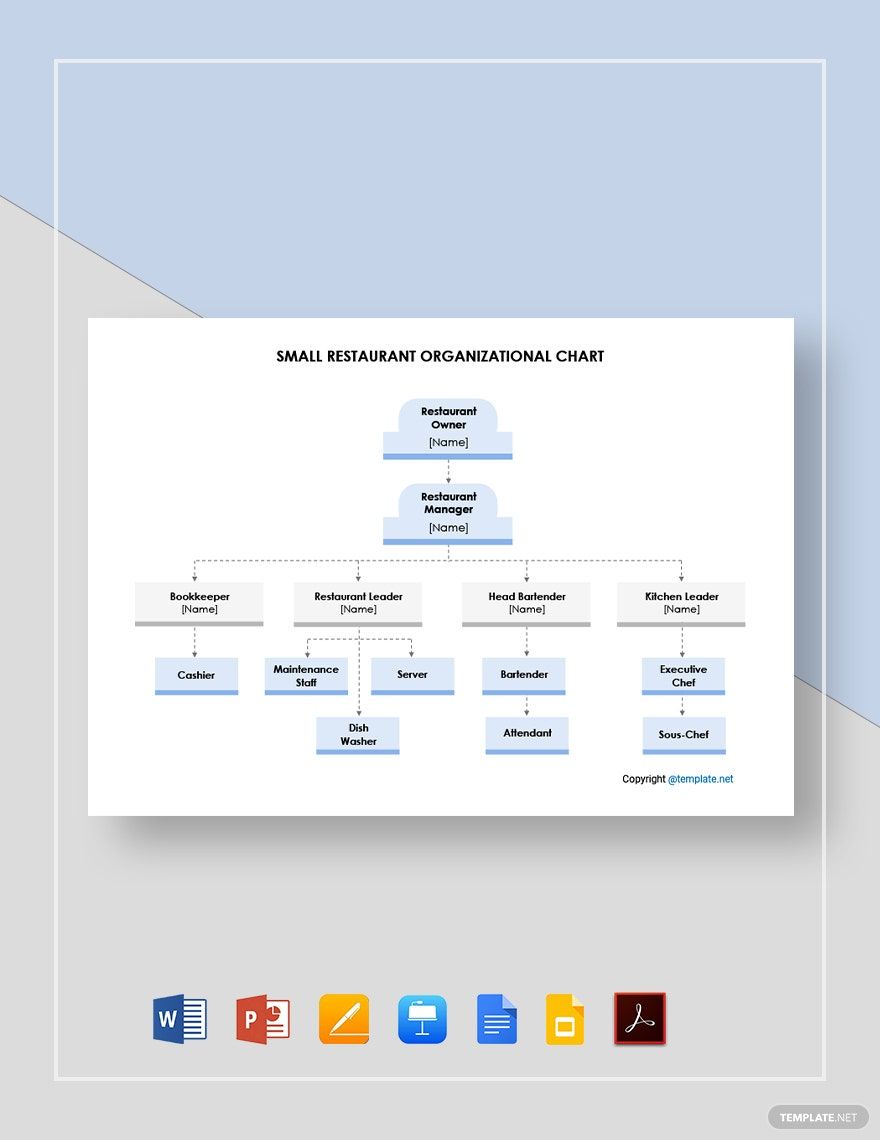
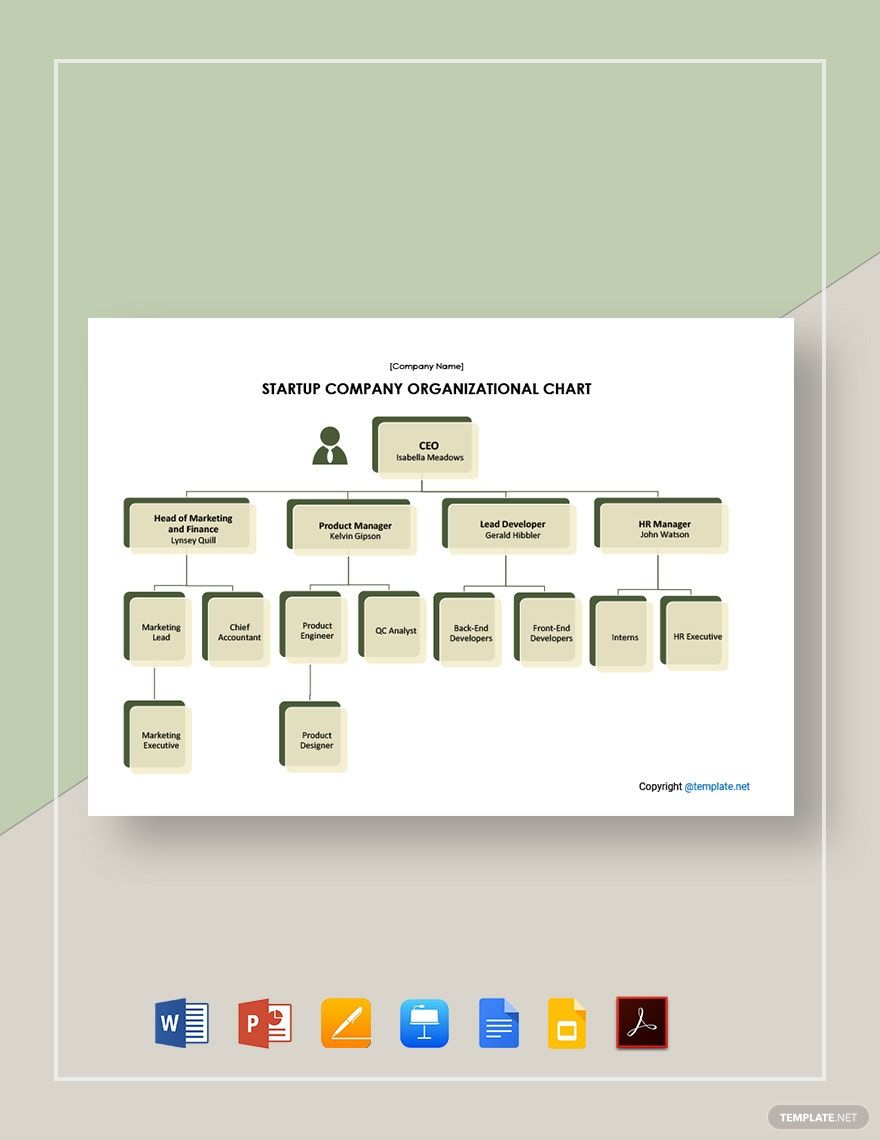
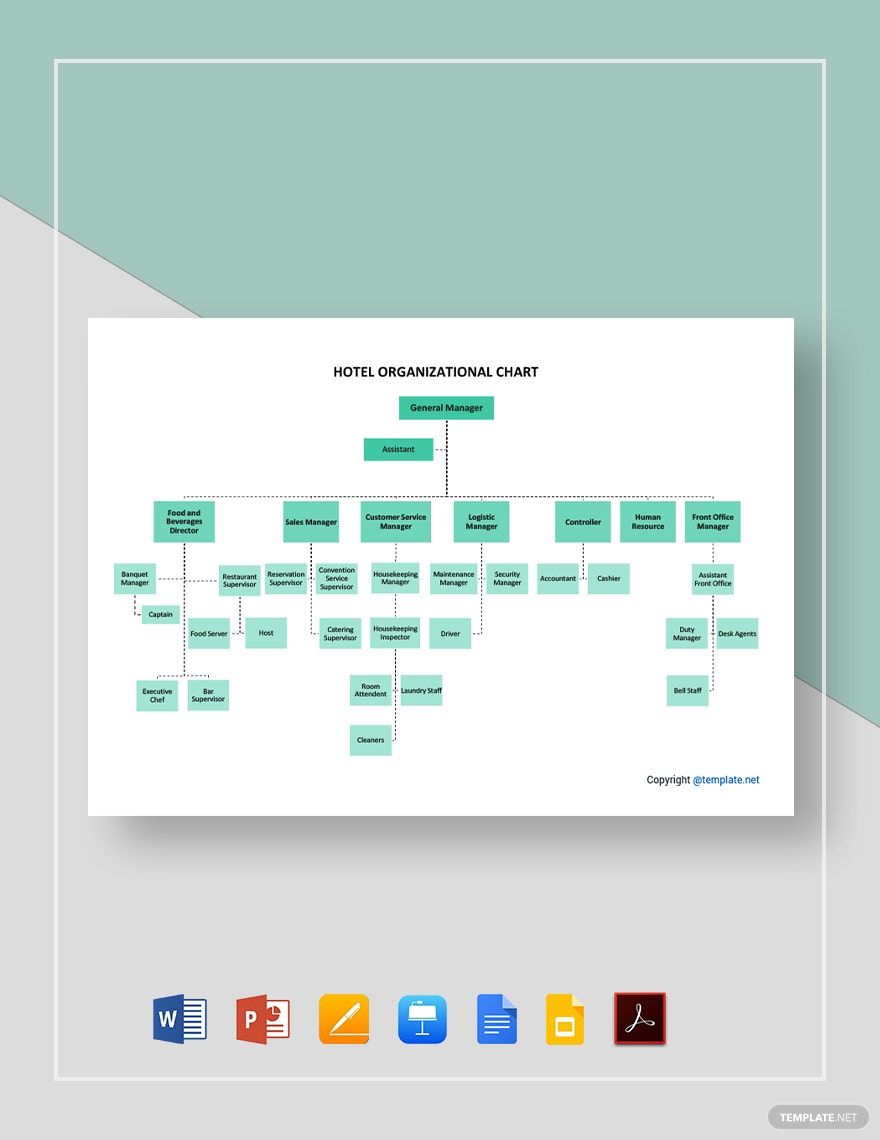
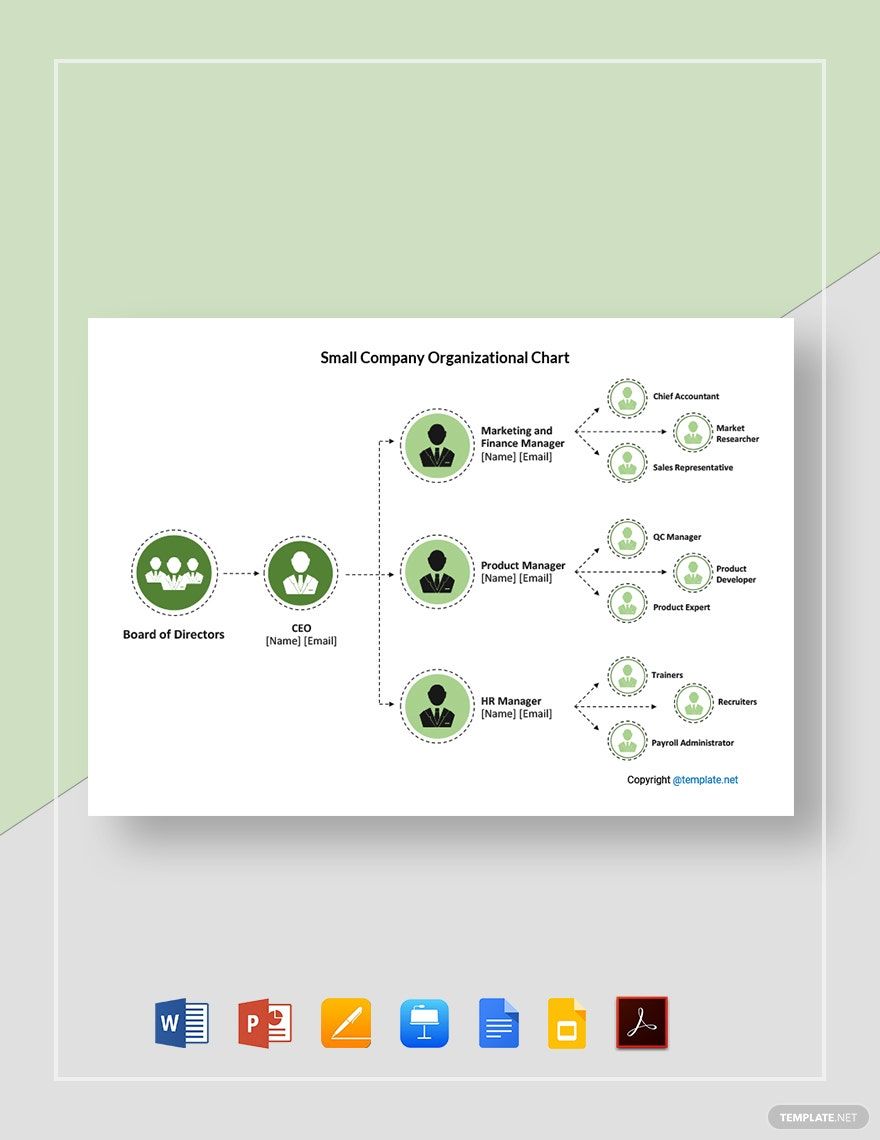
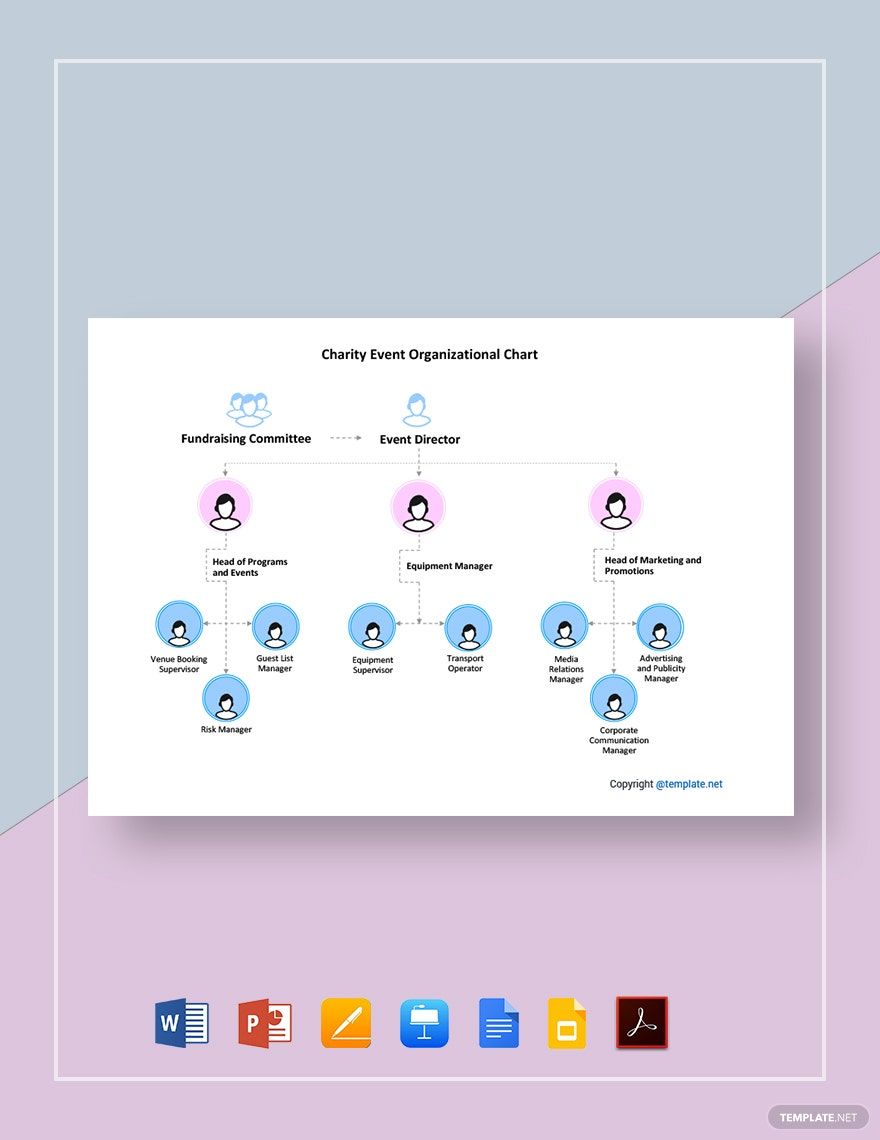
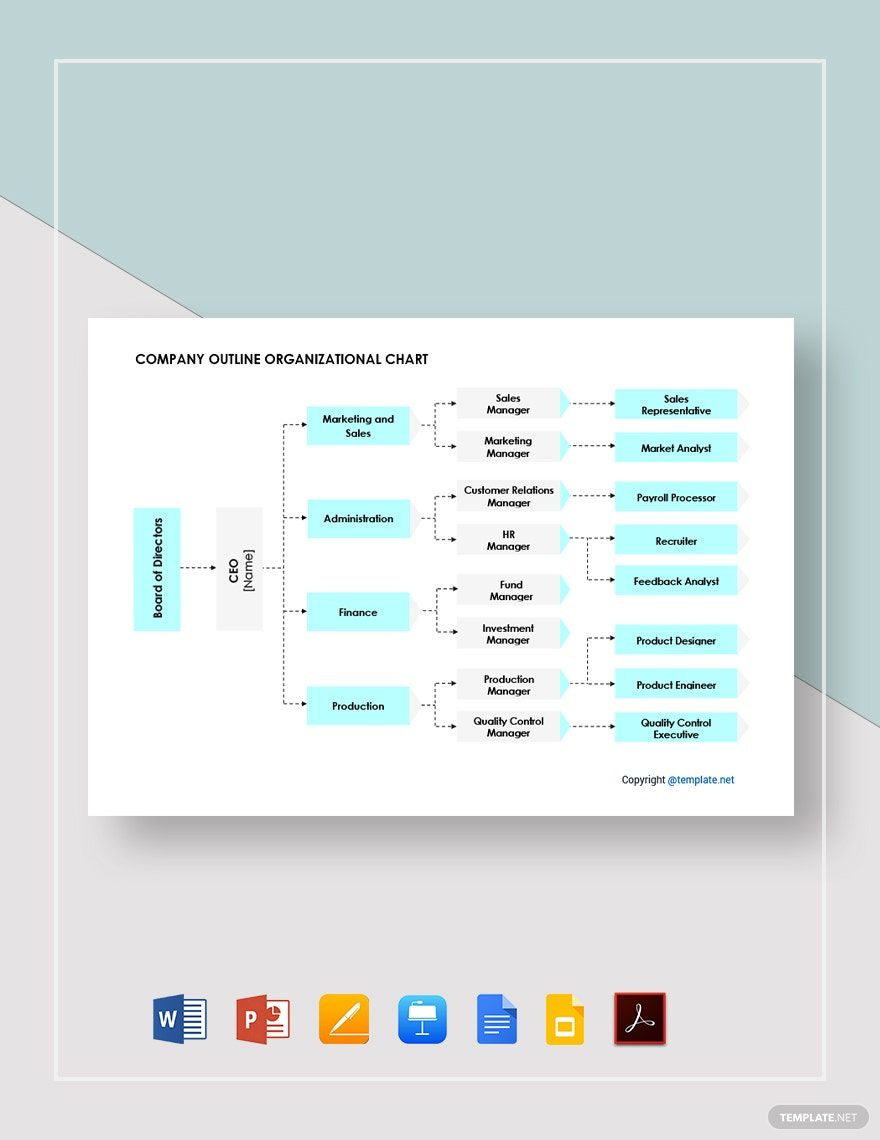
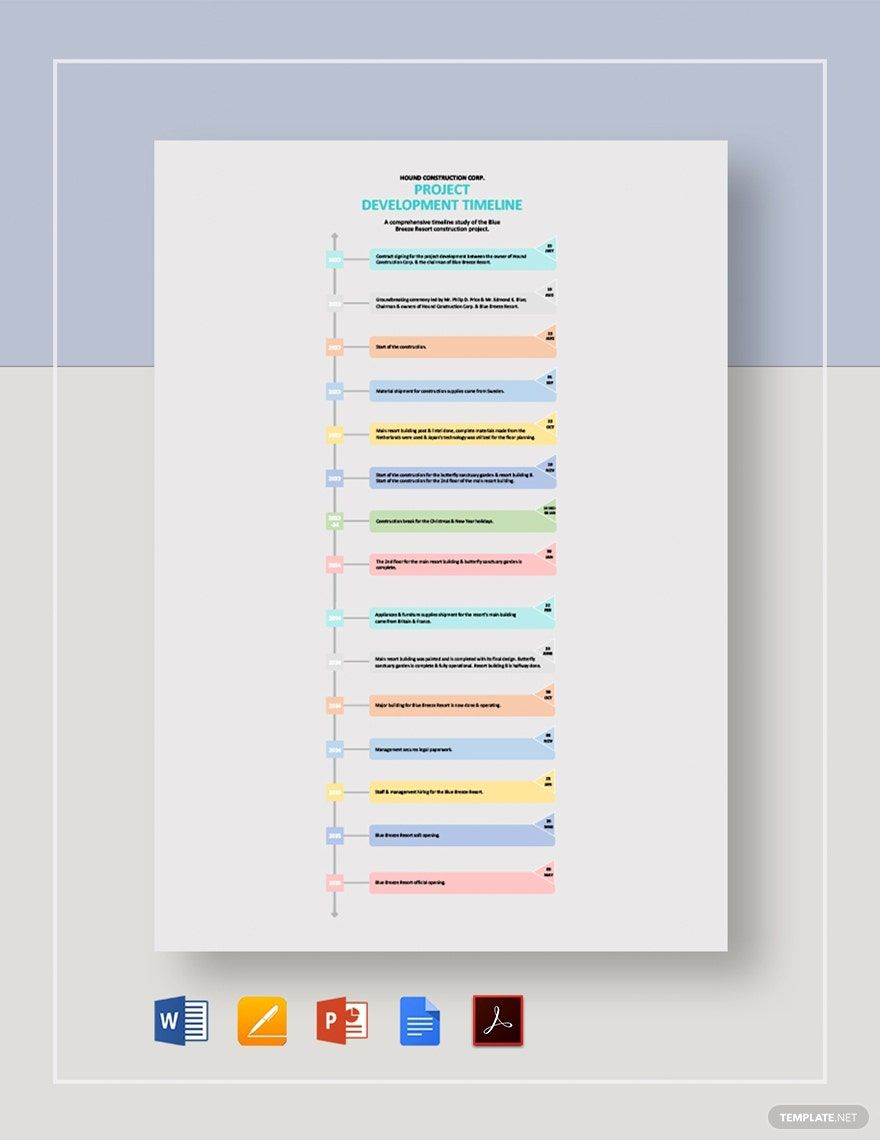
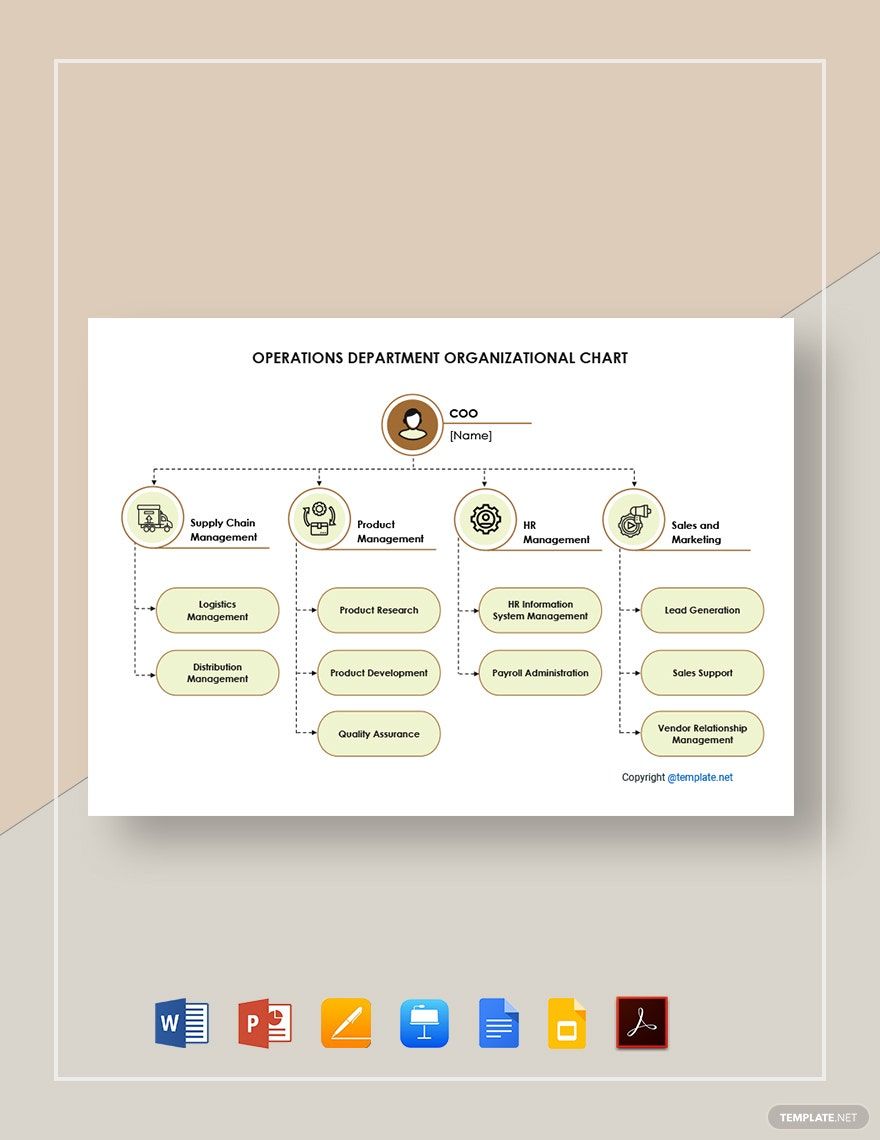
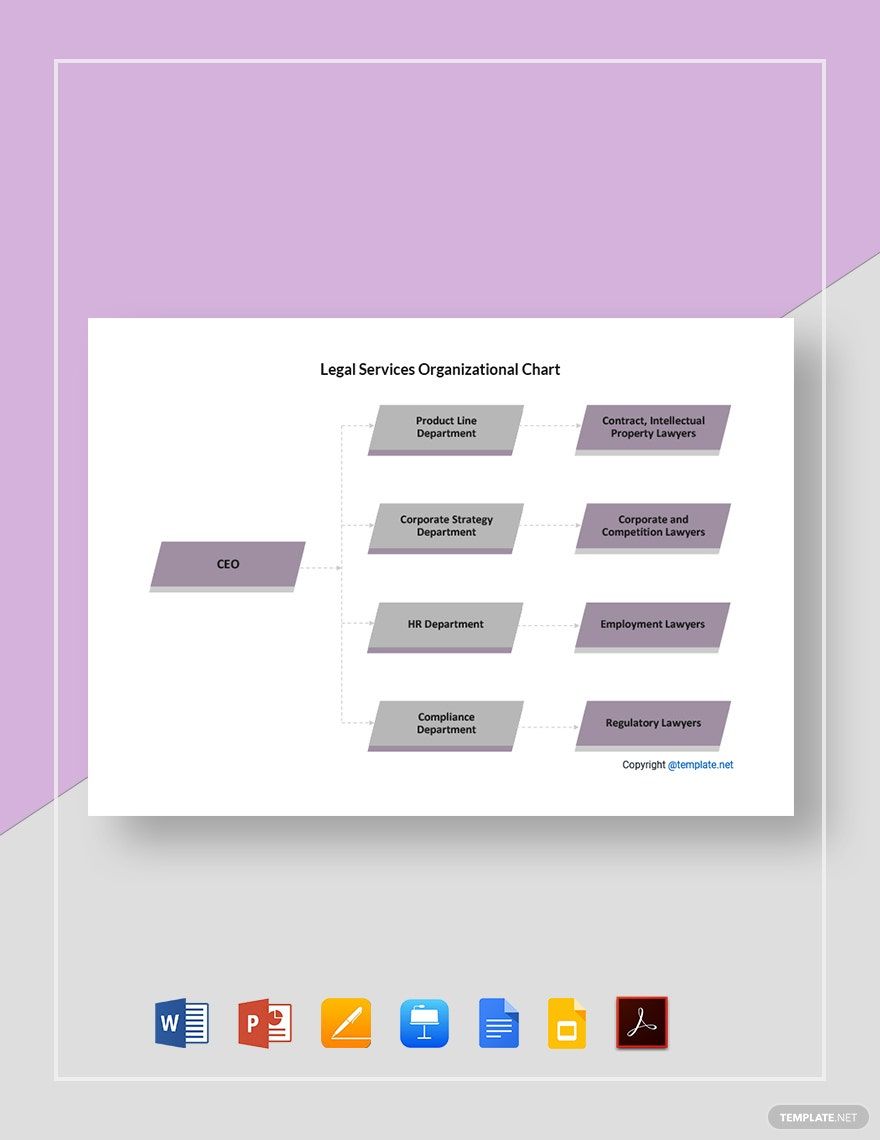
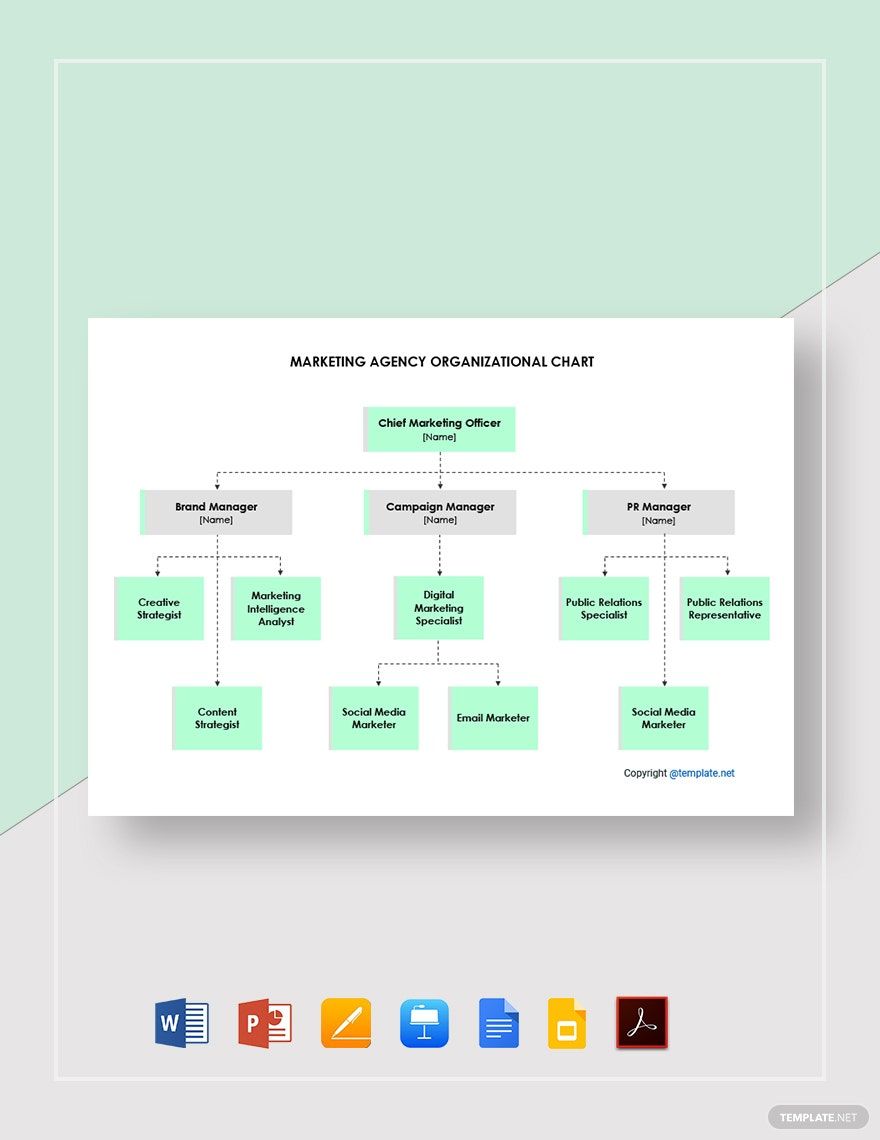
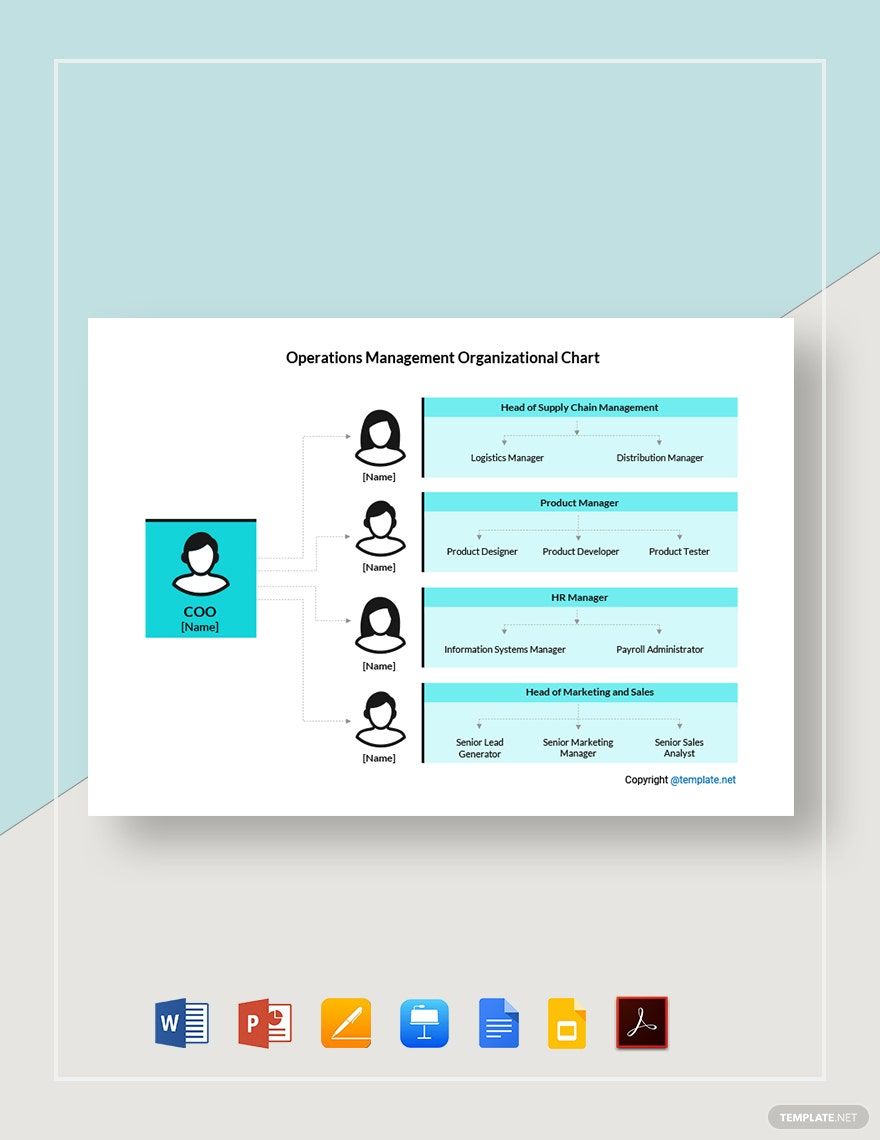
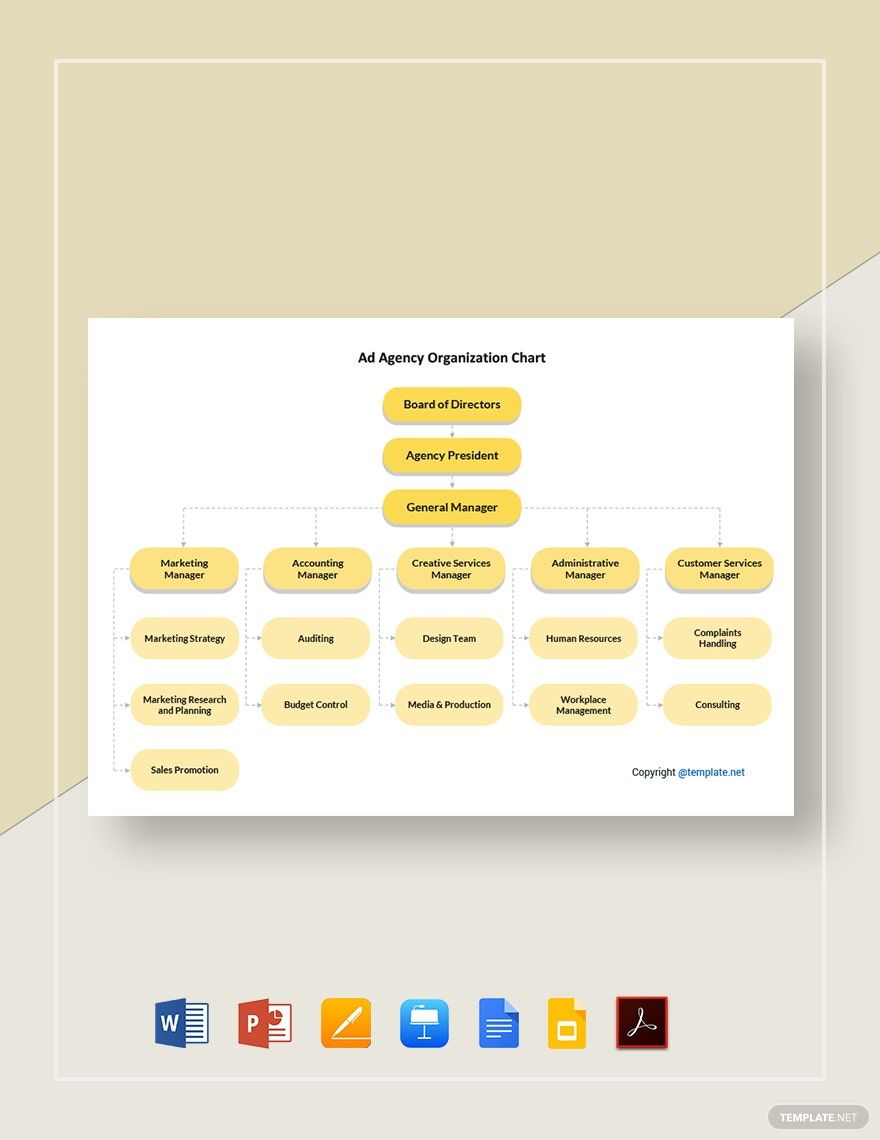
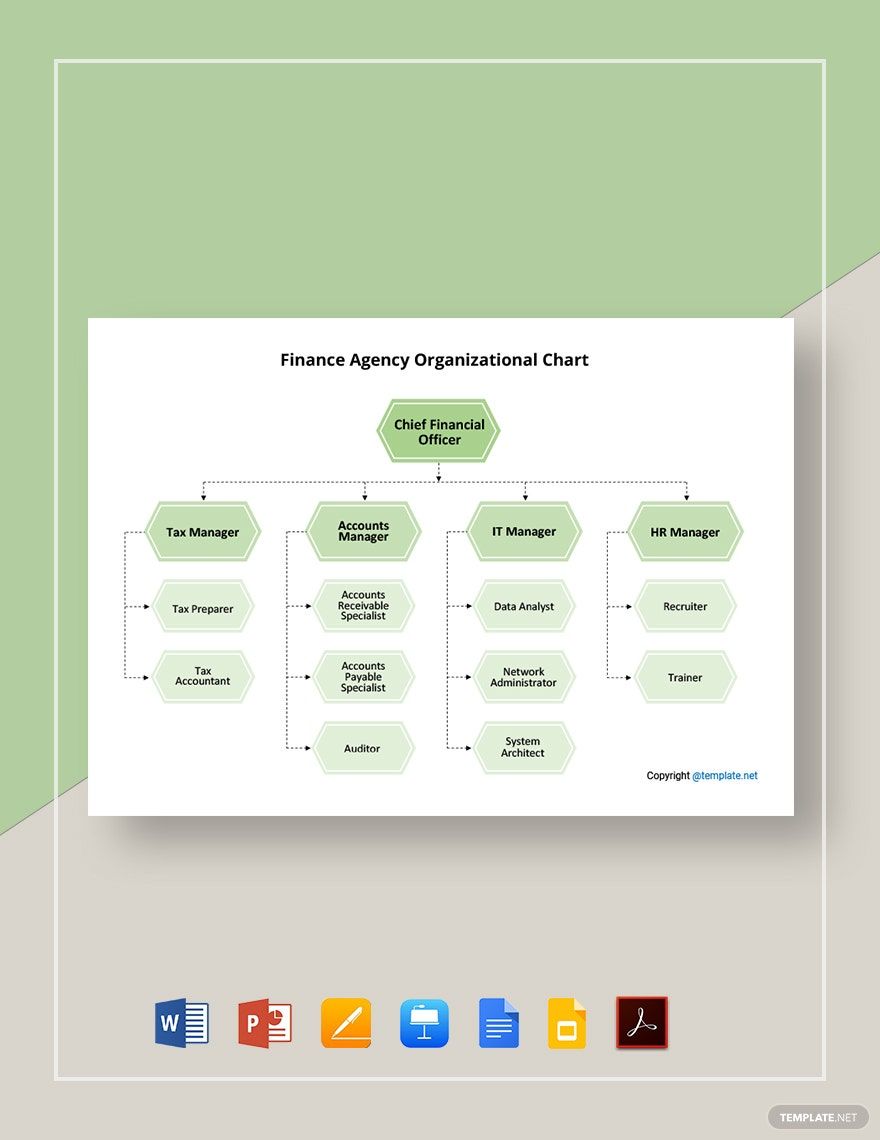
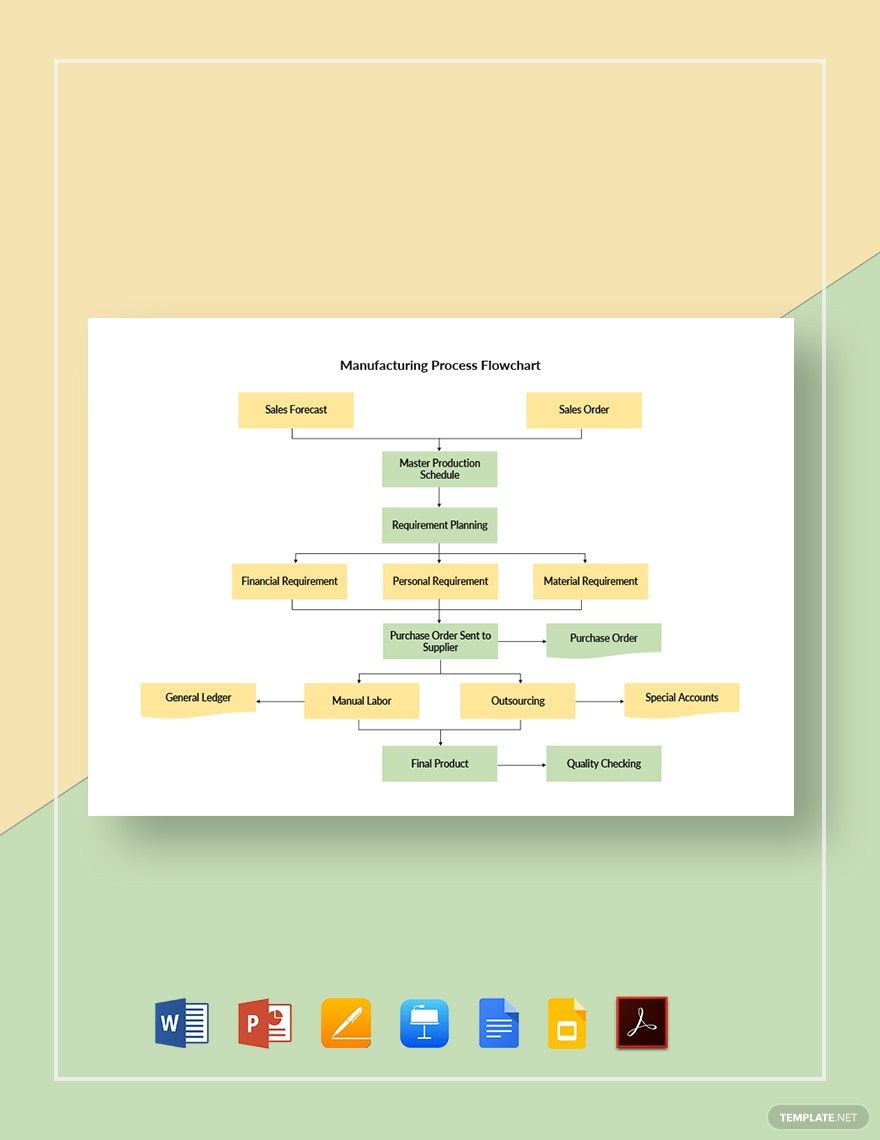
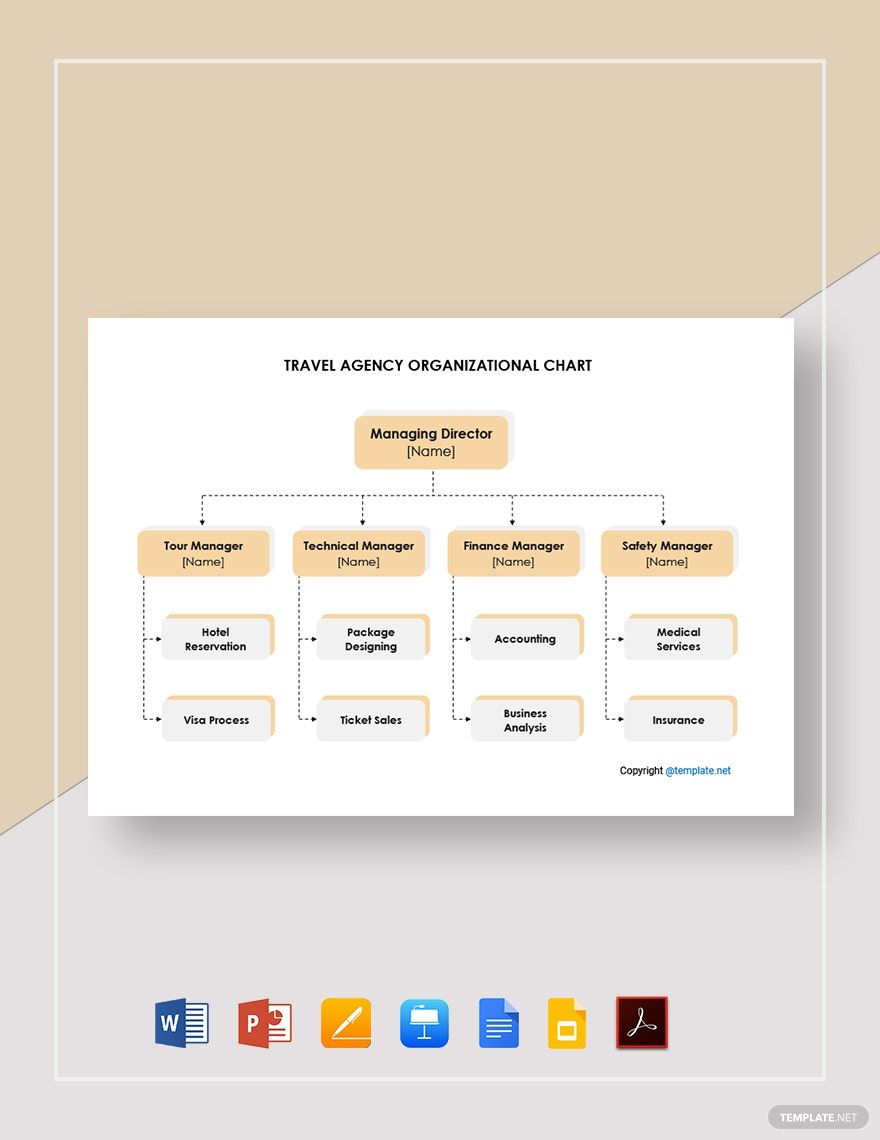
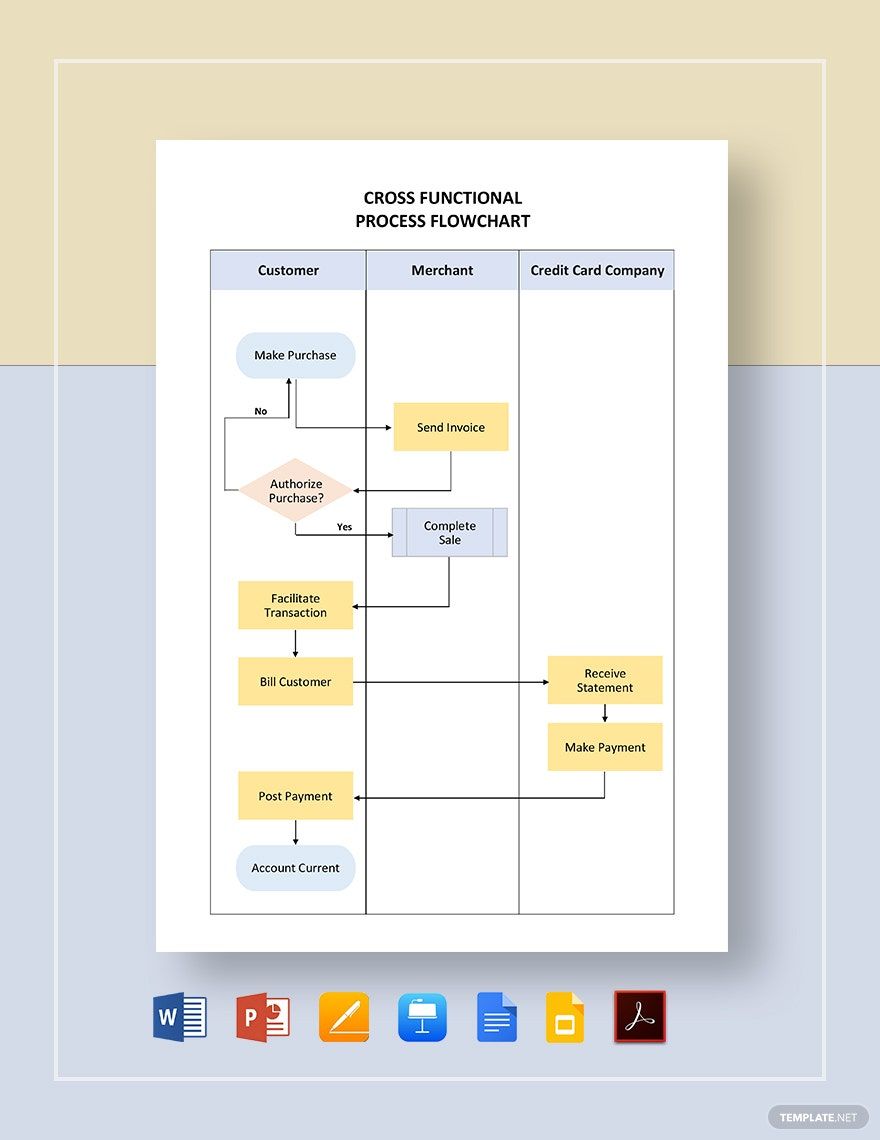
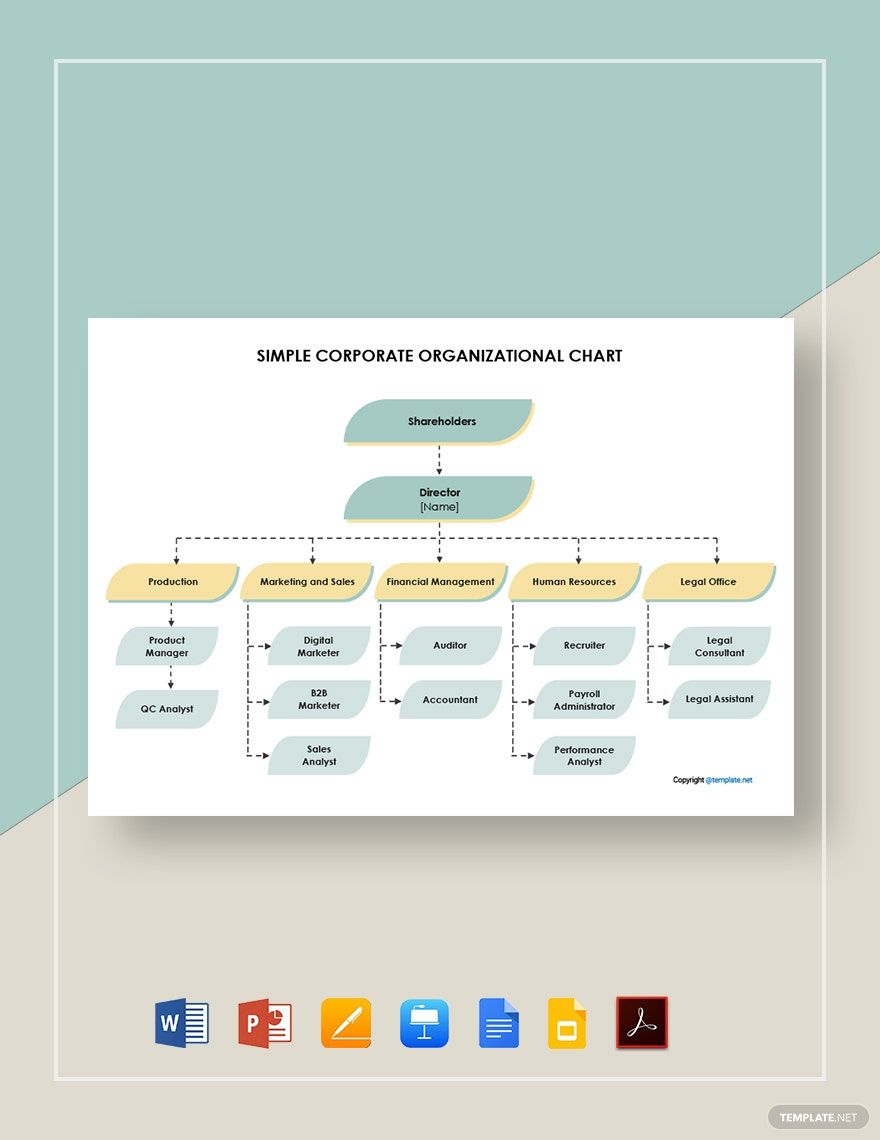
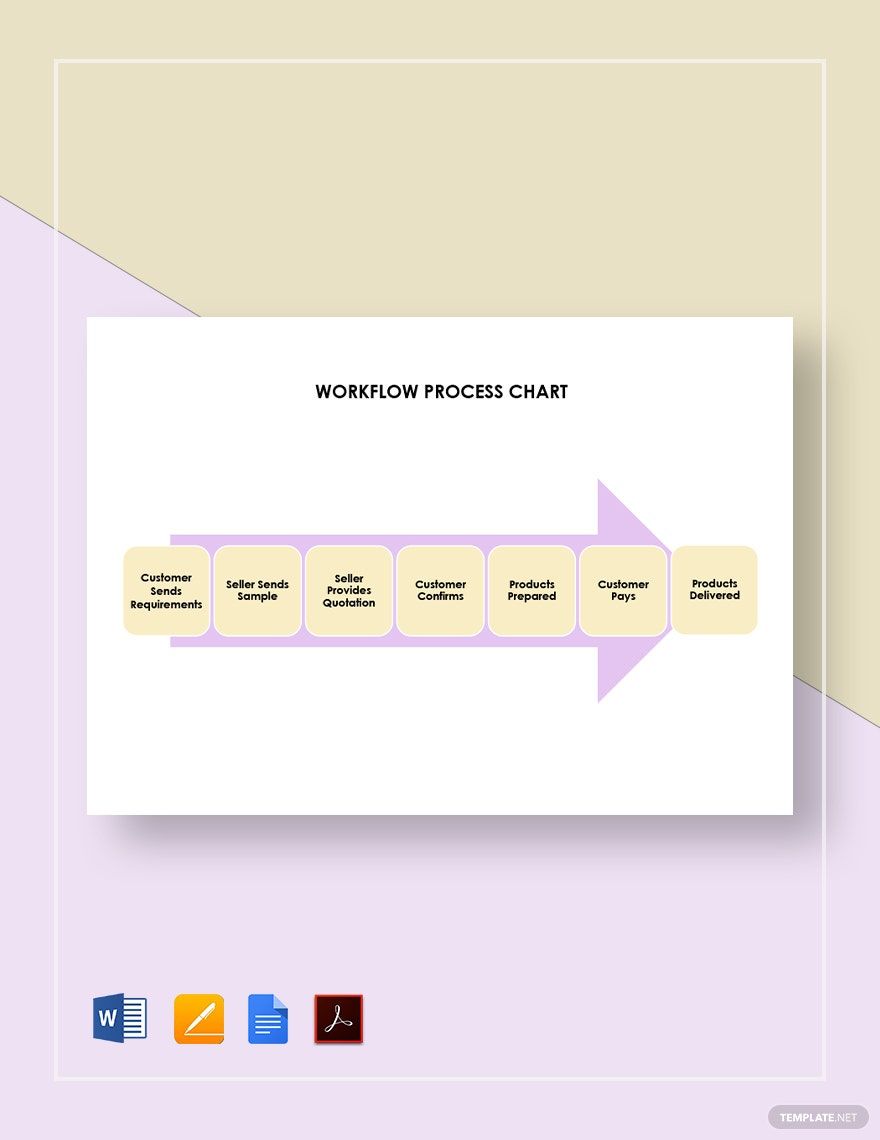
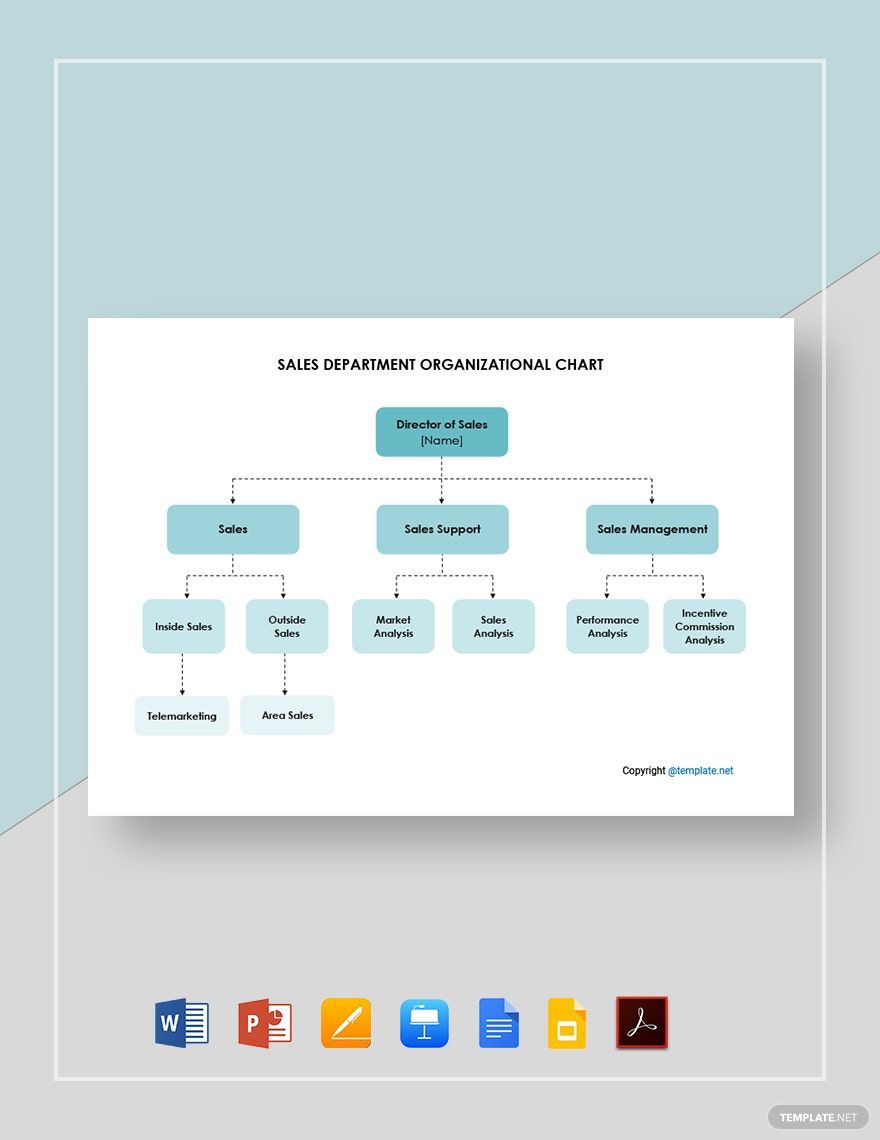
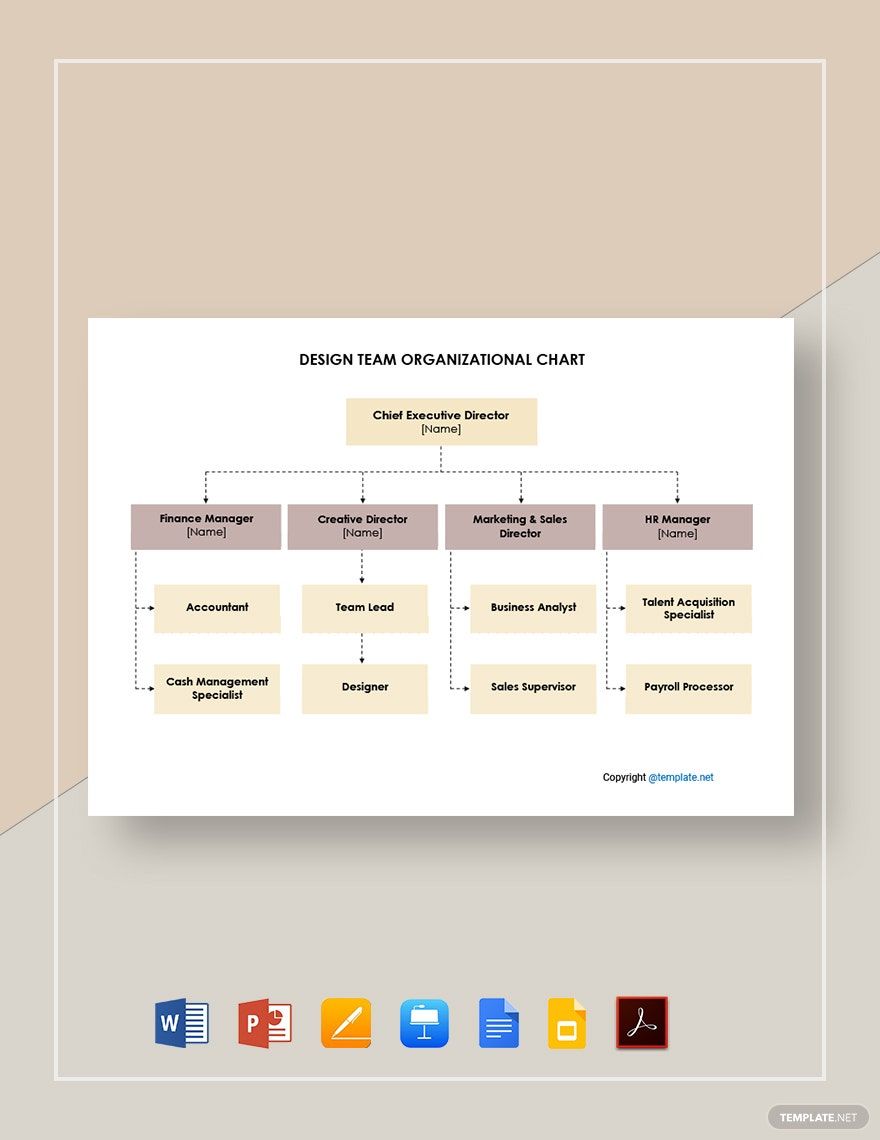
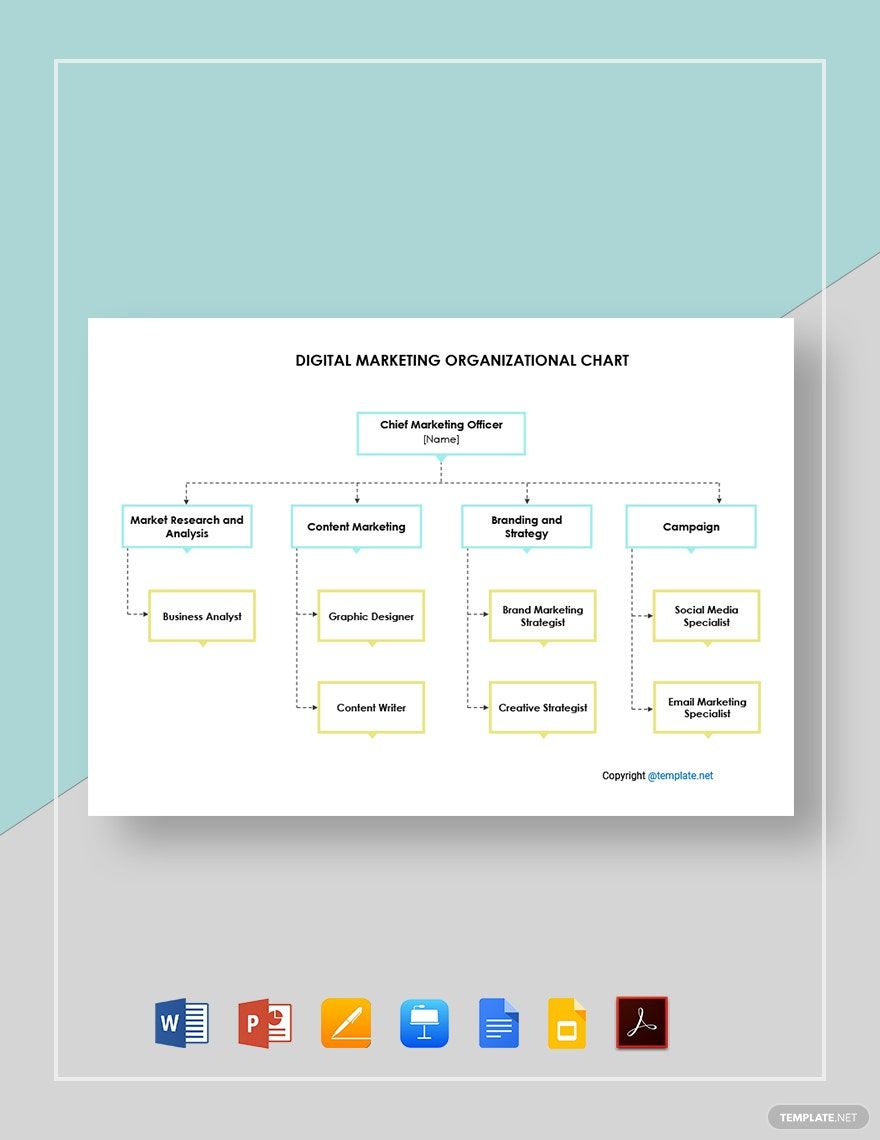
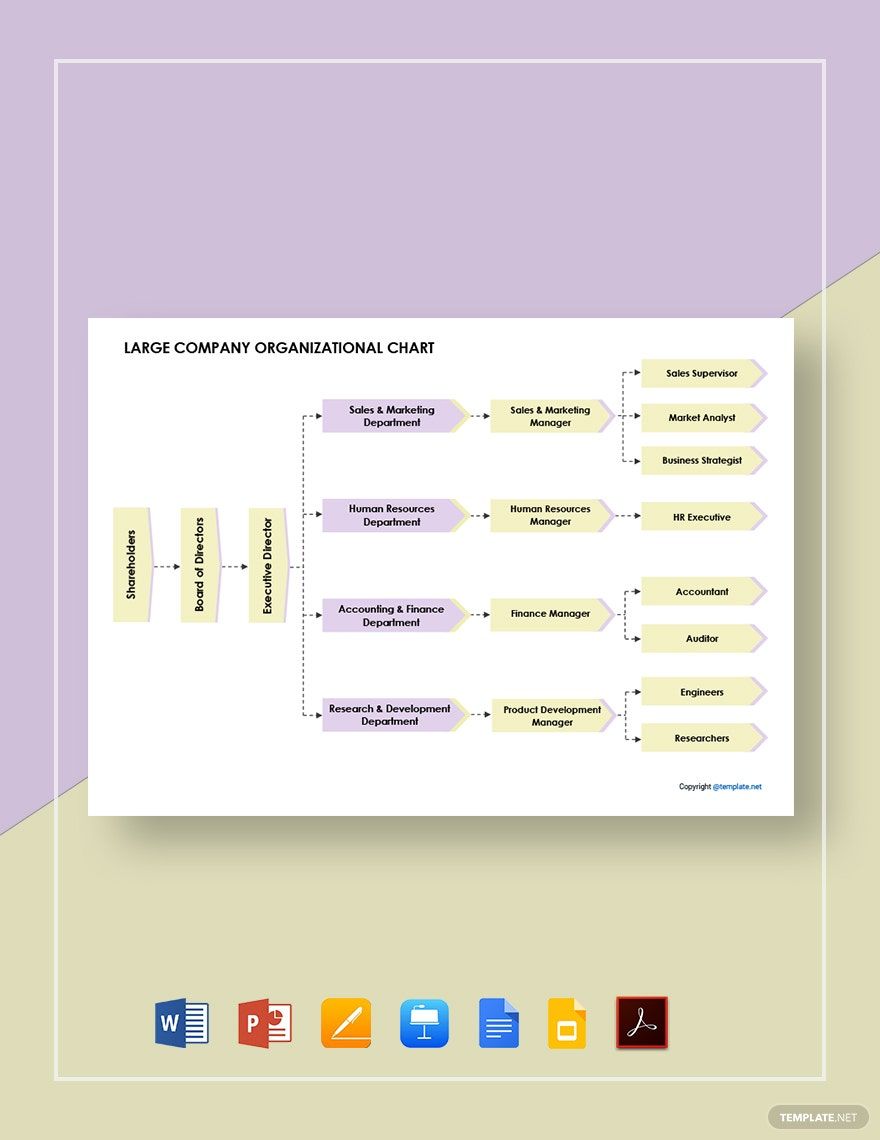
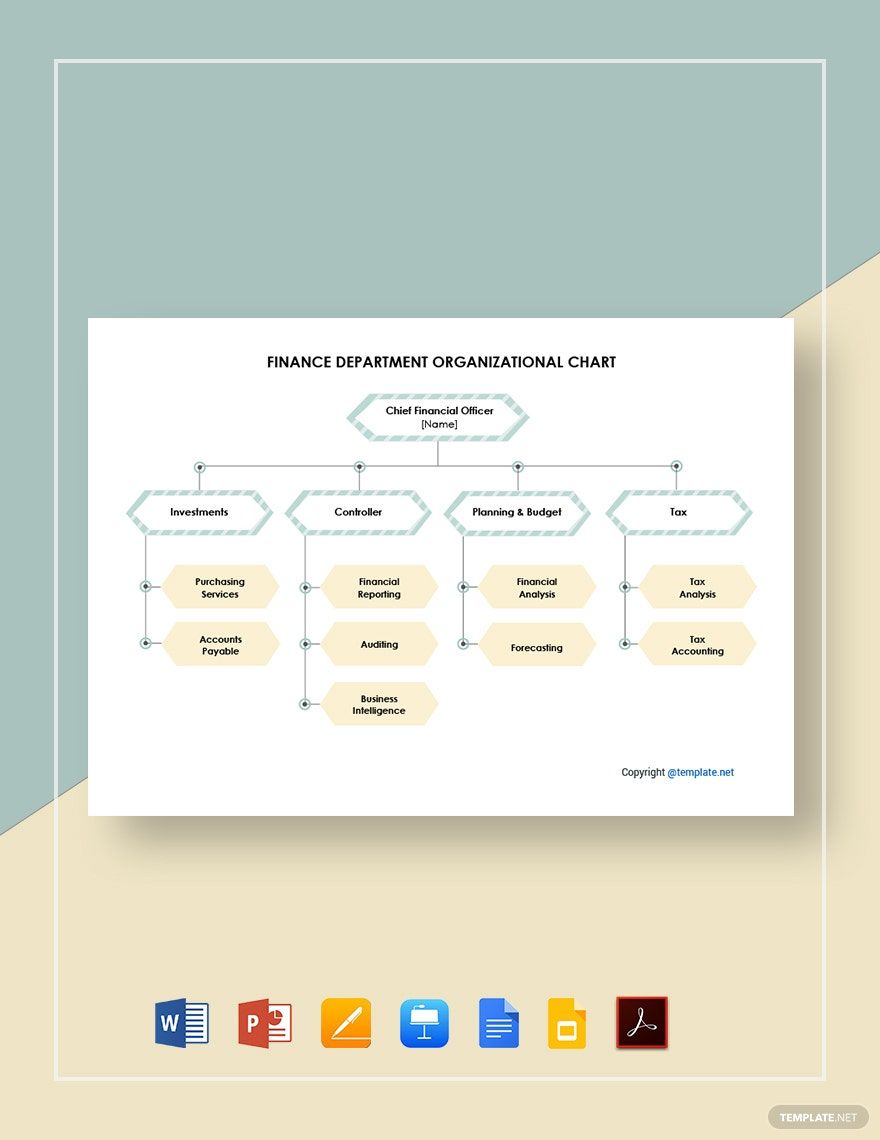
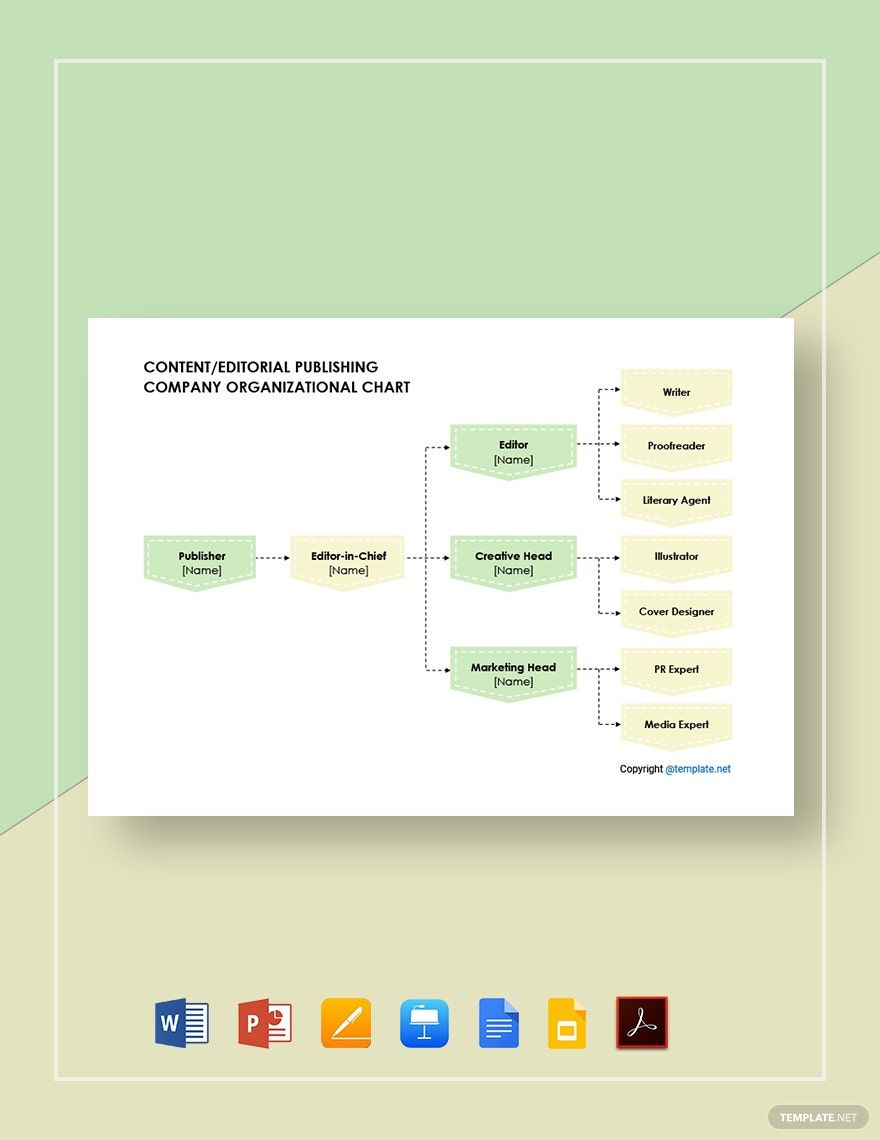
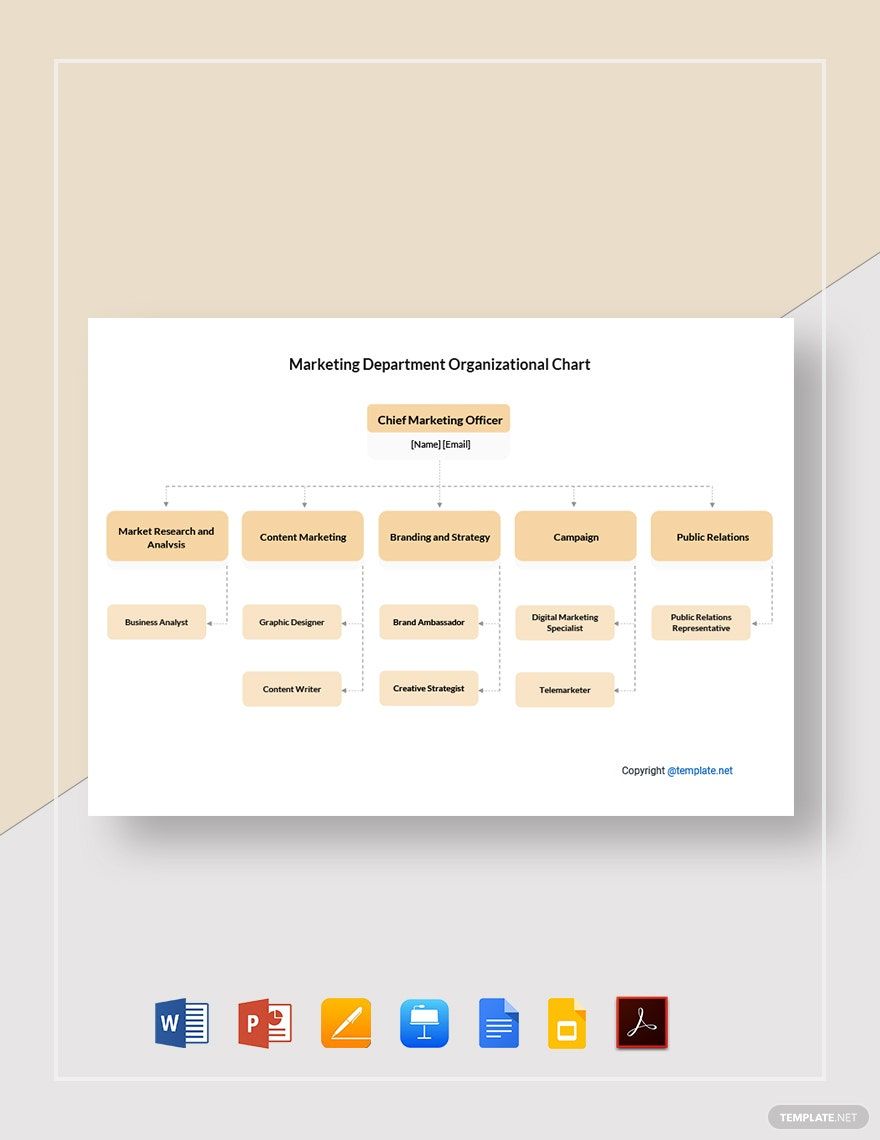
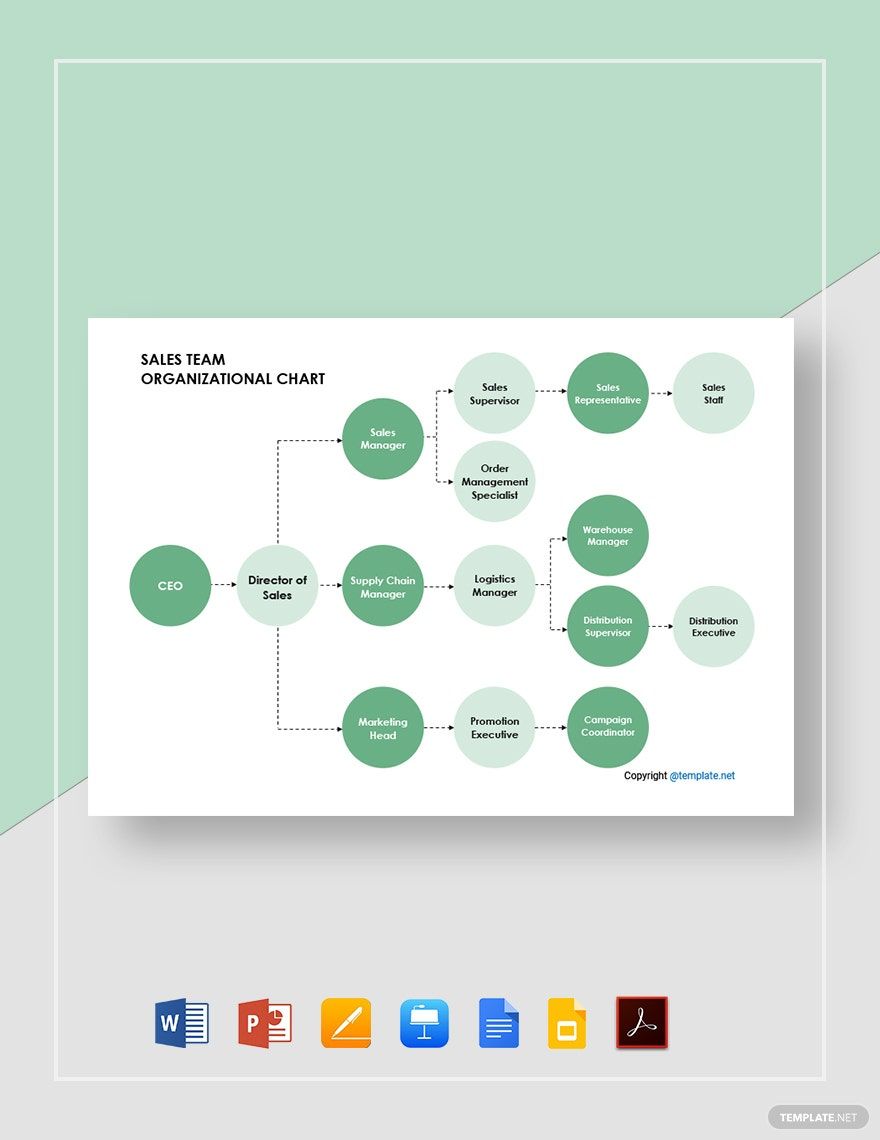
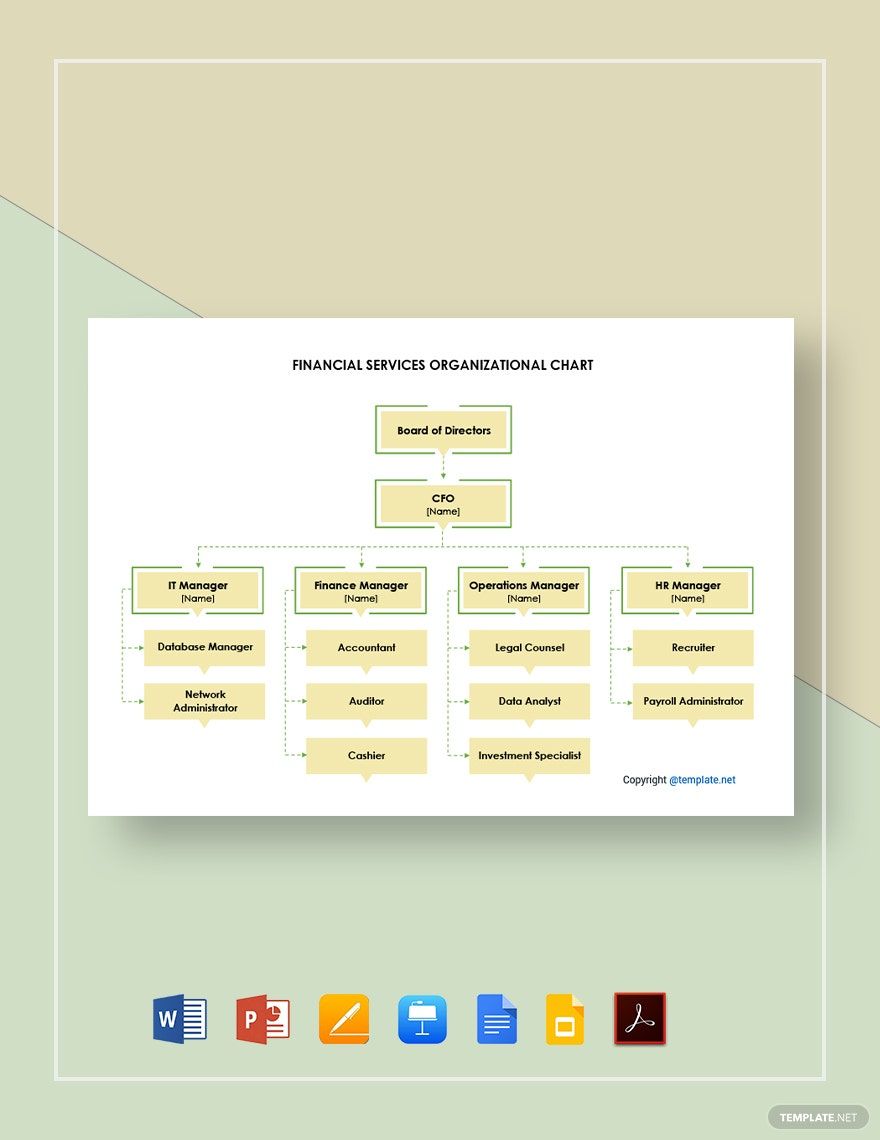
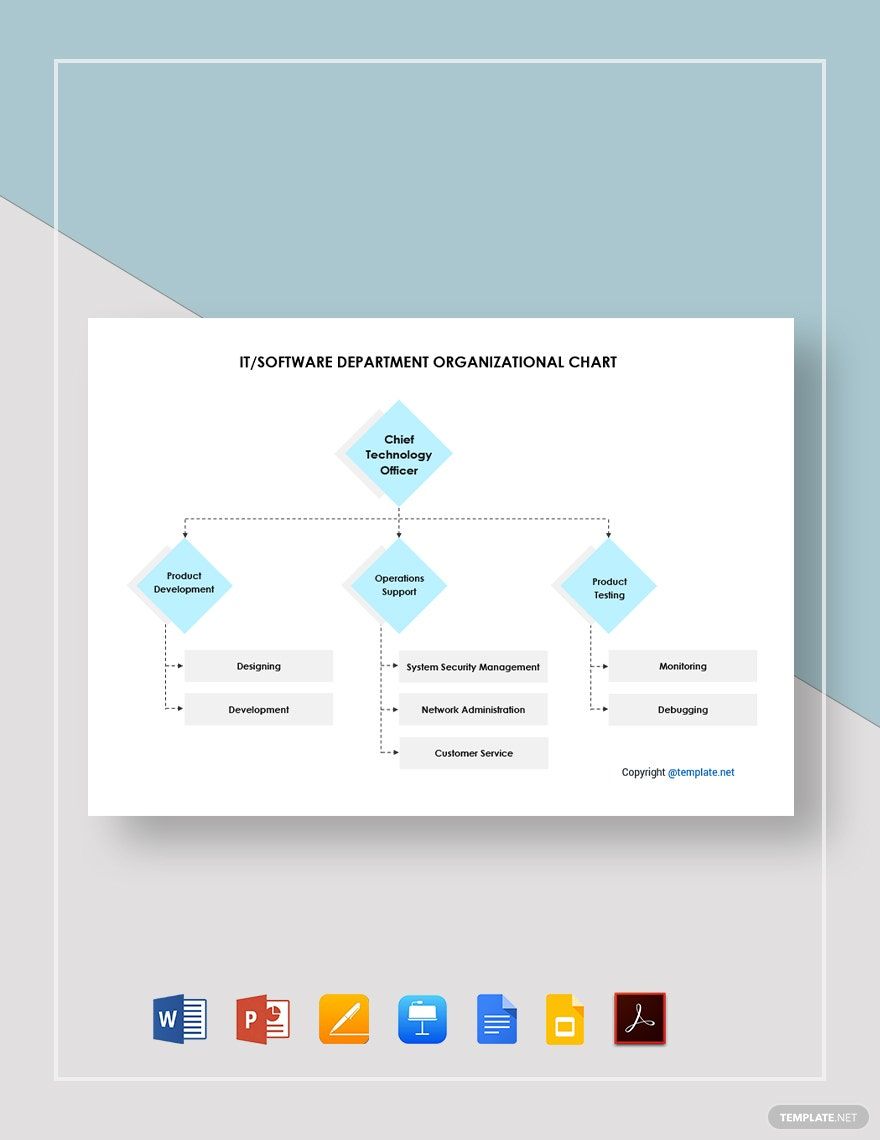
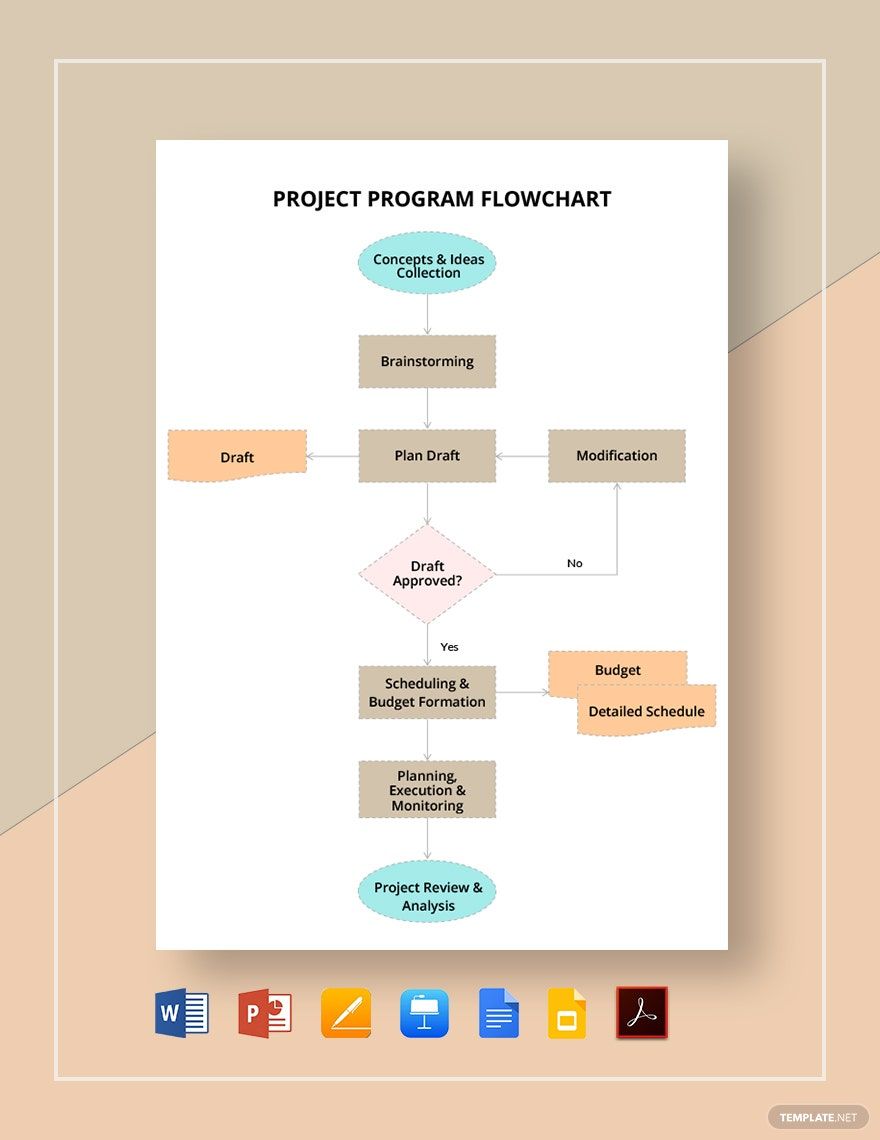
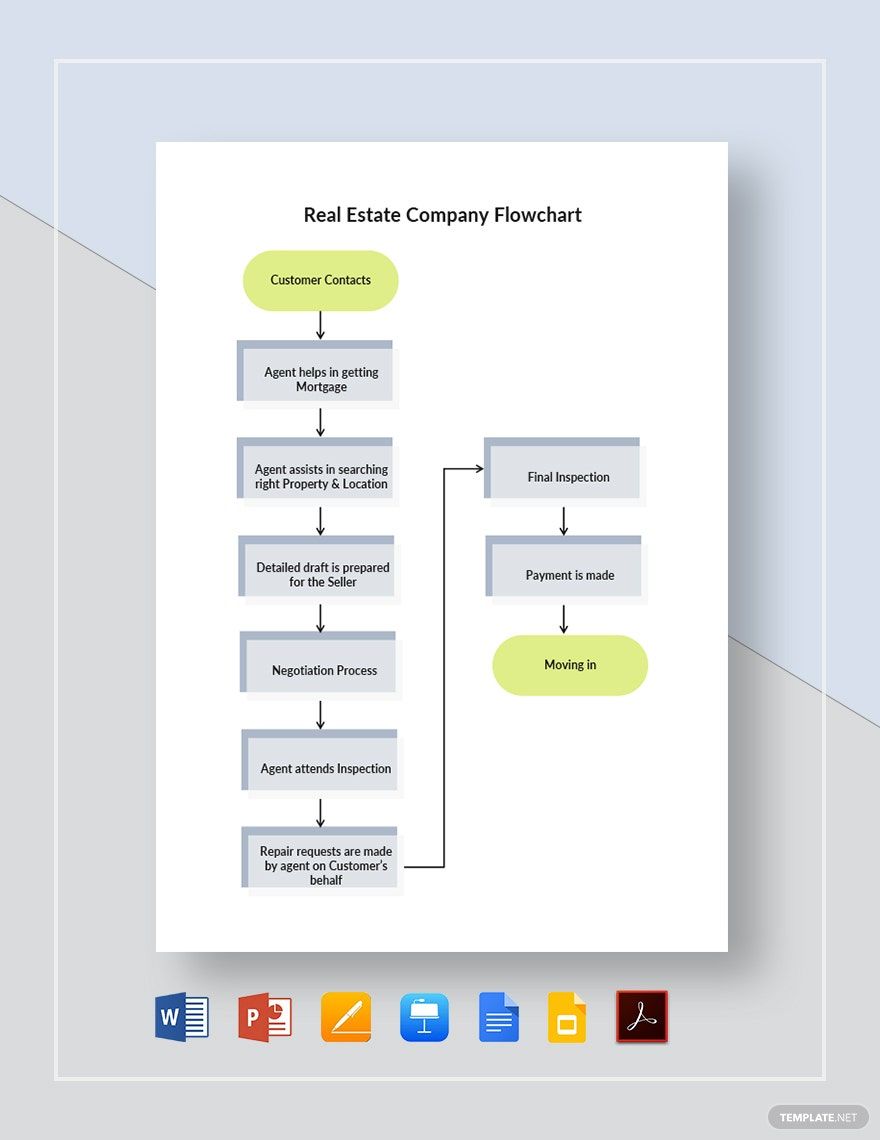
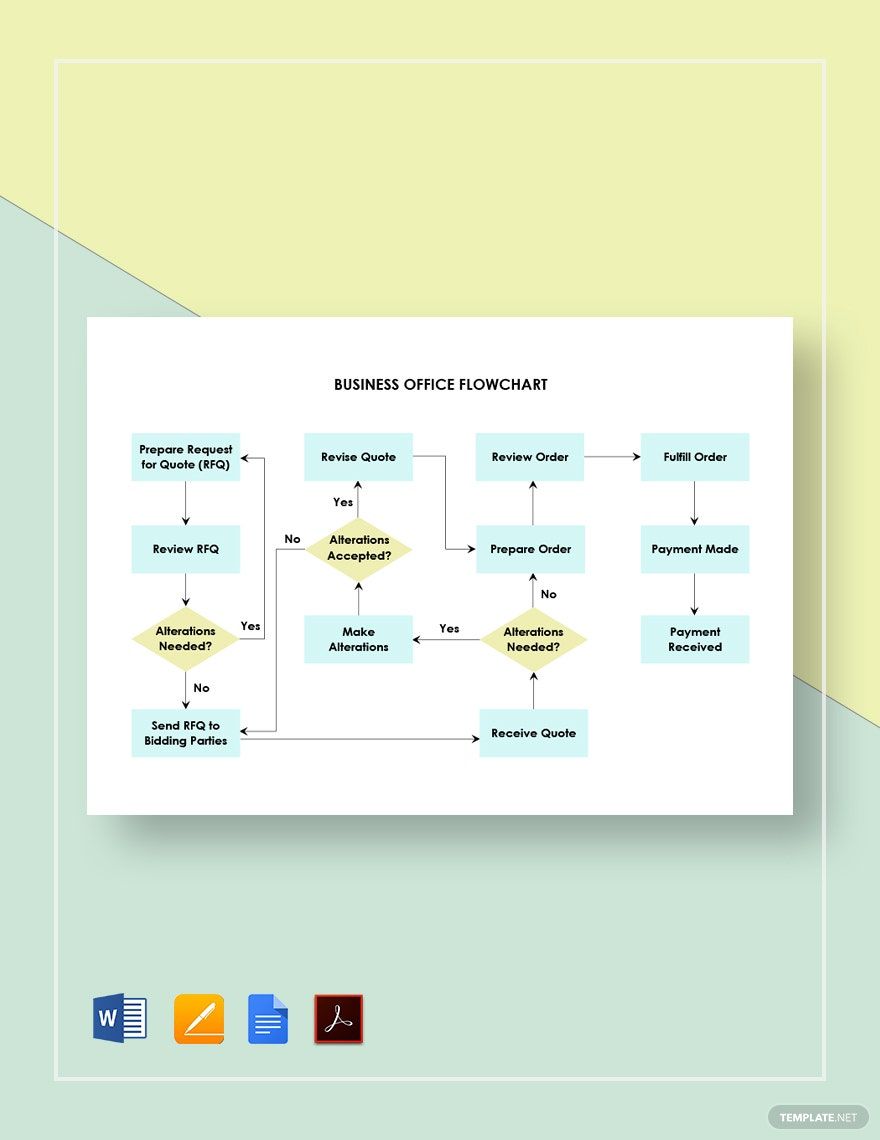
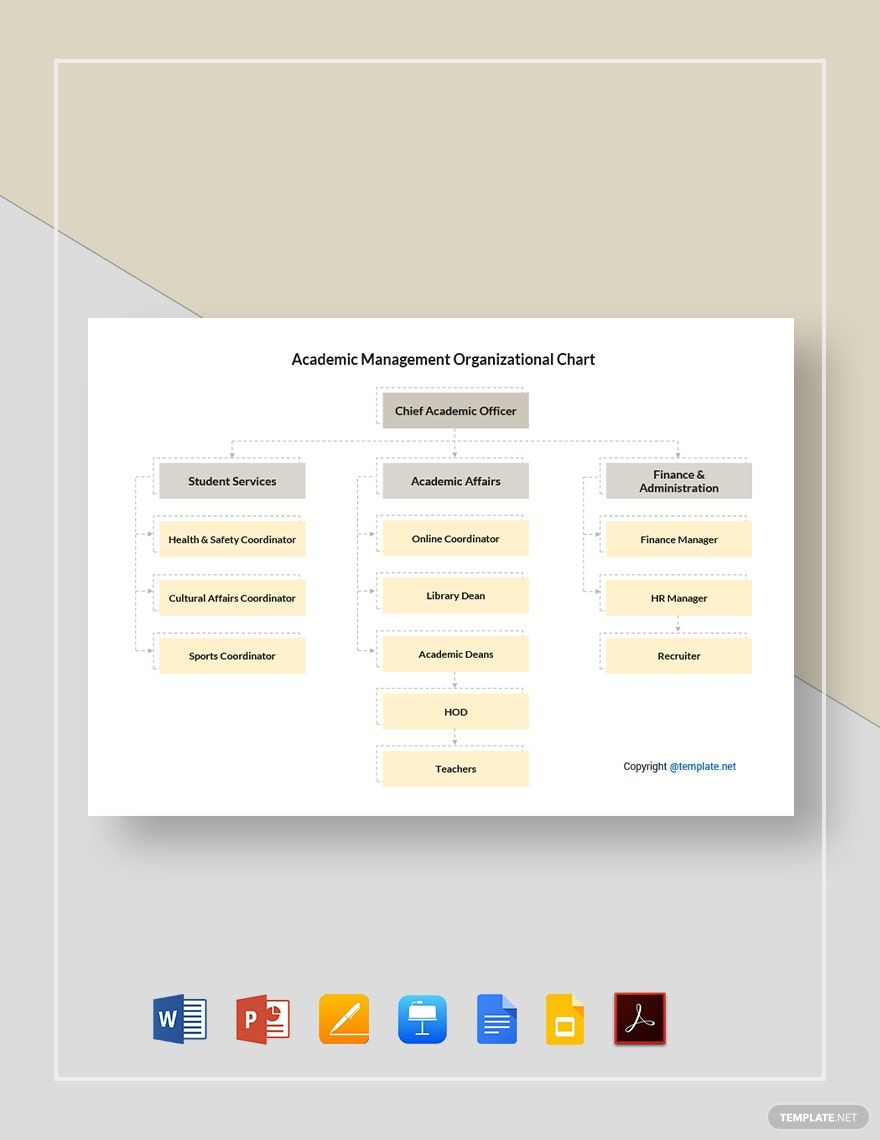
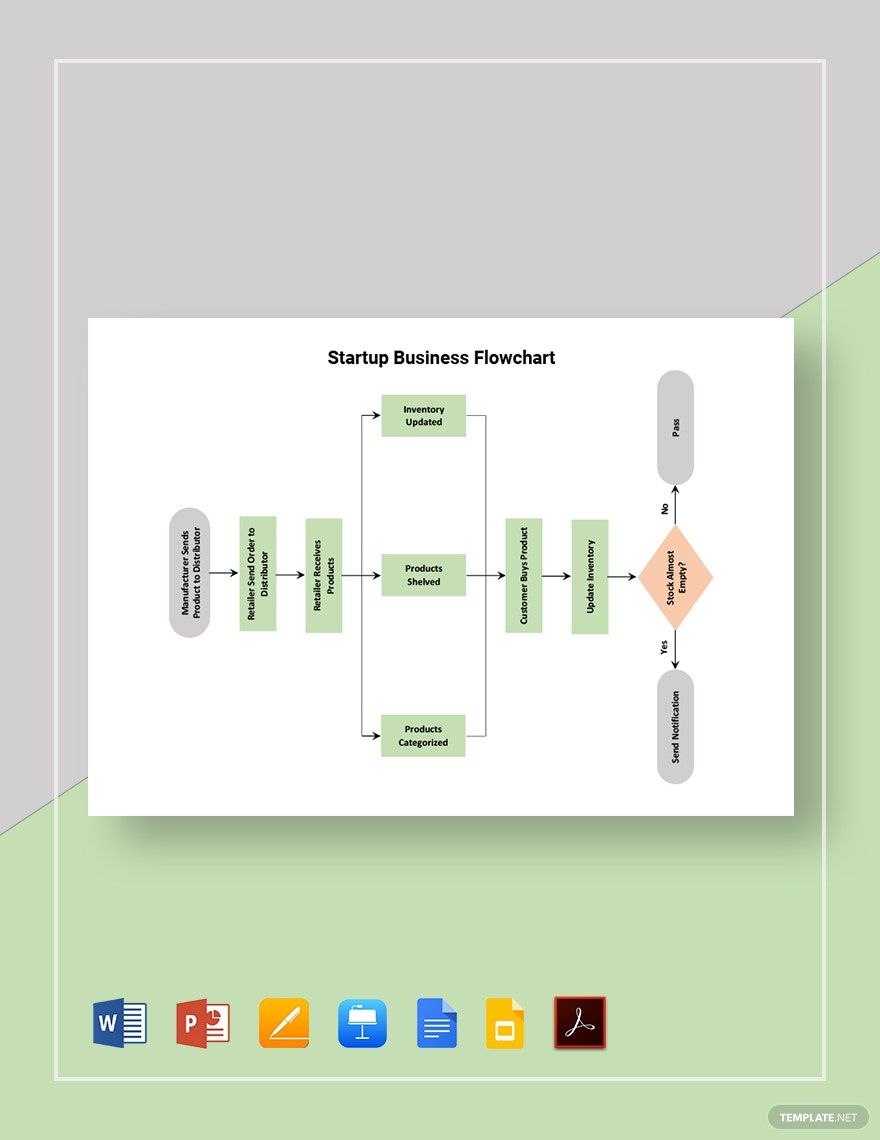
If you are looking for the perfect visualization tool for your data, well, you're in luck. Template.net has a variety of high-quality chart templates that are available in Powerpoint (.ppt) you can choose from. Download our templates to our advantage. Our ready-made chart templates are specially designed with highly customizable suggestive headings and contents to guide you when creating your chart. By downloading our templates, you can save ample of time. So what are you waiting for? Hurry and download our chart templates right away!
How To Create A Chart in Powerpoint
A chart or diagram is any graphical representation of the connection between concepts, variables, or data. In most cases, chart-makers fail to create a well-designed chart that is visually effective. To avoid this shortcoming, we share this article that will teach you a step-by-step process in making an effective chart, whether it is a Gantt chart or a chore chart. Study each step well so you can start incorporating it into your chart designs.
1. Program
Finding the best chart-making program can take up too much time that is why we recommend you use Microsoft Powerpoint. Microsoft Powerpoint is a user-friendly program and a robust presentation tool. Powerpoint can be used to interact with your audience in a variety of efficient ways. Slides are fully customizable to suit your requirements. Powerpoint is the best way if your information is frequently changing and you want the recent figures to always reflect your graph.
2. Chart Type
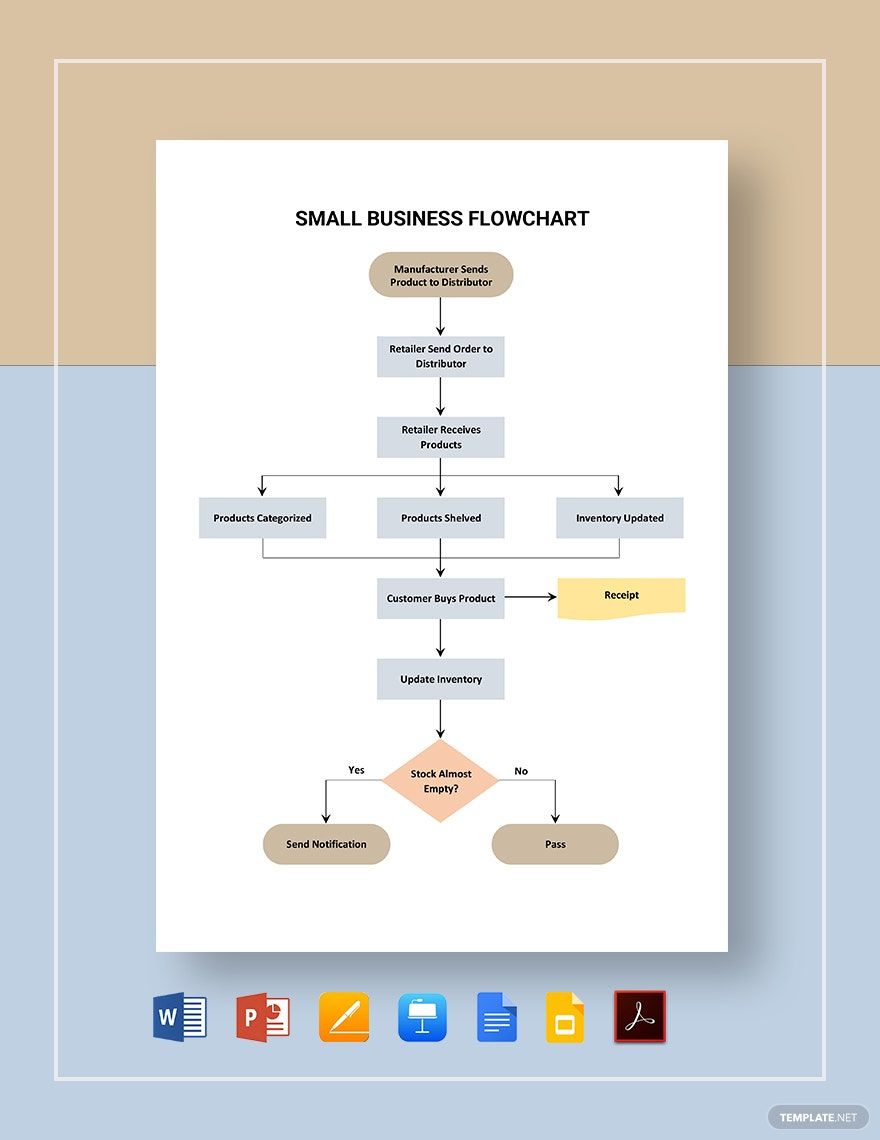
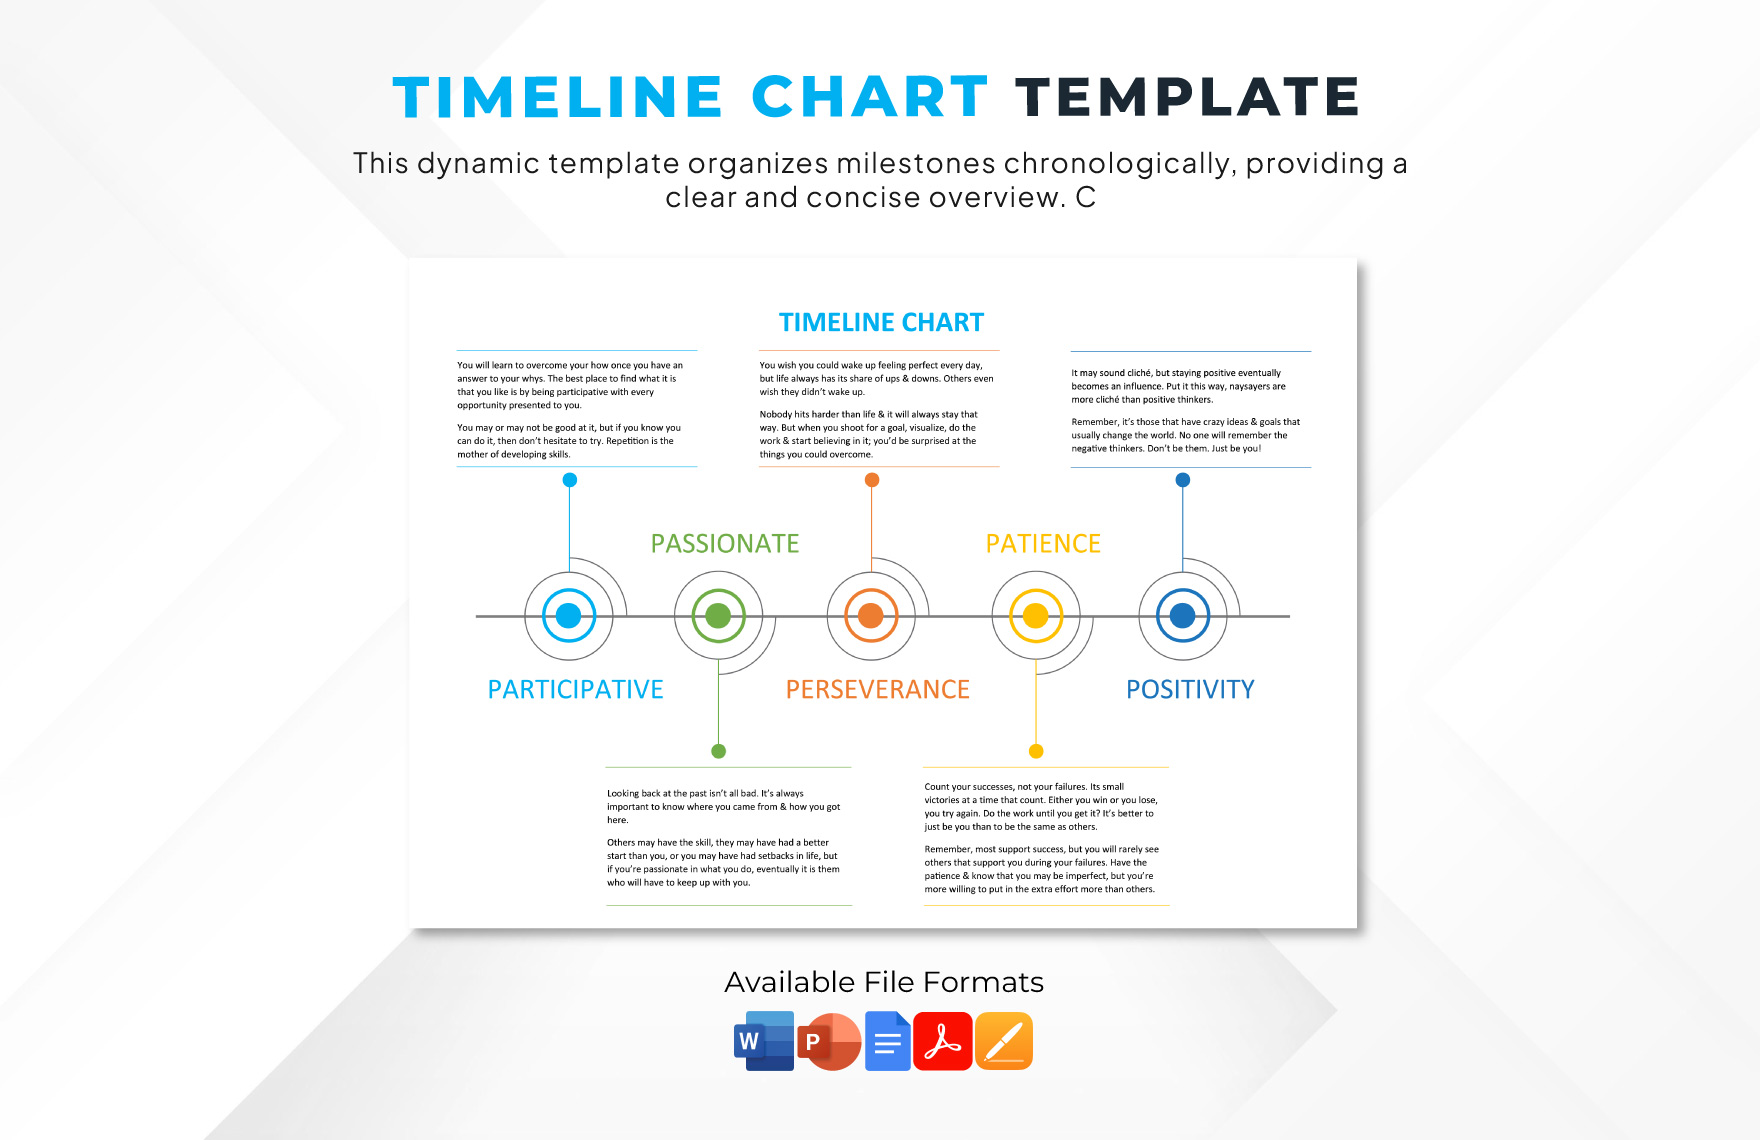
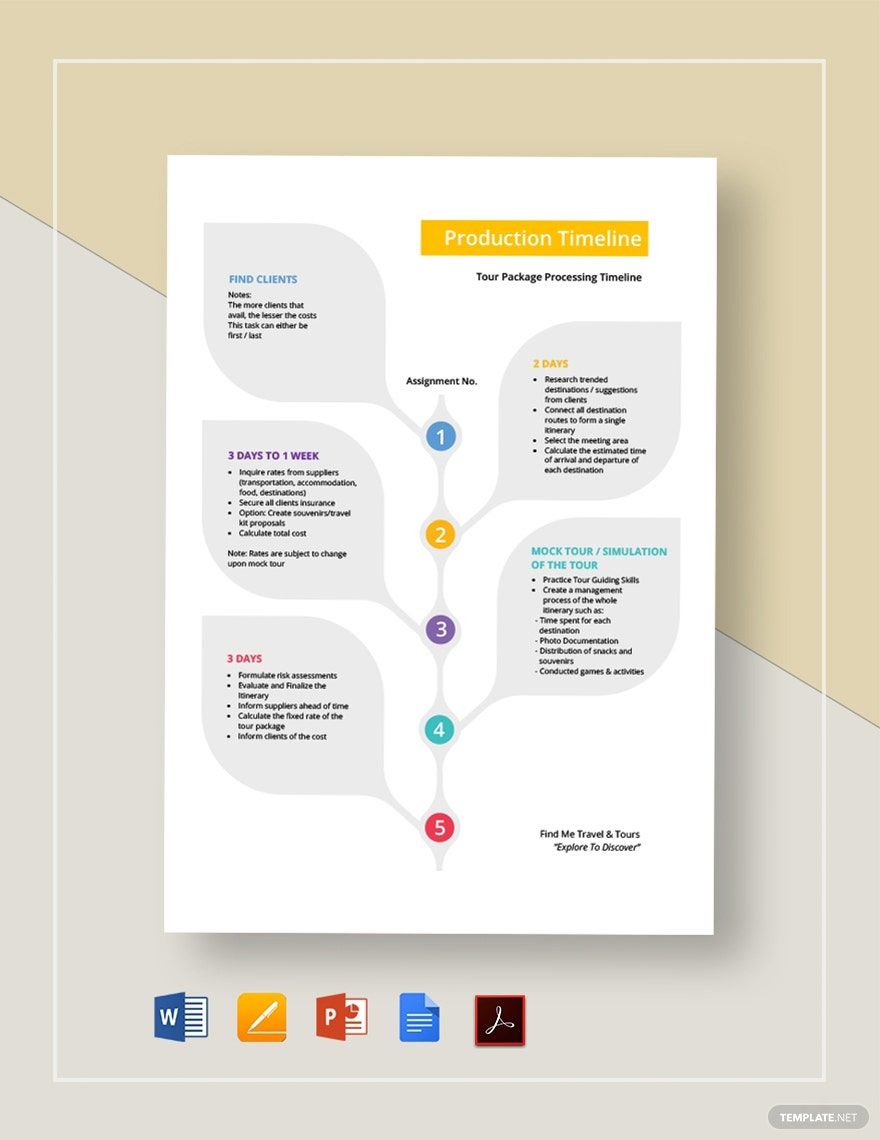
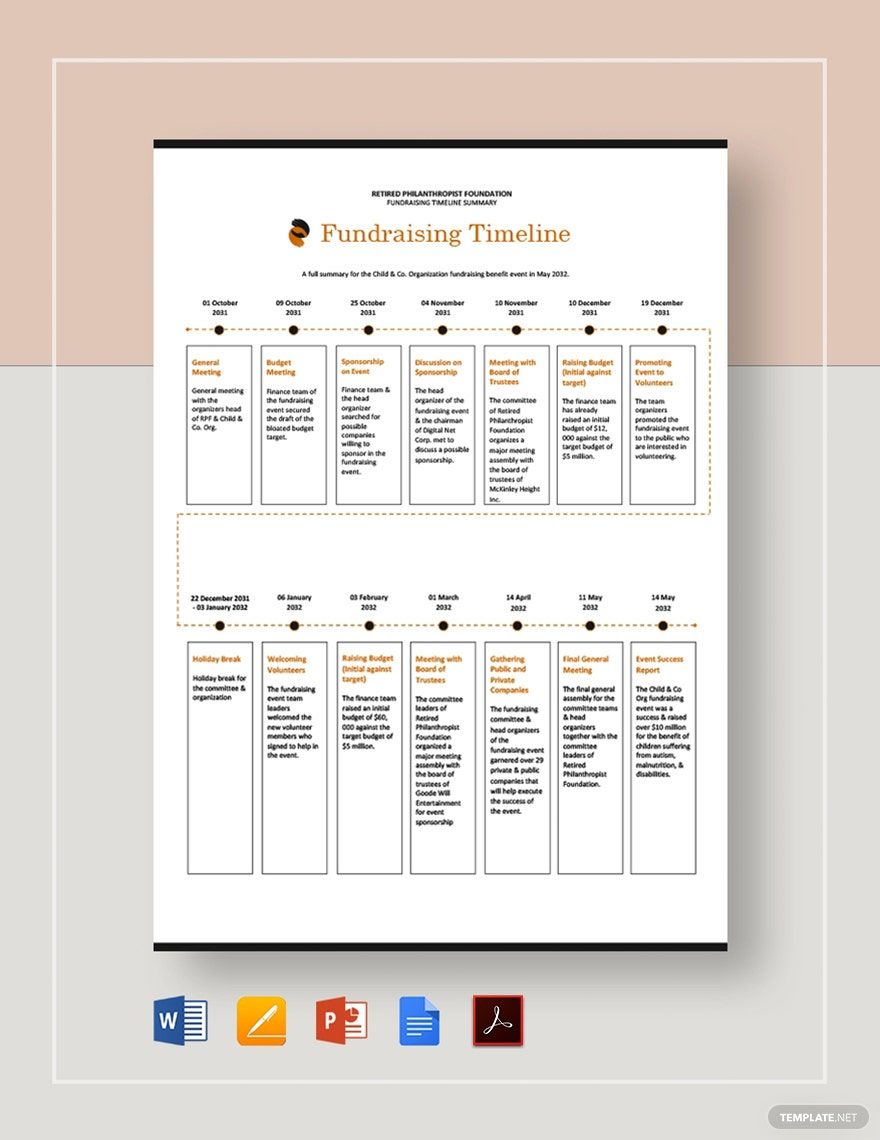
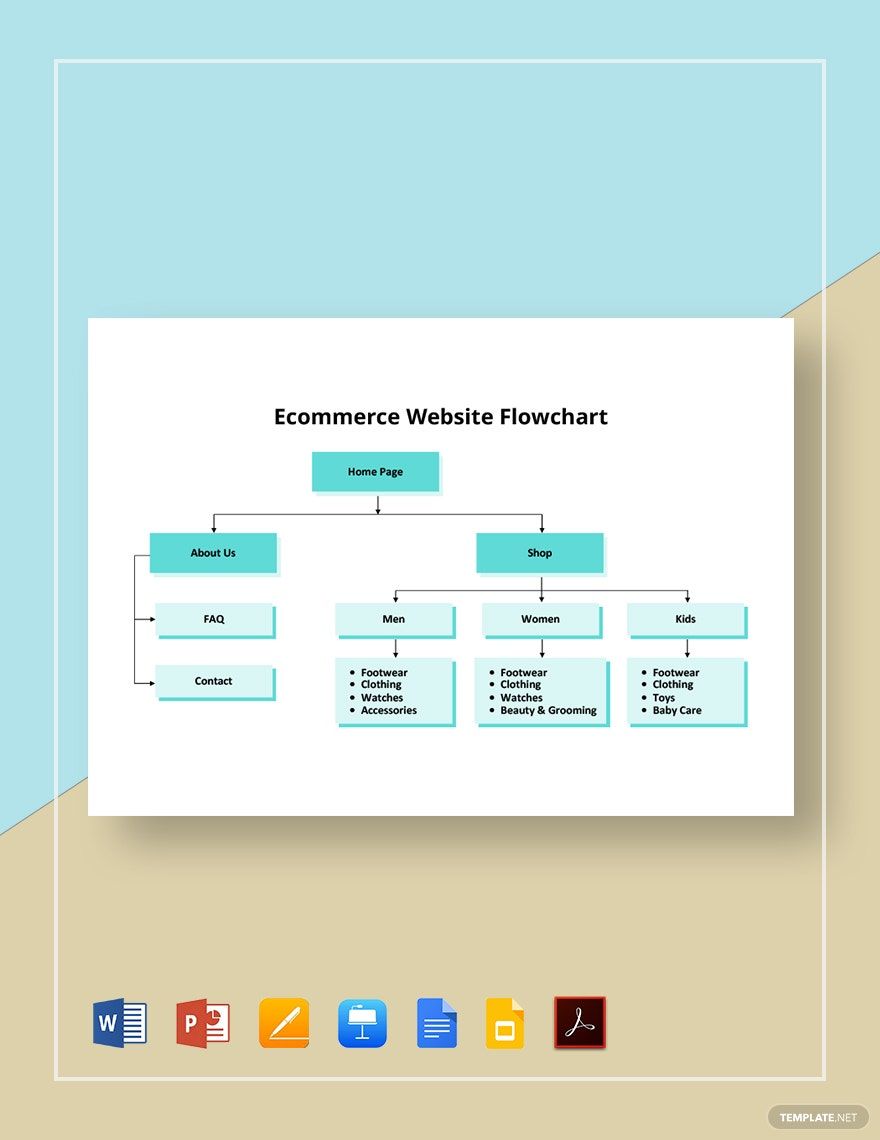
If you want an efficient graph, you need to select the right type of chart to represent the data. For example, you want to visualize a process flow in chronological order; you need to make a timeline chart. But if you are going to compare two objects or data, then you need to create a comparison chart. There are different types of charts that will suit the data you want to present. You can research more on the different charts so that you will be able to choose the perfect one for you.
3. Title
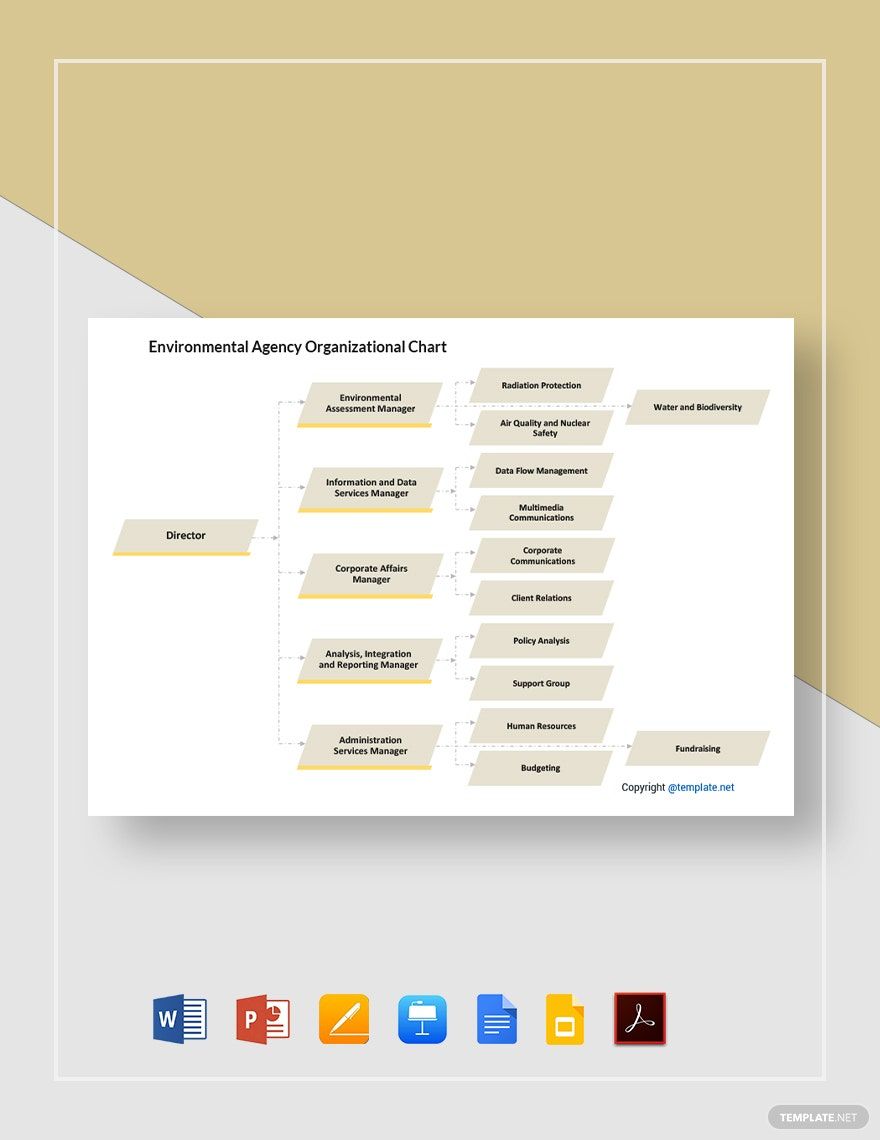
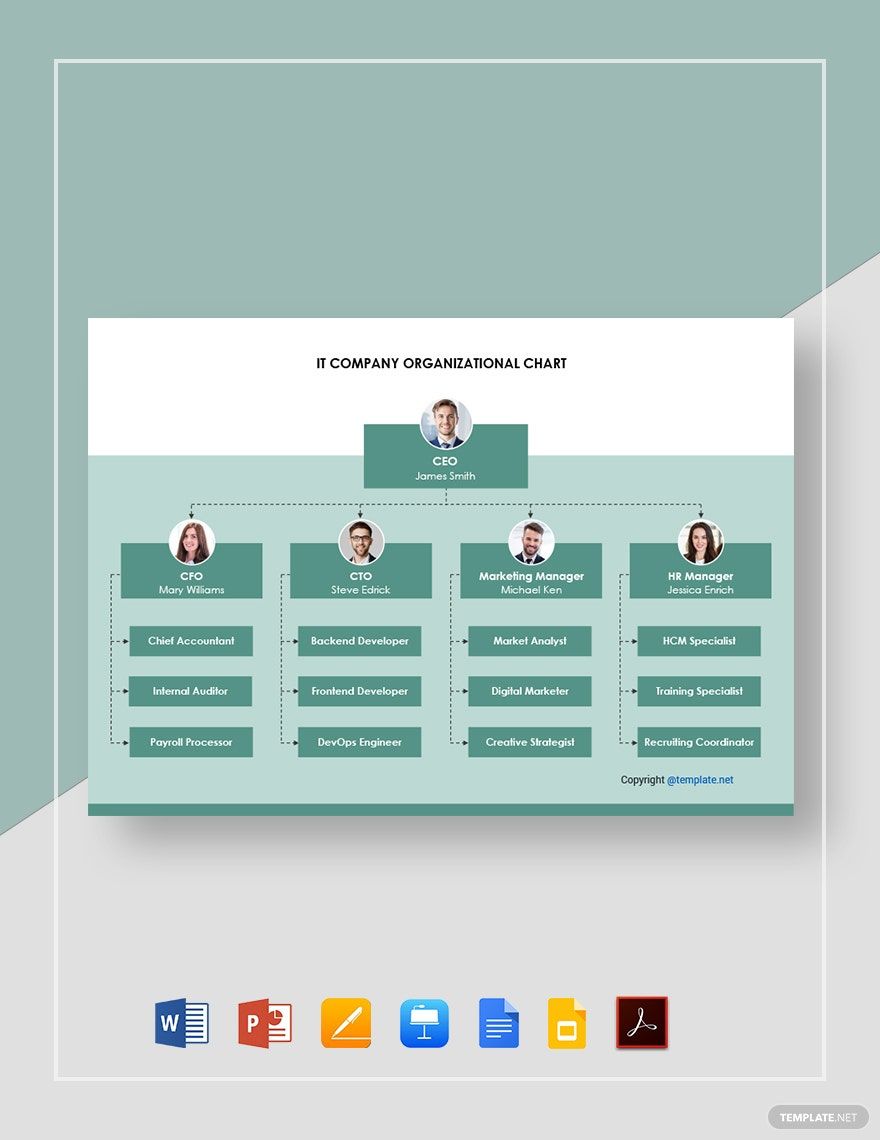
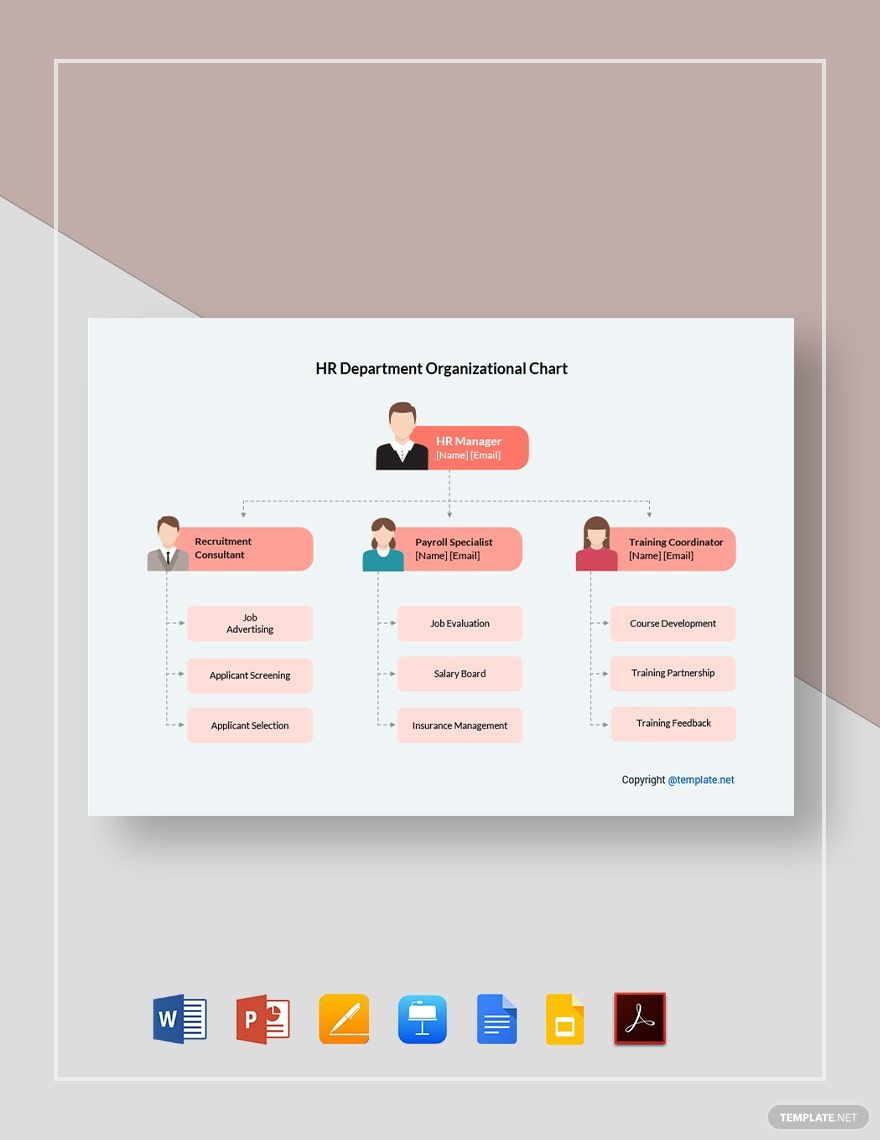
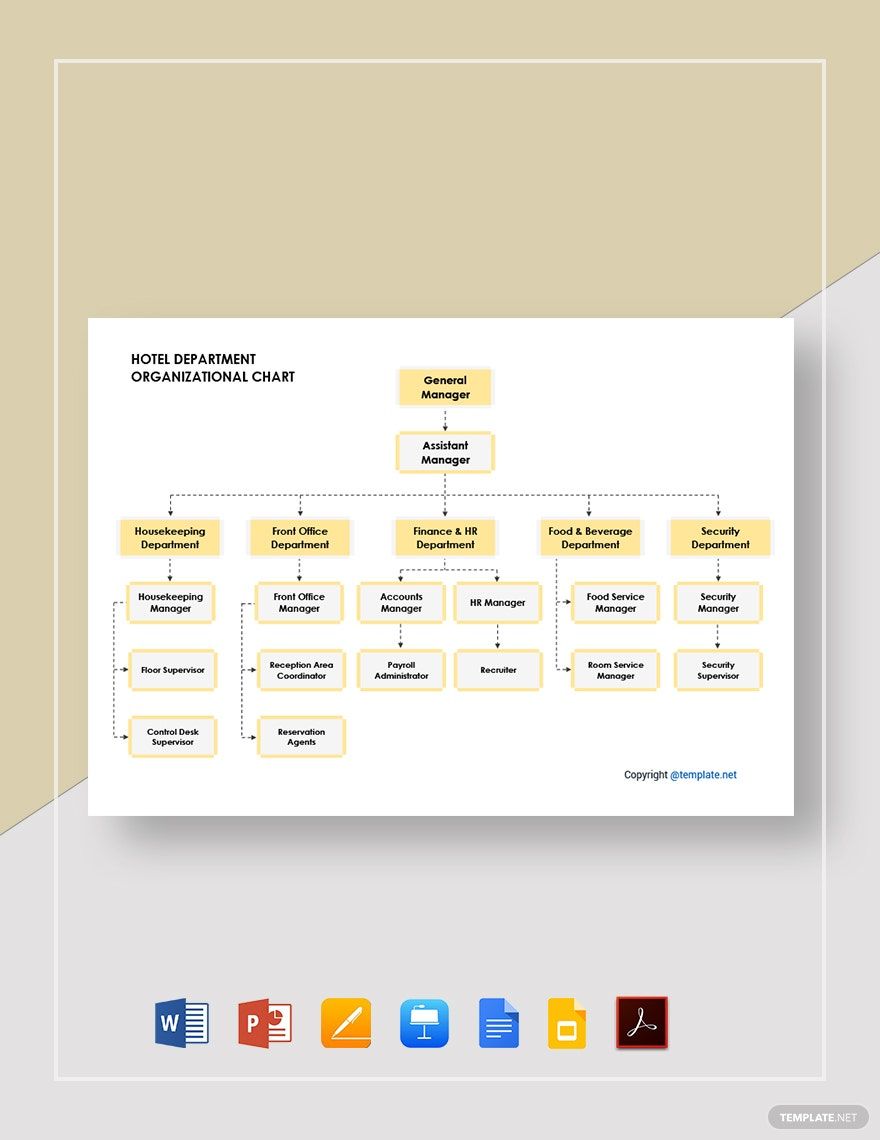
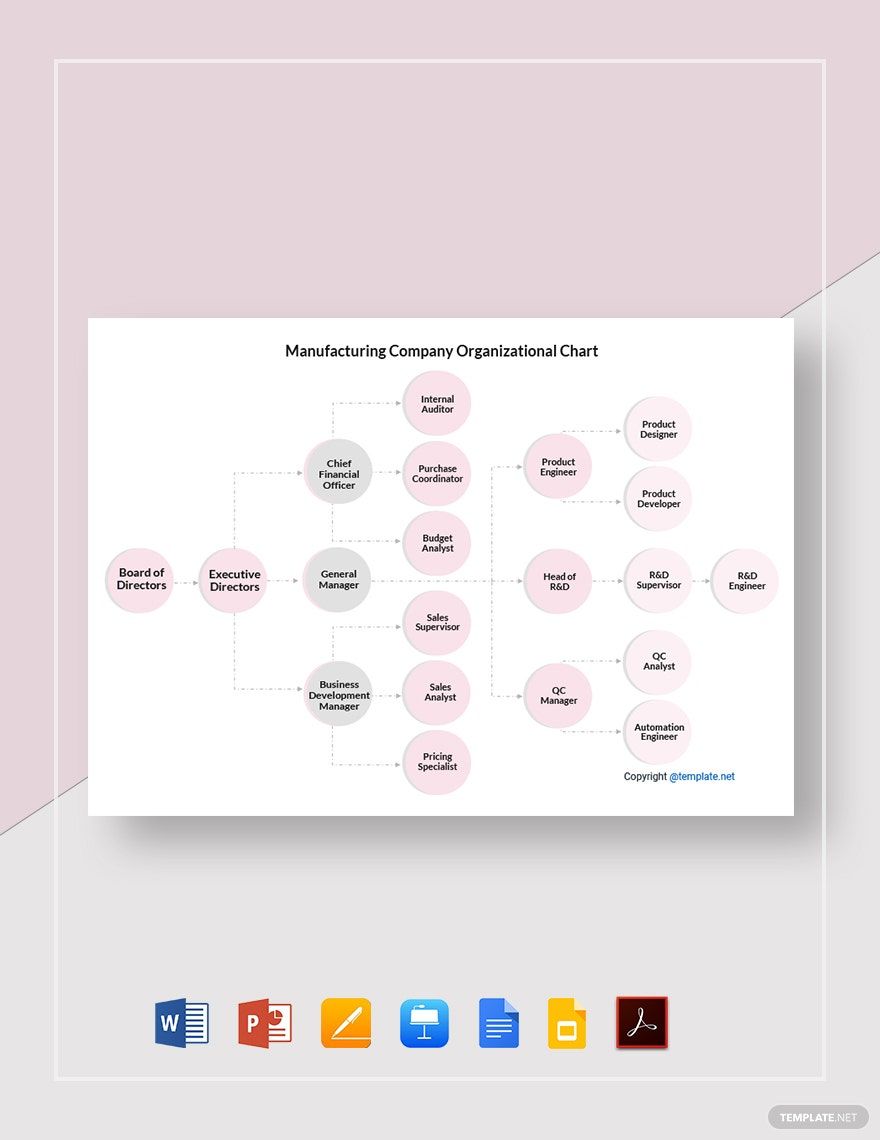
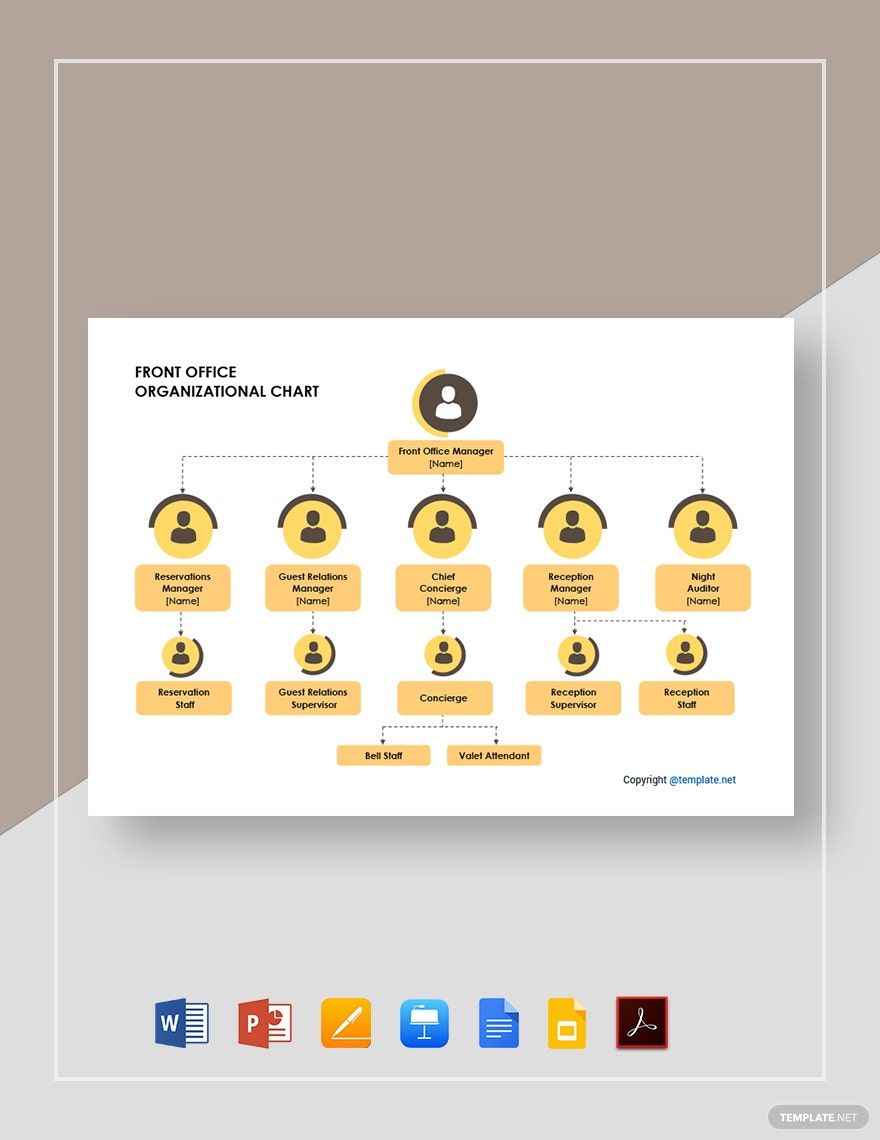
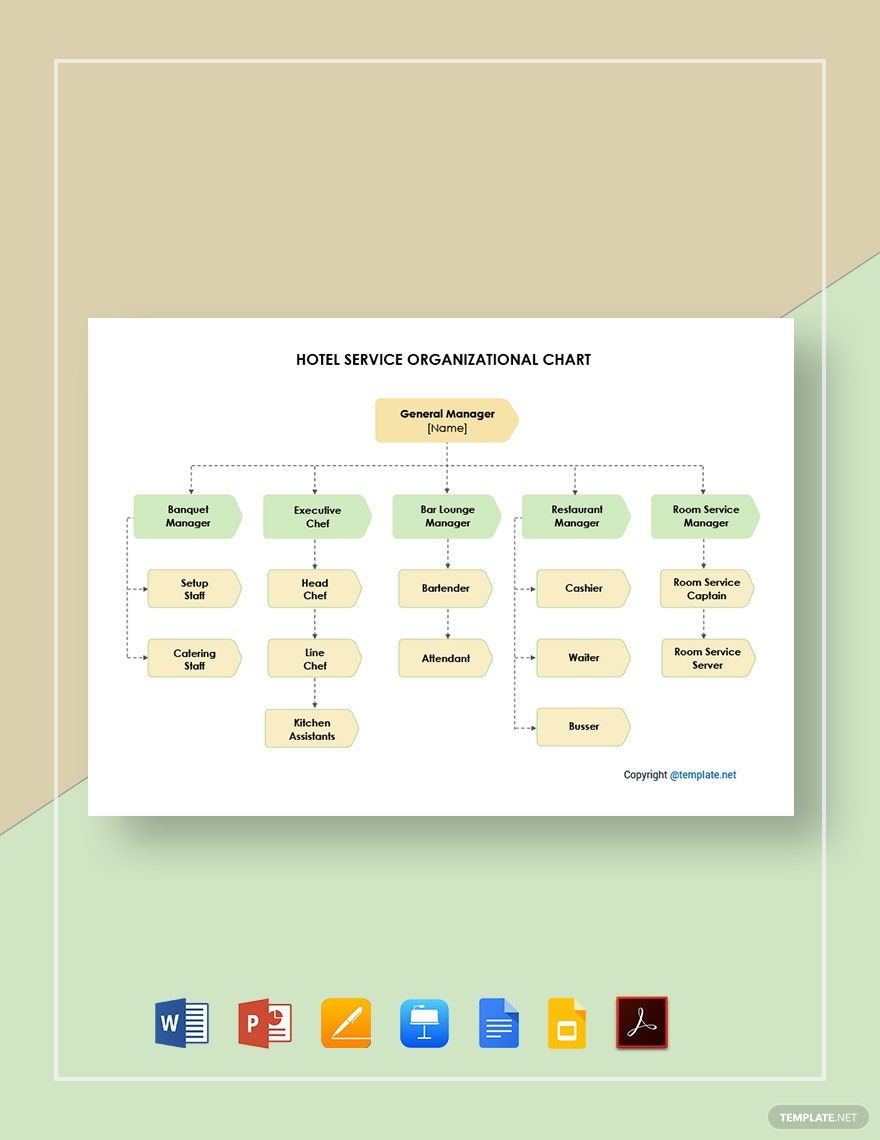
A chart should always have an appropriate title. The title will tell the viewers what the chart is all about and what they are going to learn if they continue reading it. The title you come up with needs to be related to the data or purpose of the chart. It is essential that the title should dwell on the subject matter to be discussed. To illustrate, you are going to make a basic chart that will point out the structure of an organization, parts, and positions, the title should be "Organizational Chart."
4. Content
For a simple chart to become effective, it needs accurate and reliable information. Therefore, whether you create a seating, behavior, timeline, reward, or flow chart, make sure that you have the complete data to make your chart. Sit down and brainstorm or research what you are going to write in the content. Keep updating the content of your chart so that it will be the latest data.
5. Color Scheme
The use of an attractive color scheme is an important attribute of a successful sample chart. Make use of the color chart to determine the perfect color combination. If you are going to use bar charts or even a pie chart to point out the data you've collected, then each piece of information you are going to share needs an assigned distinct color. You can also choose a background color for your chart; however, make sure that the color does not clash with the color of the font and the chart elements.
