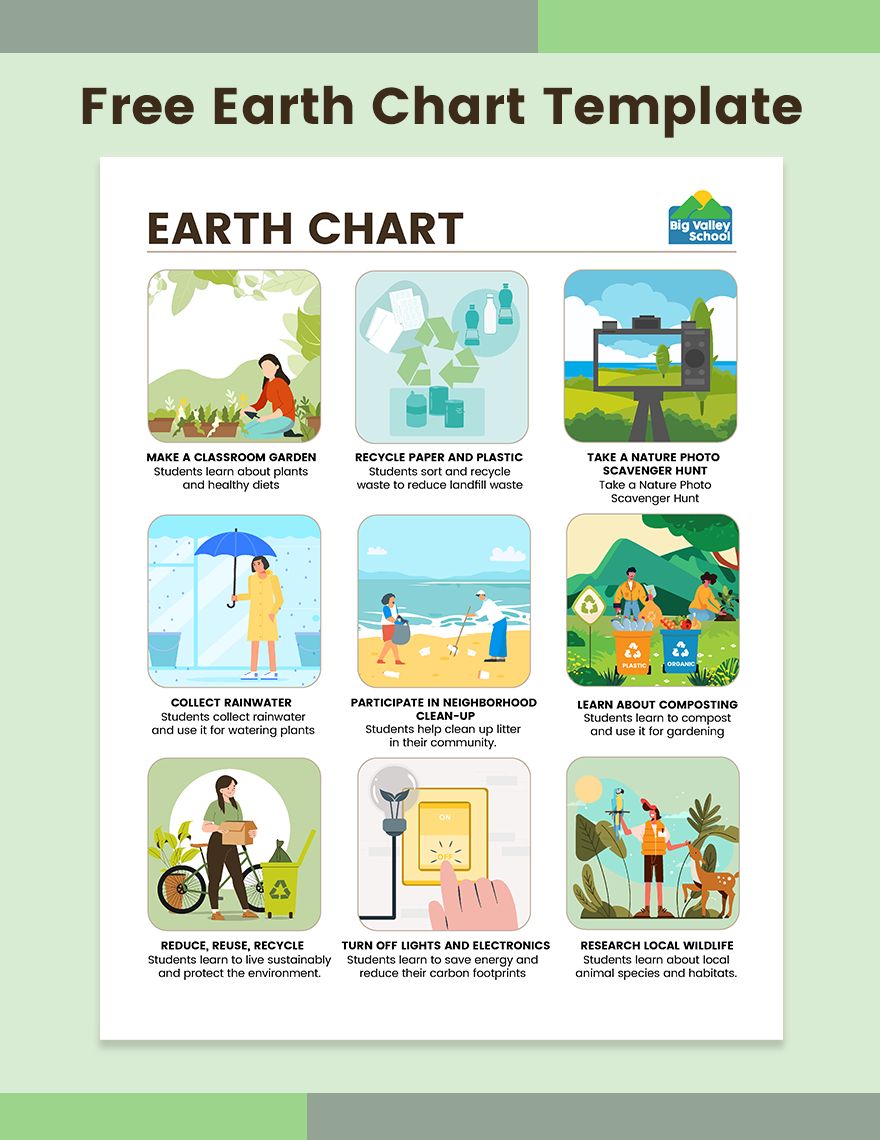
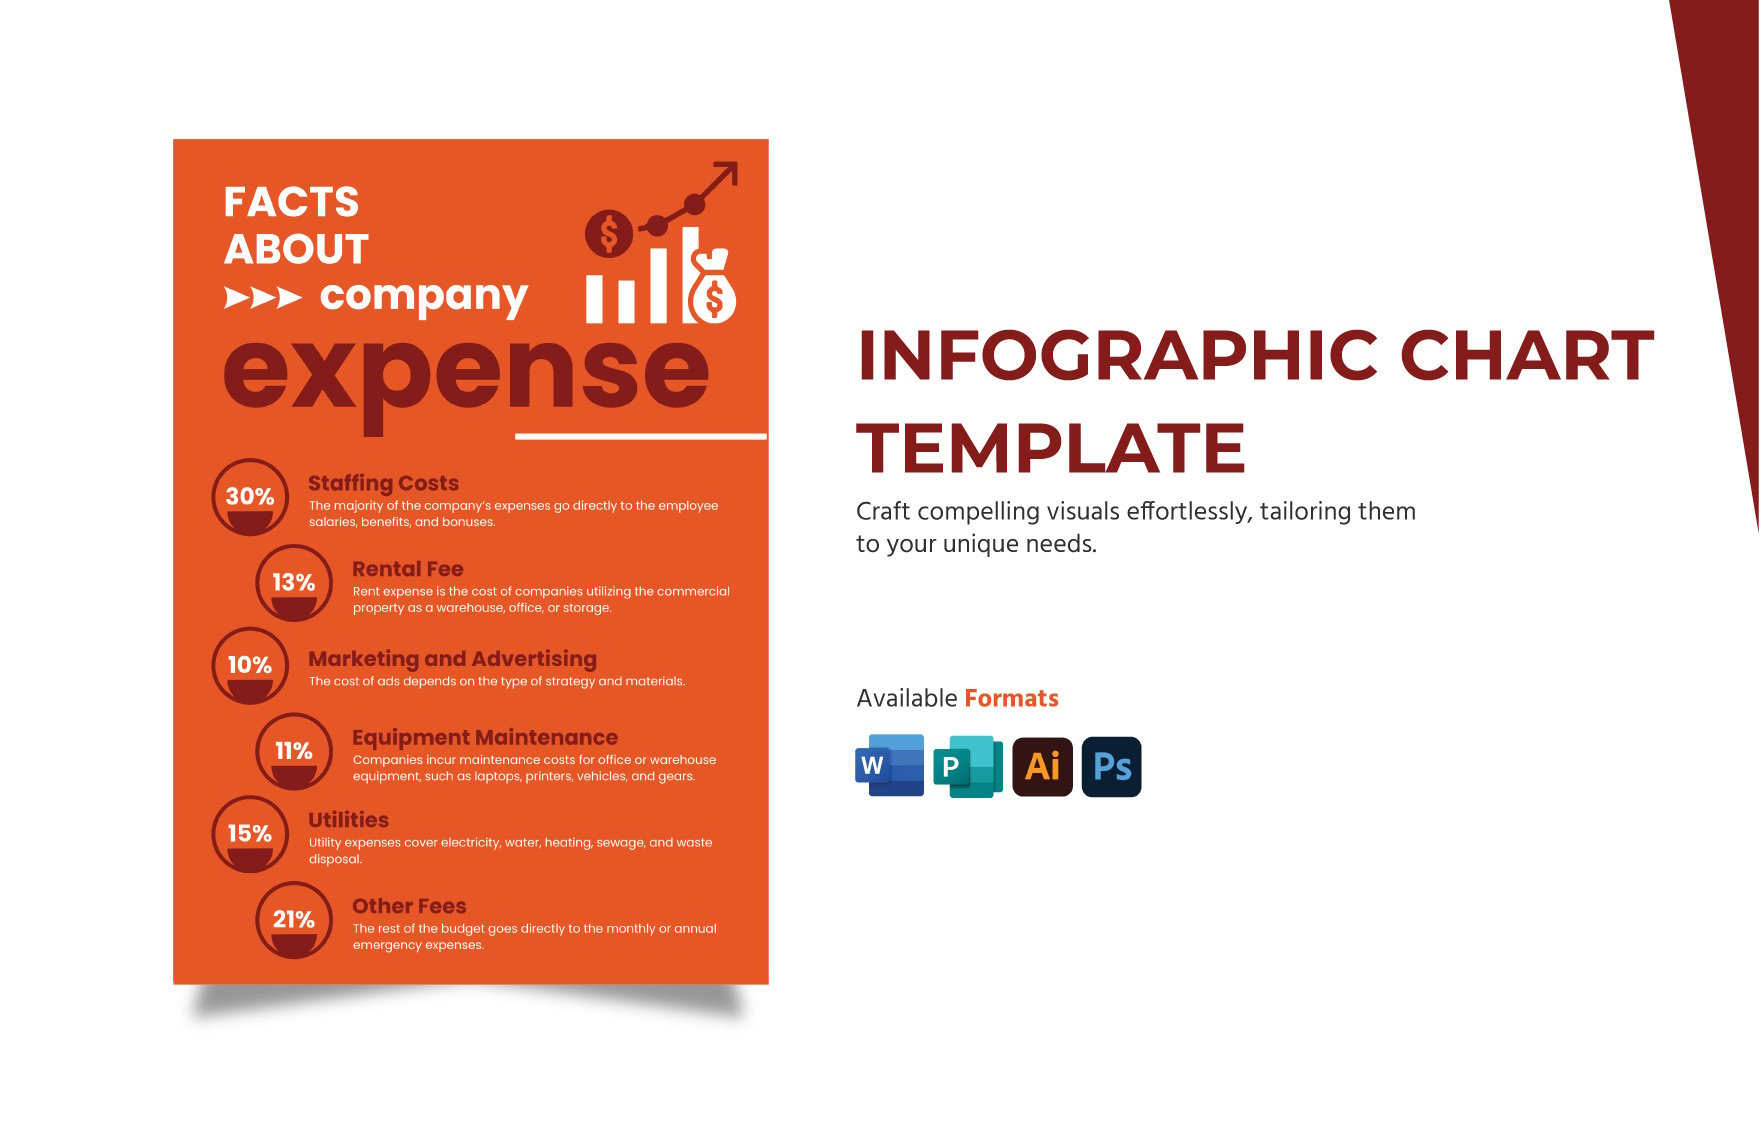
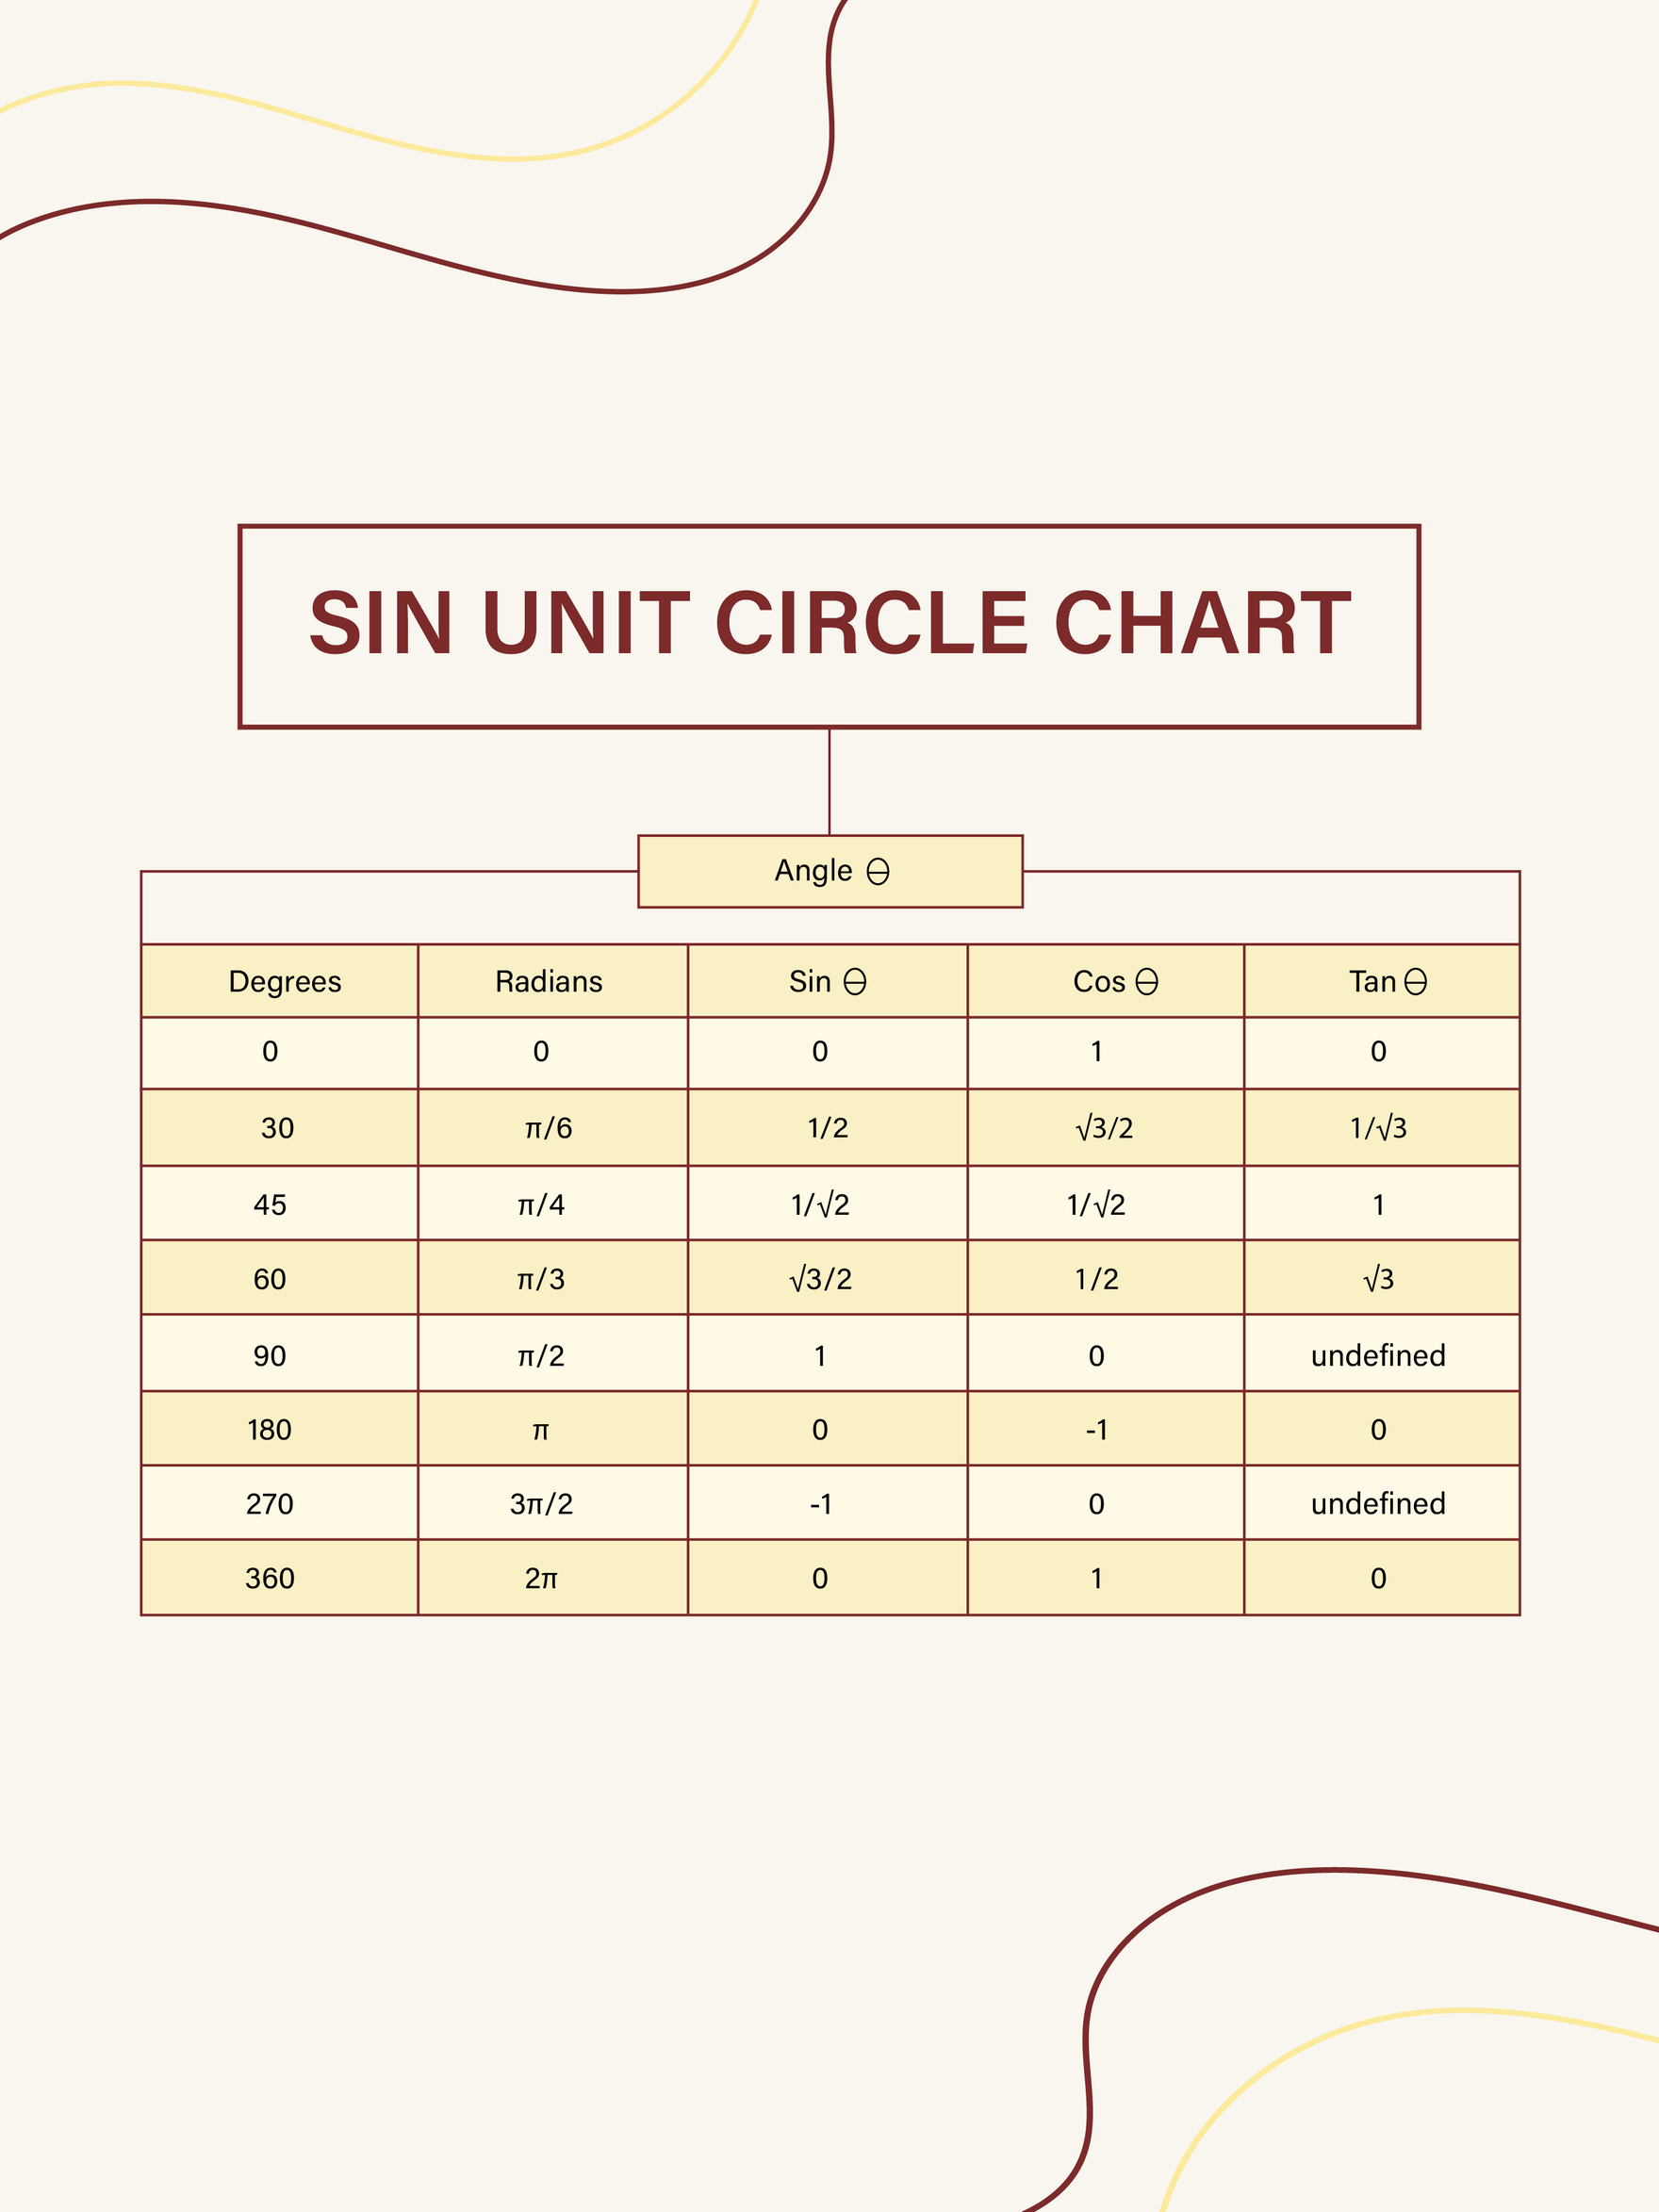
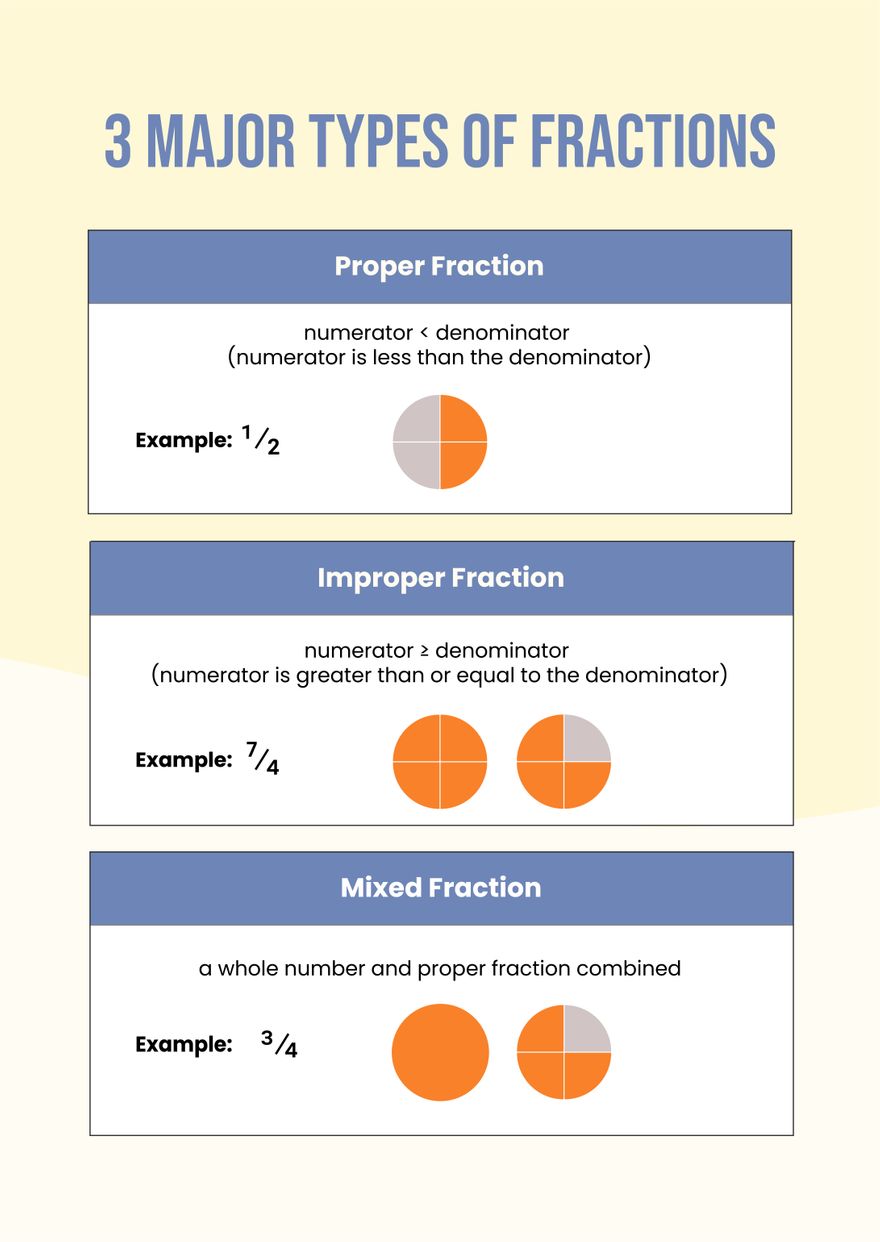
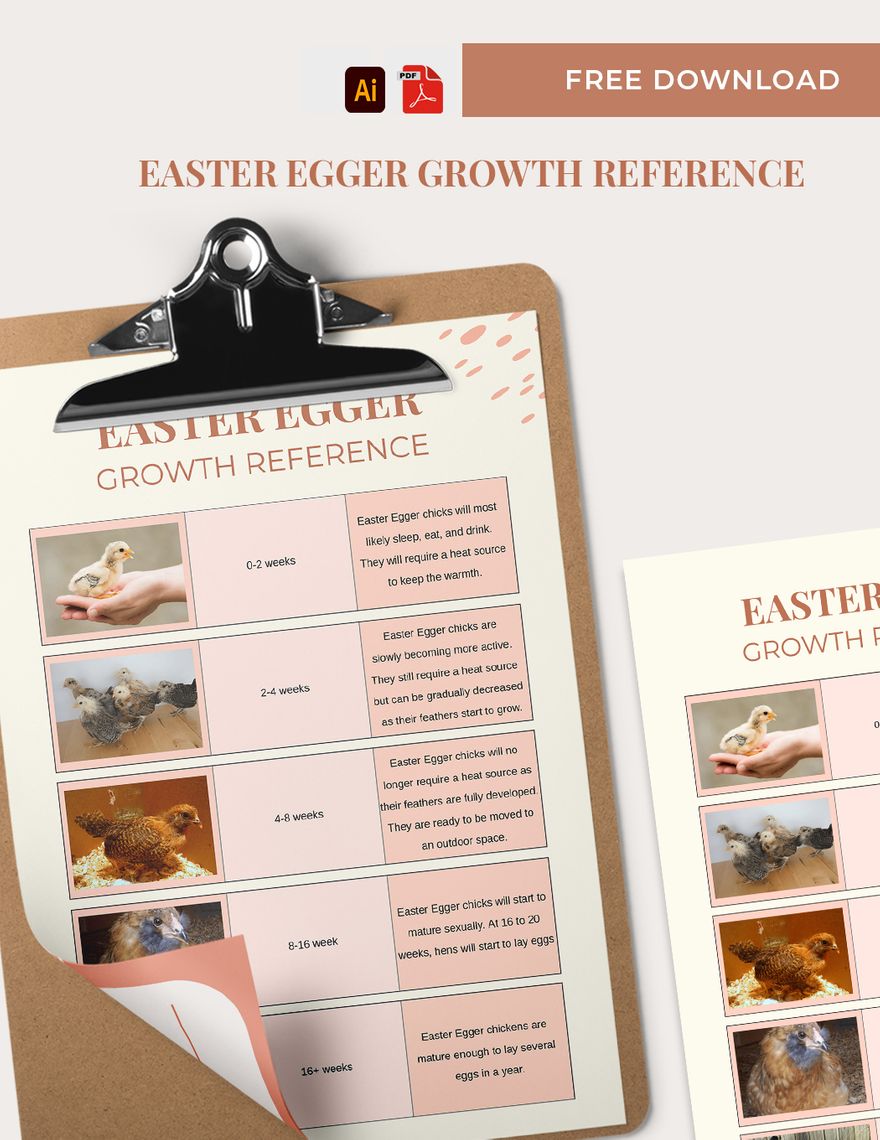
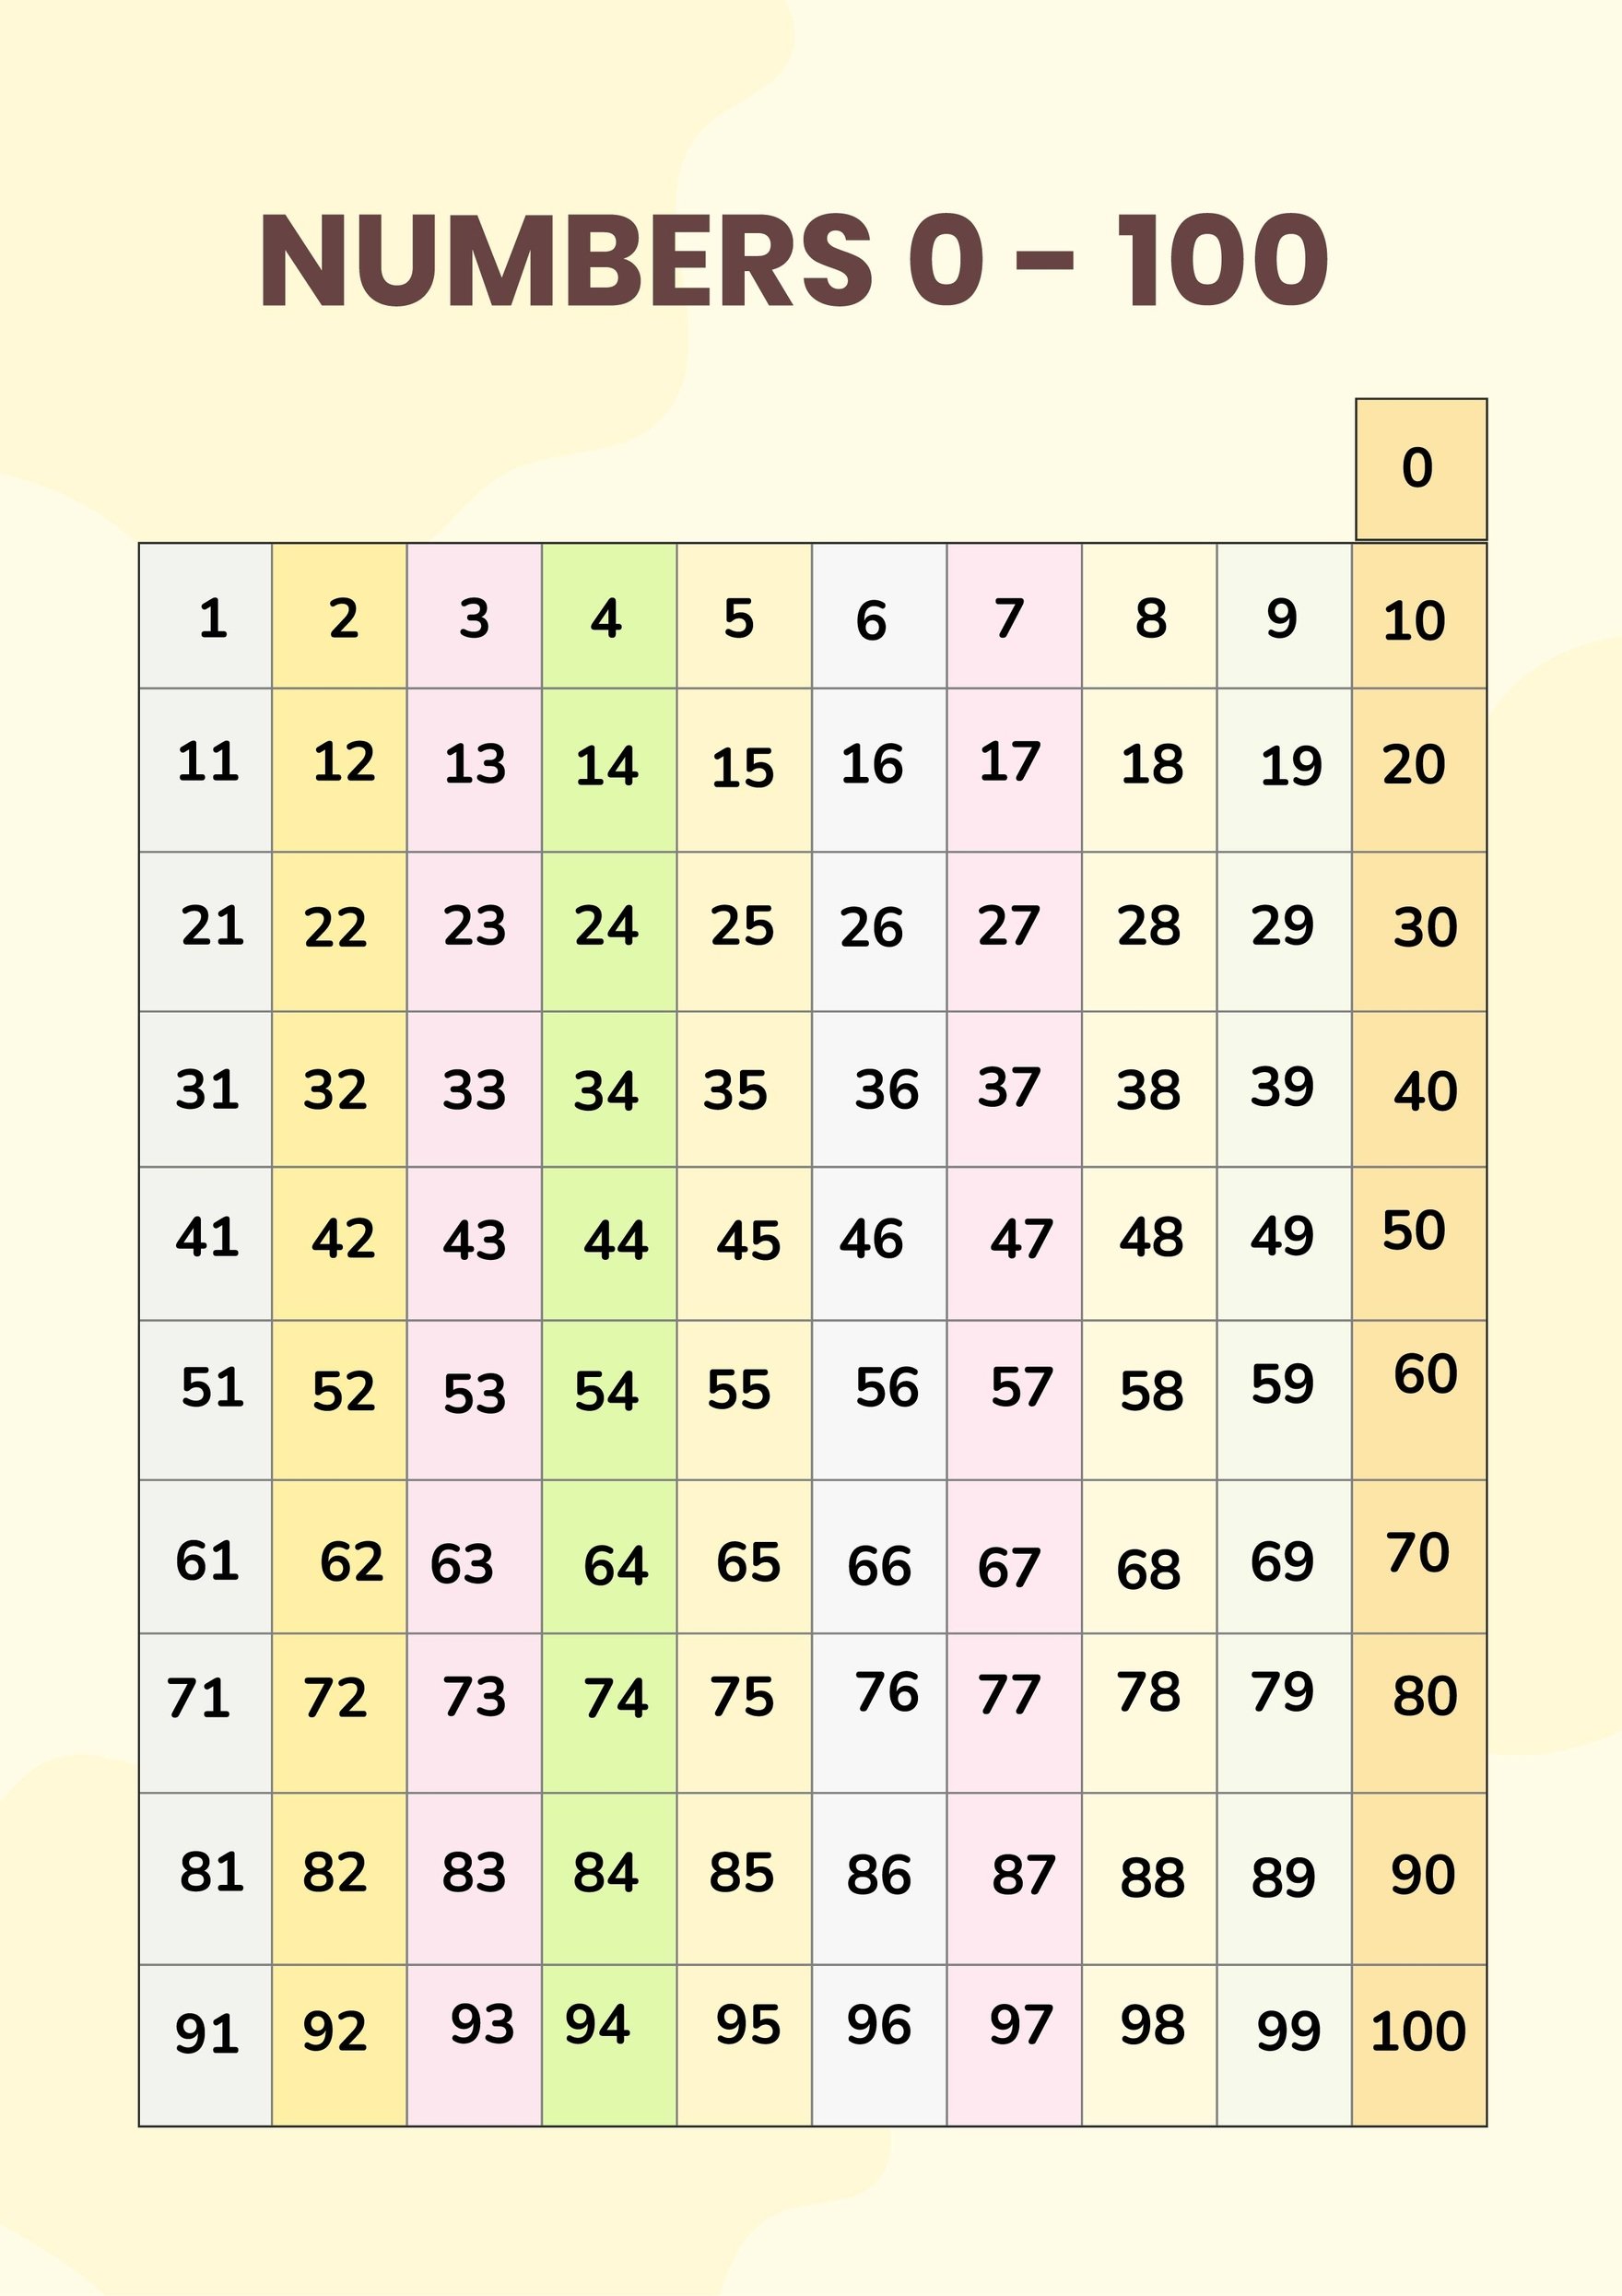
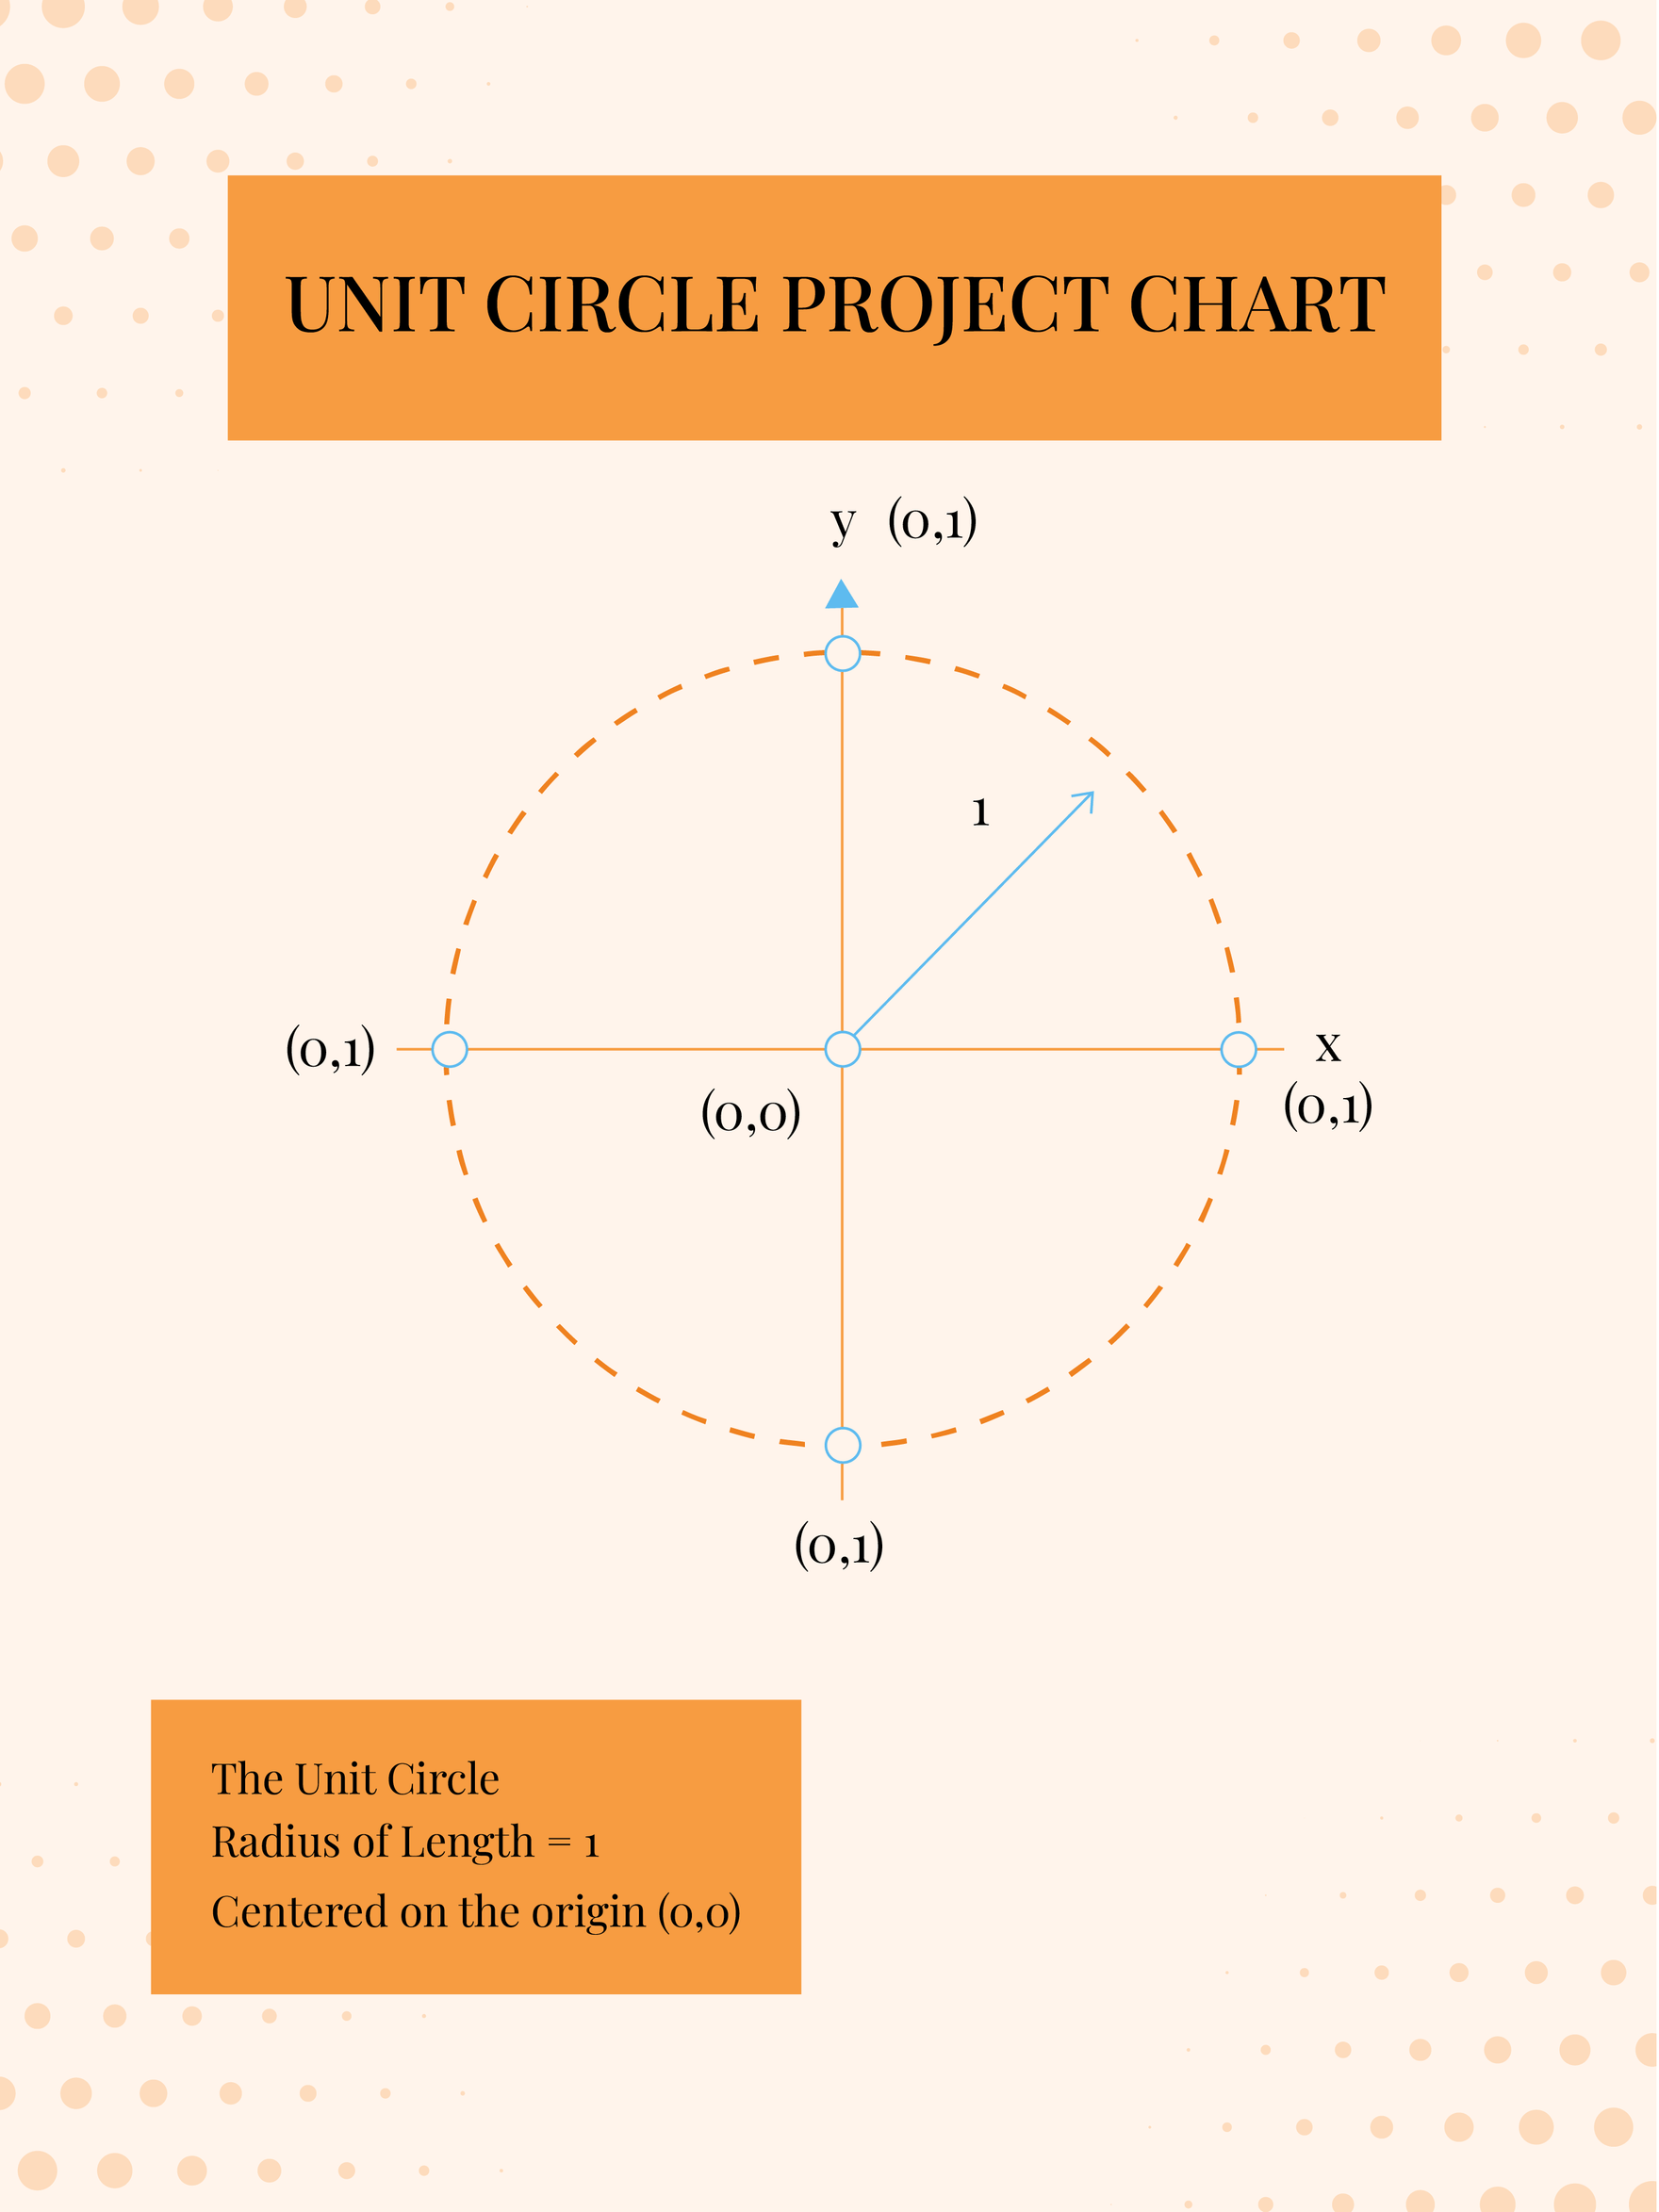
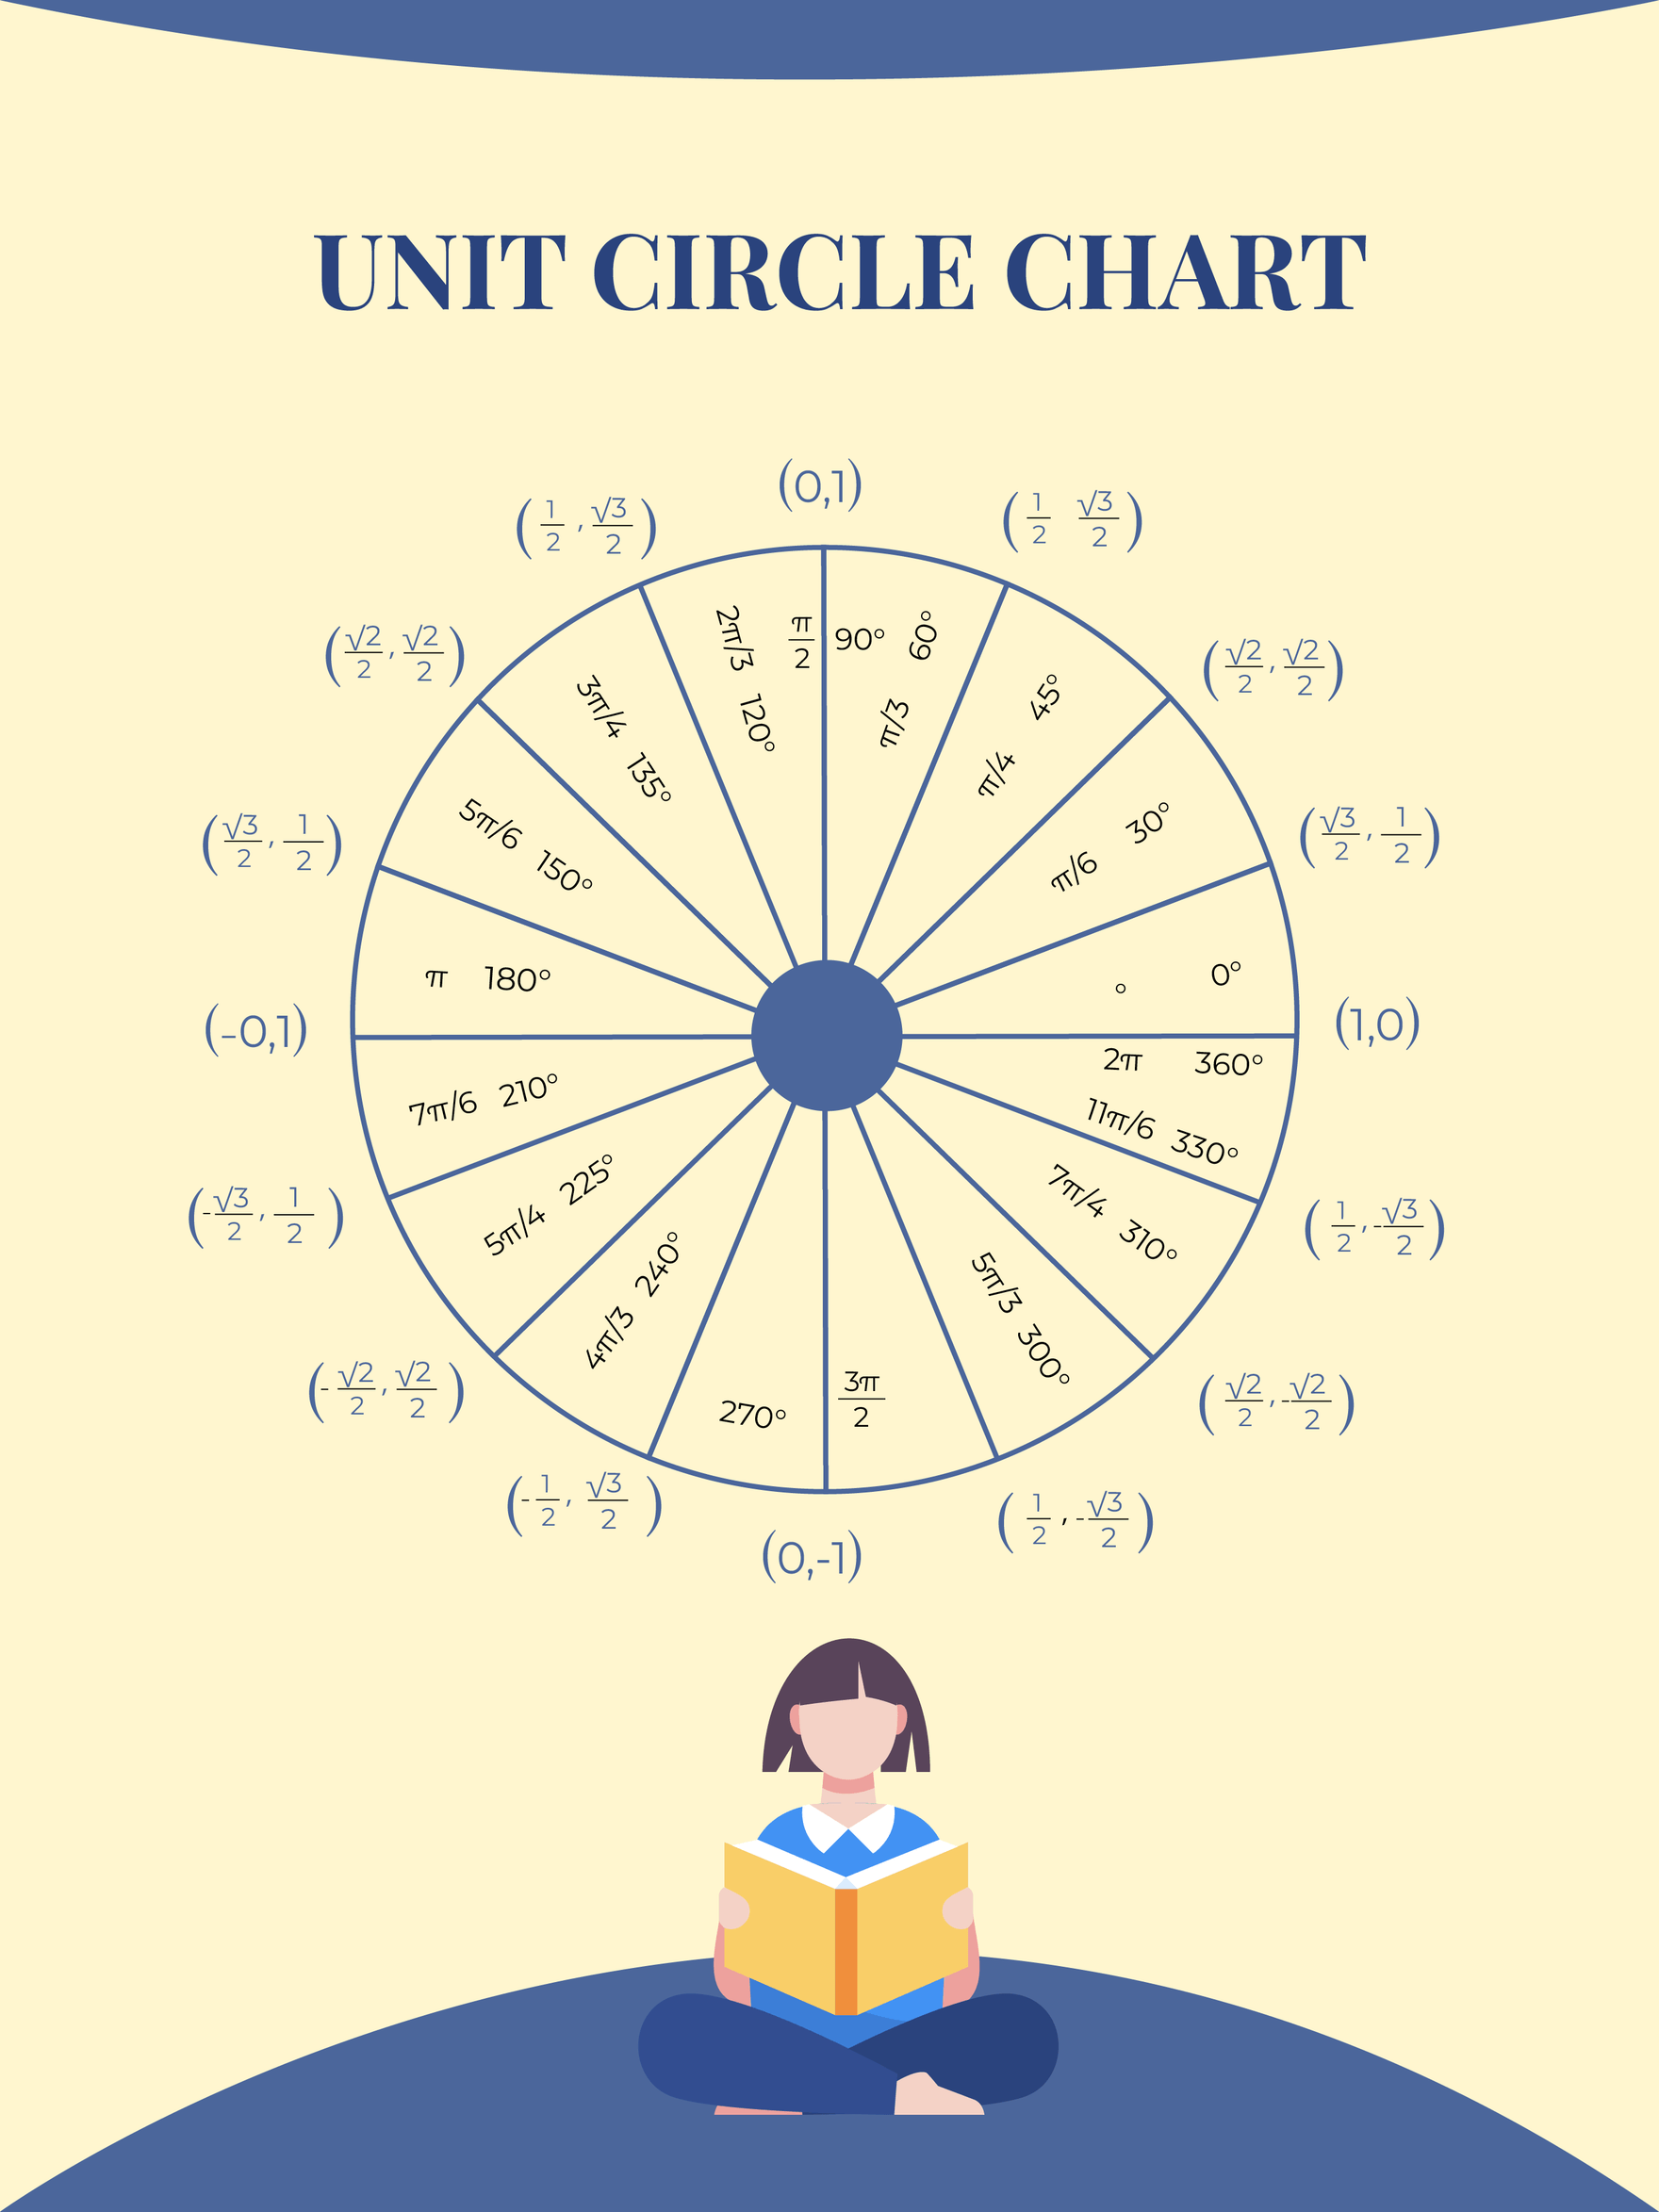
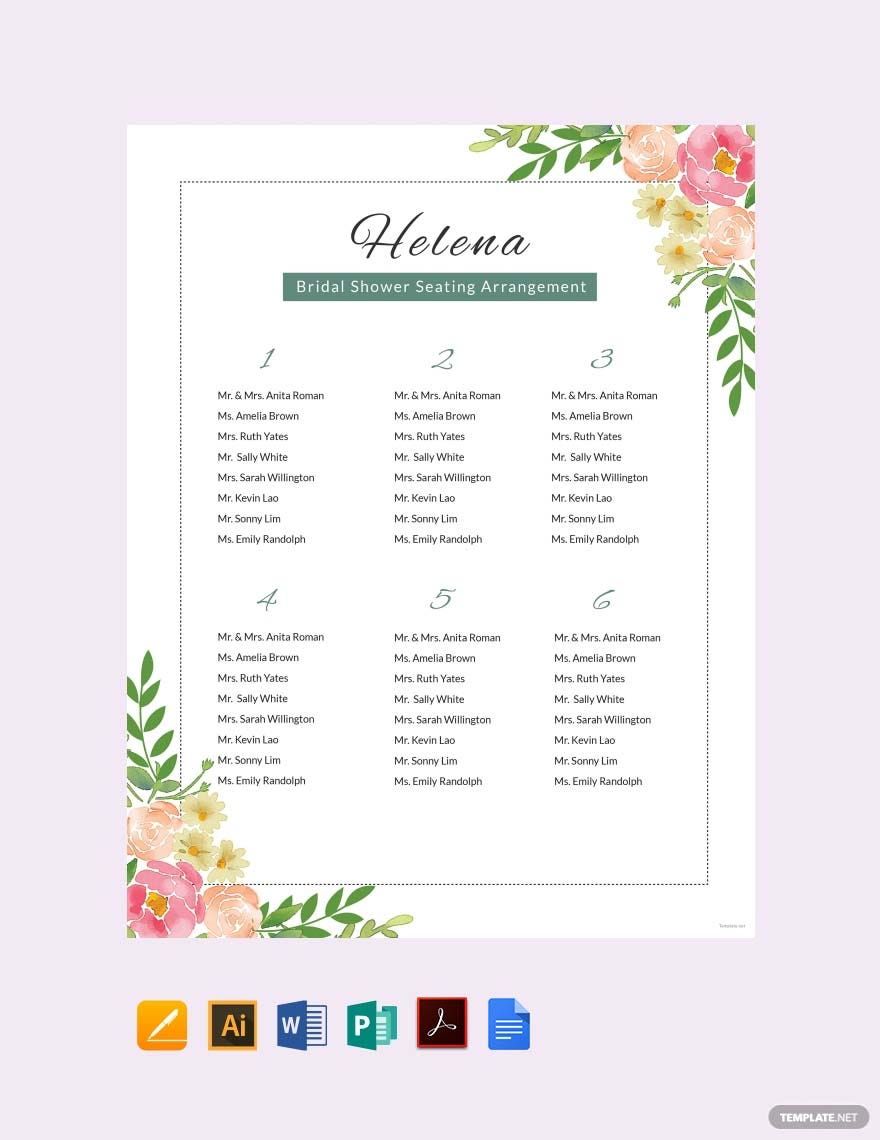
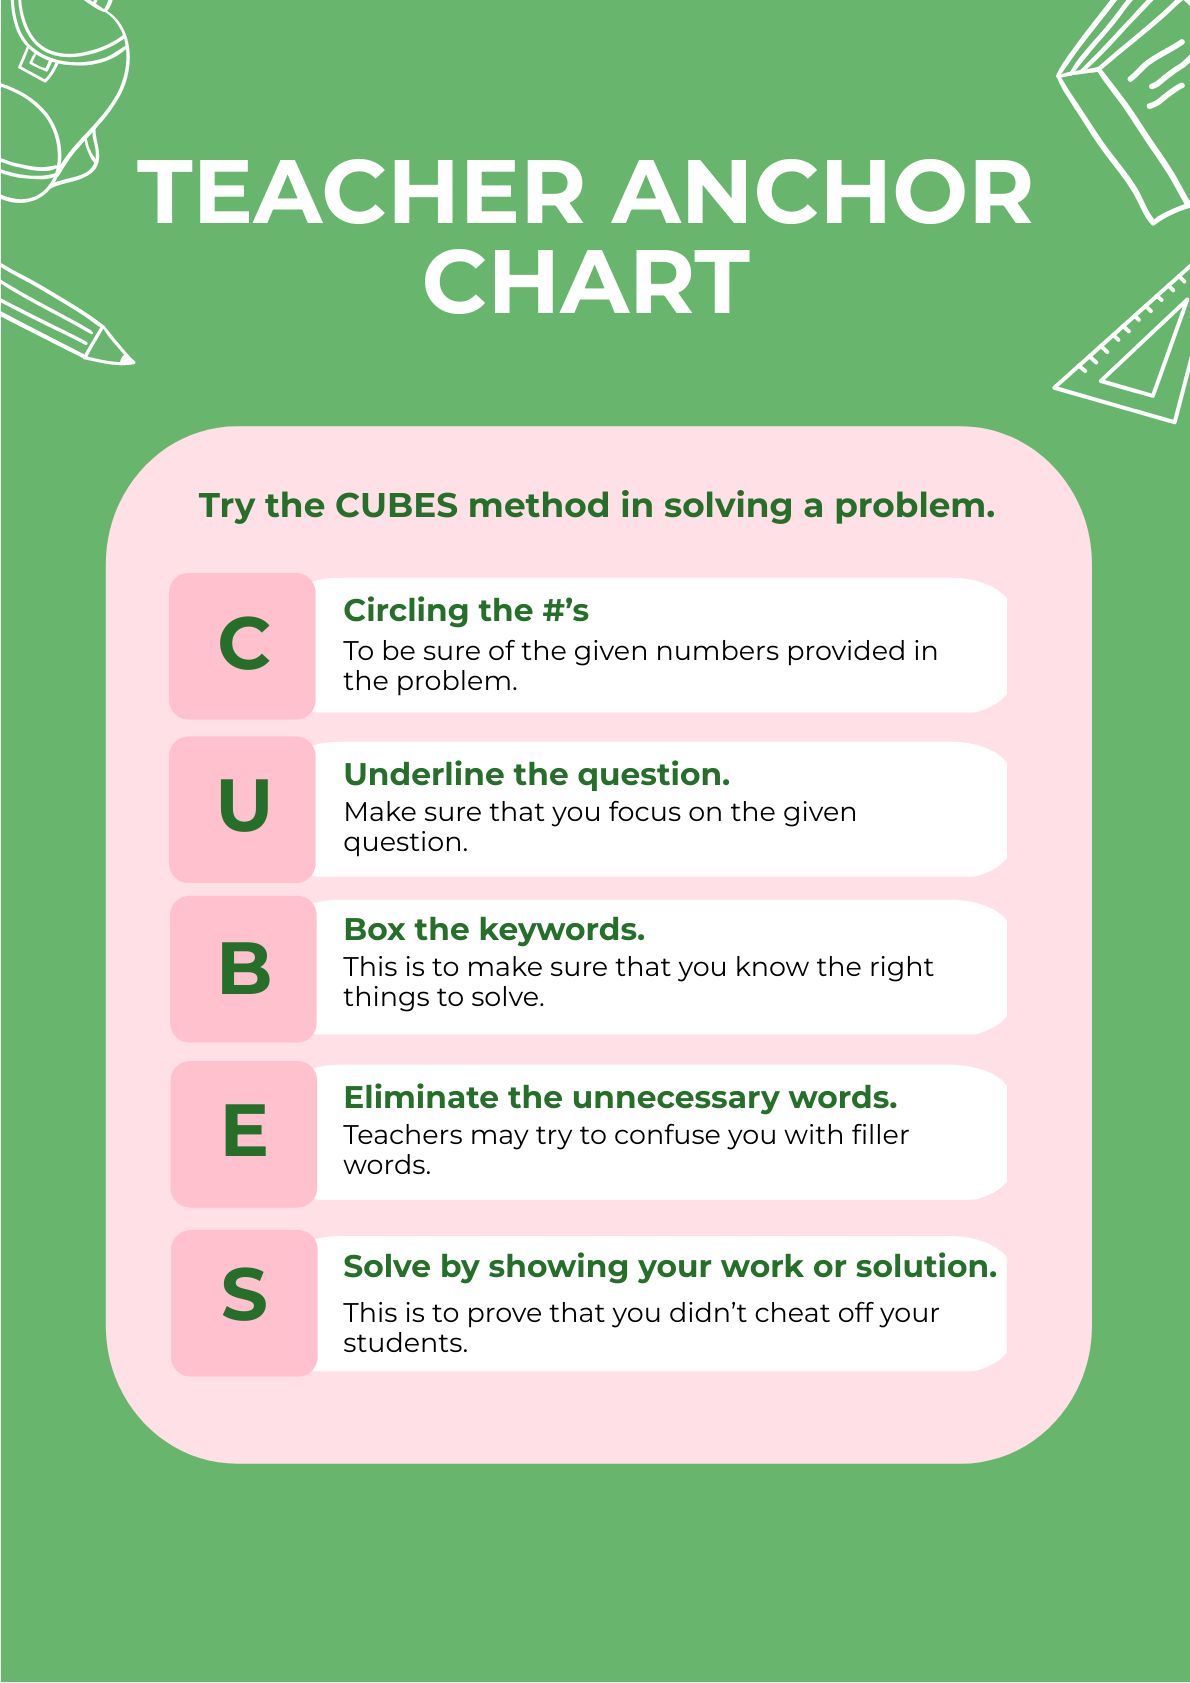
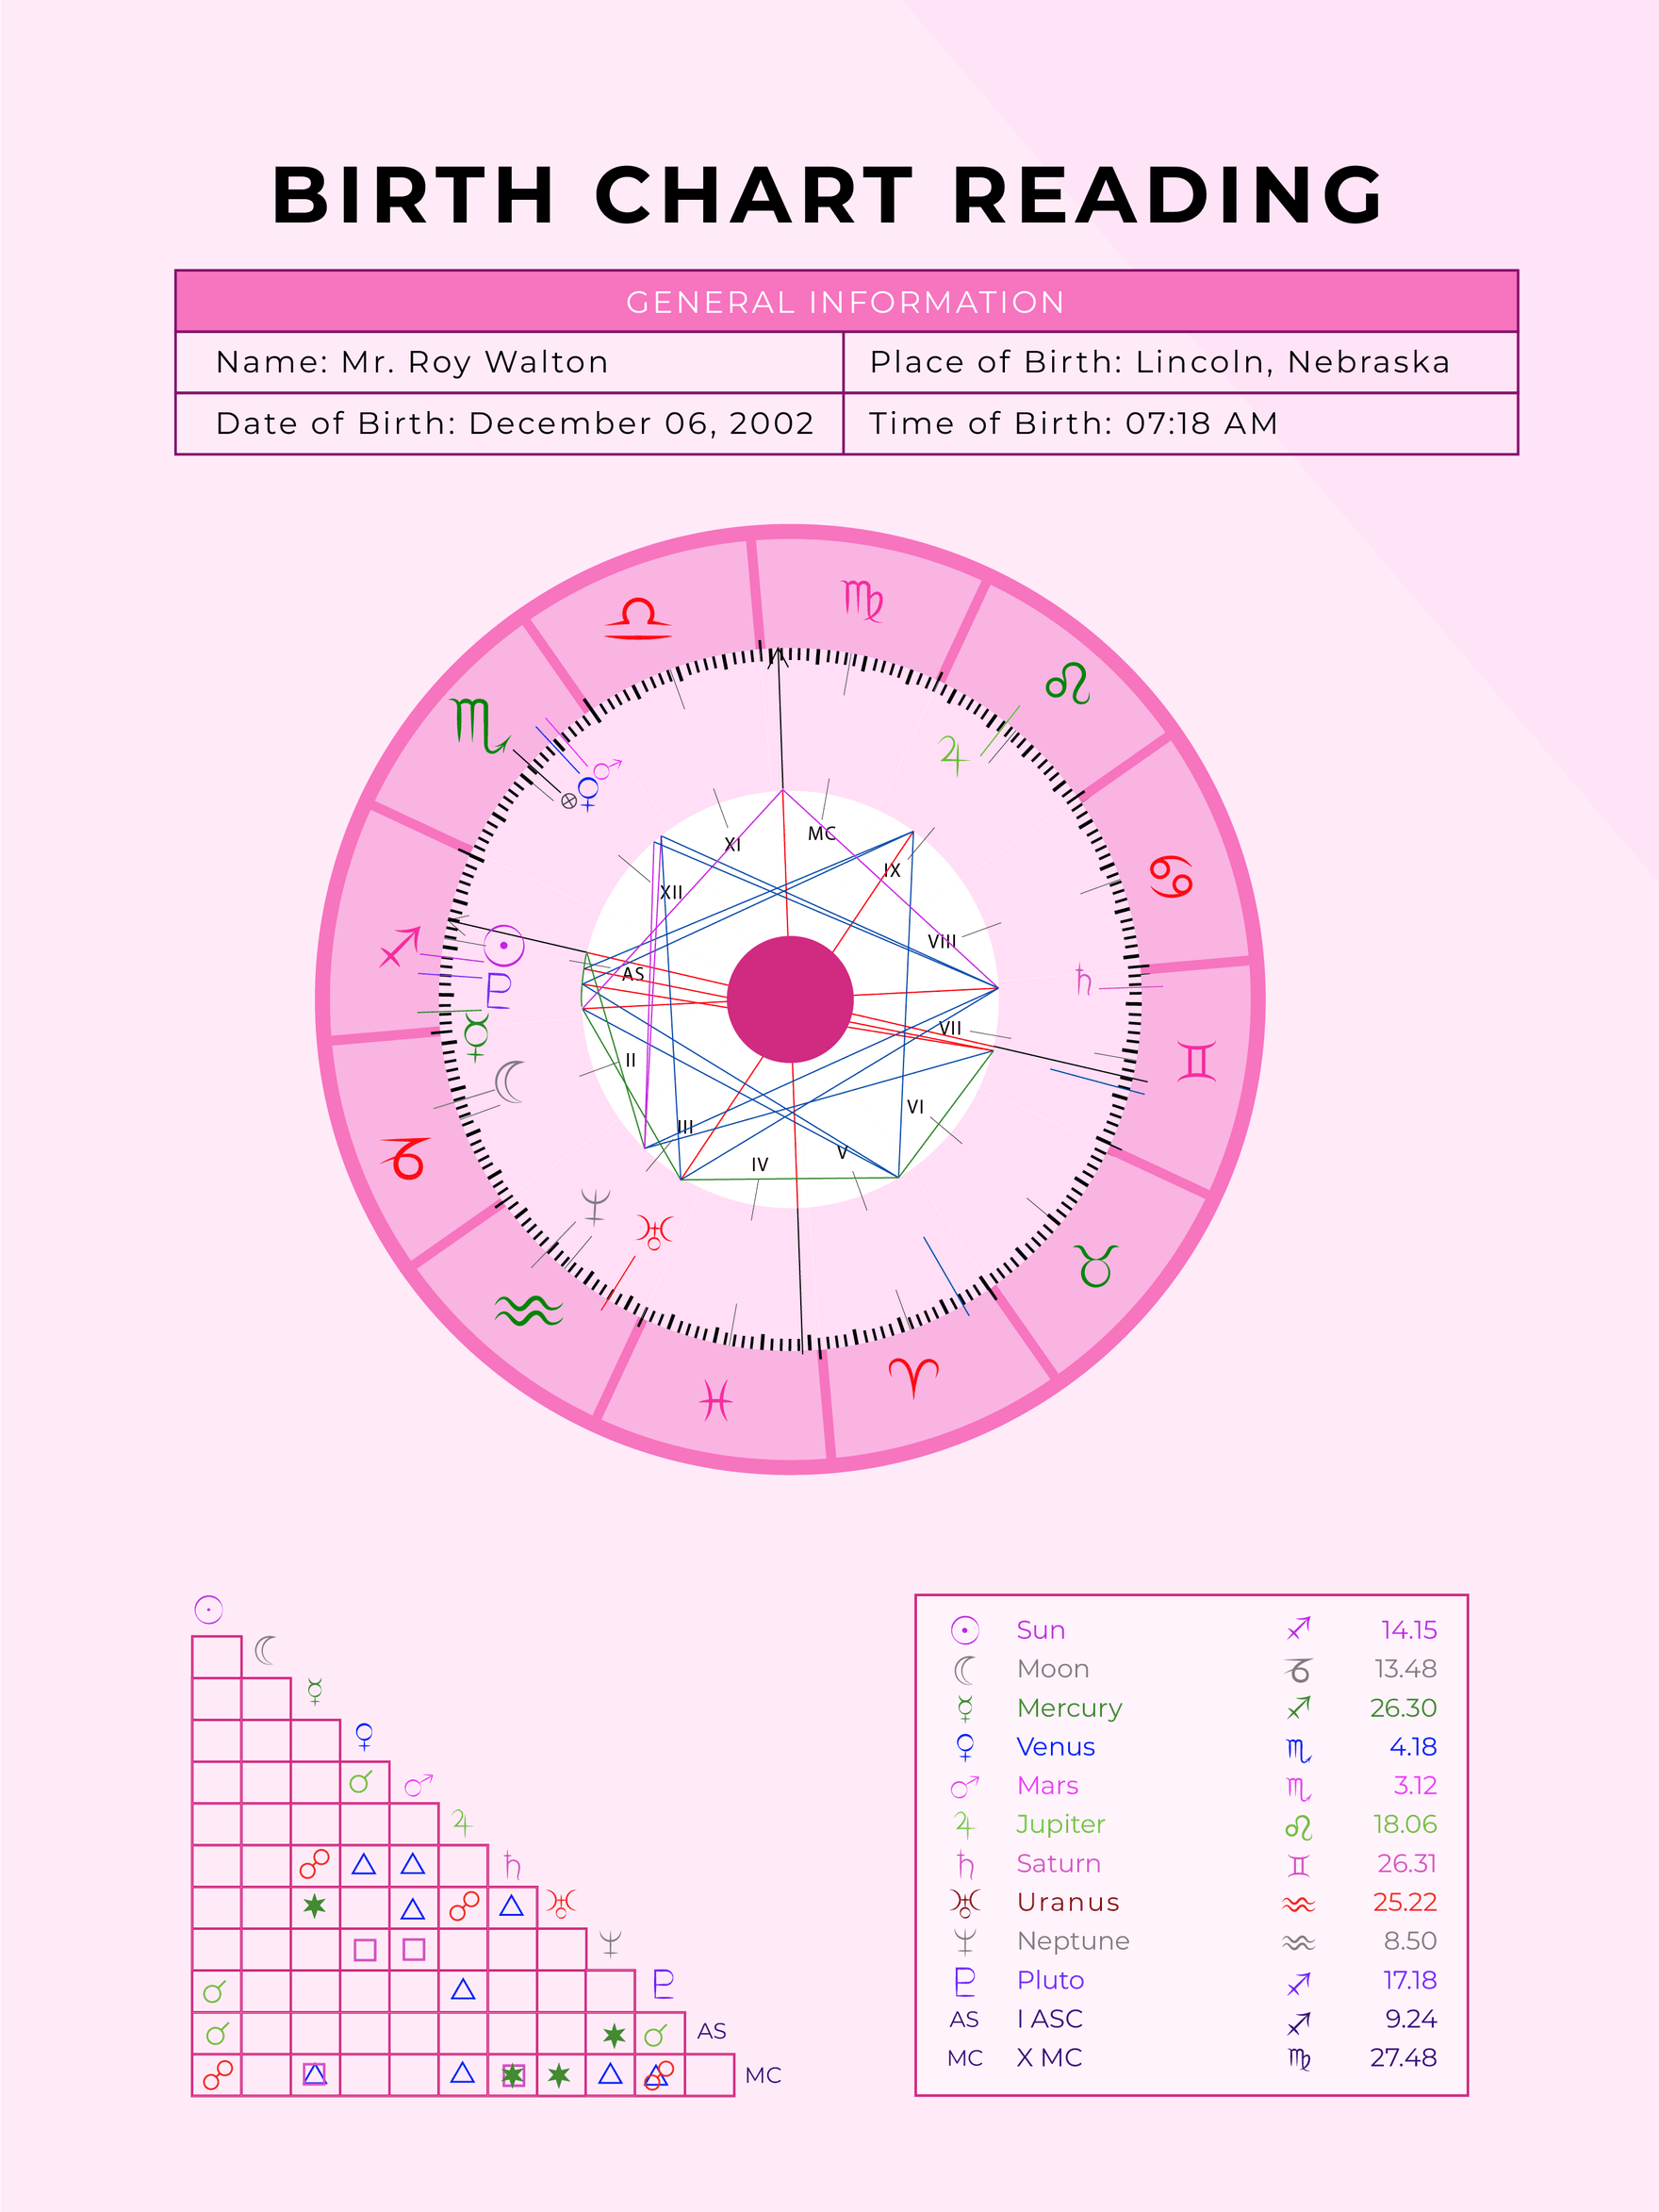
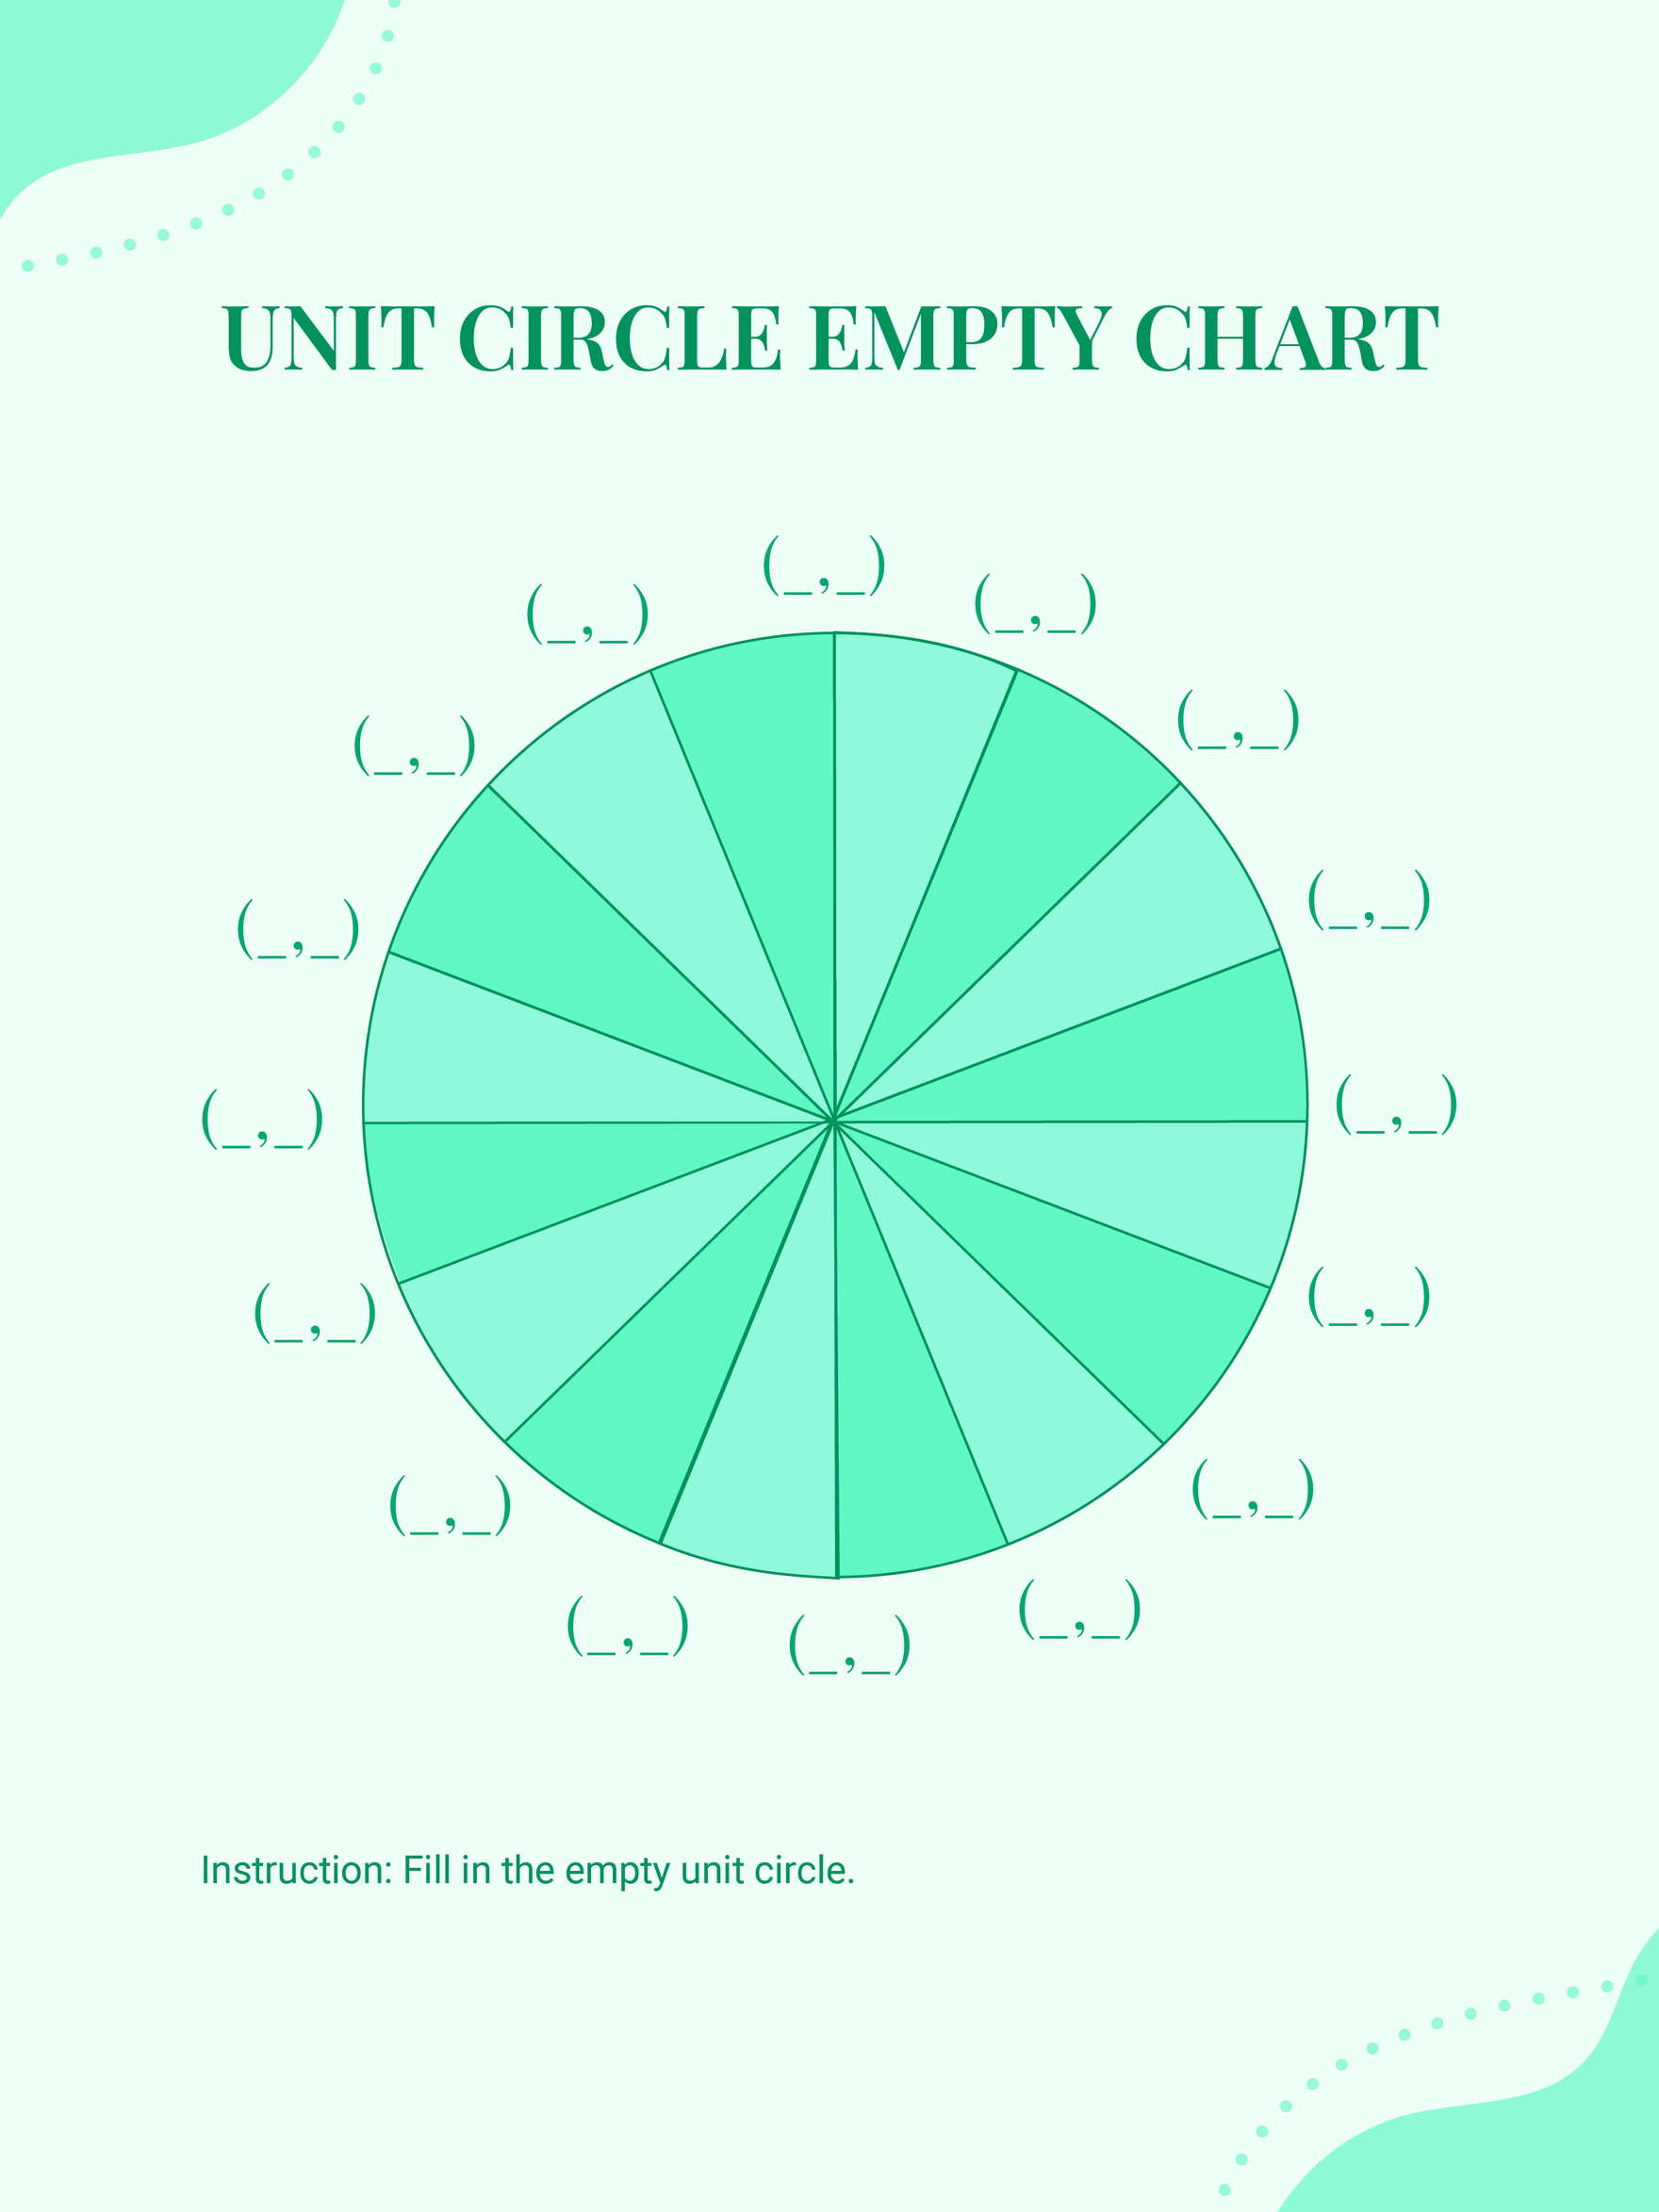
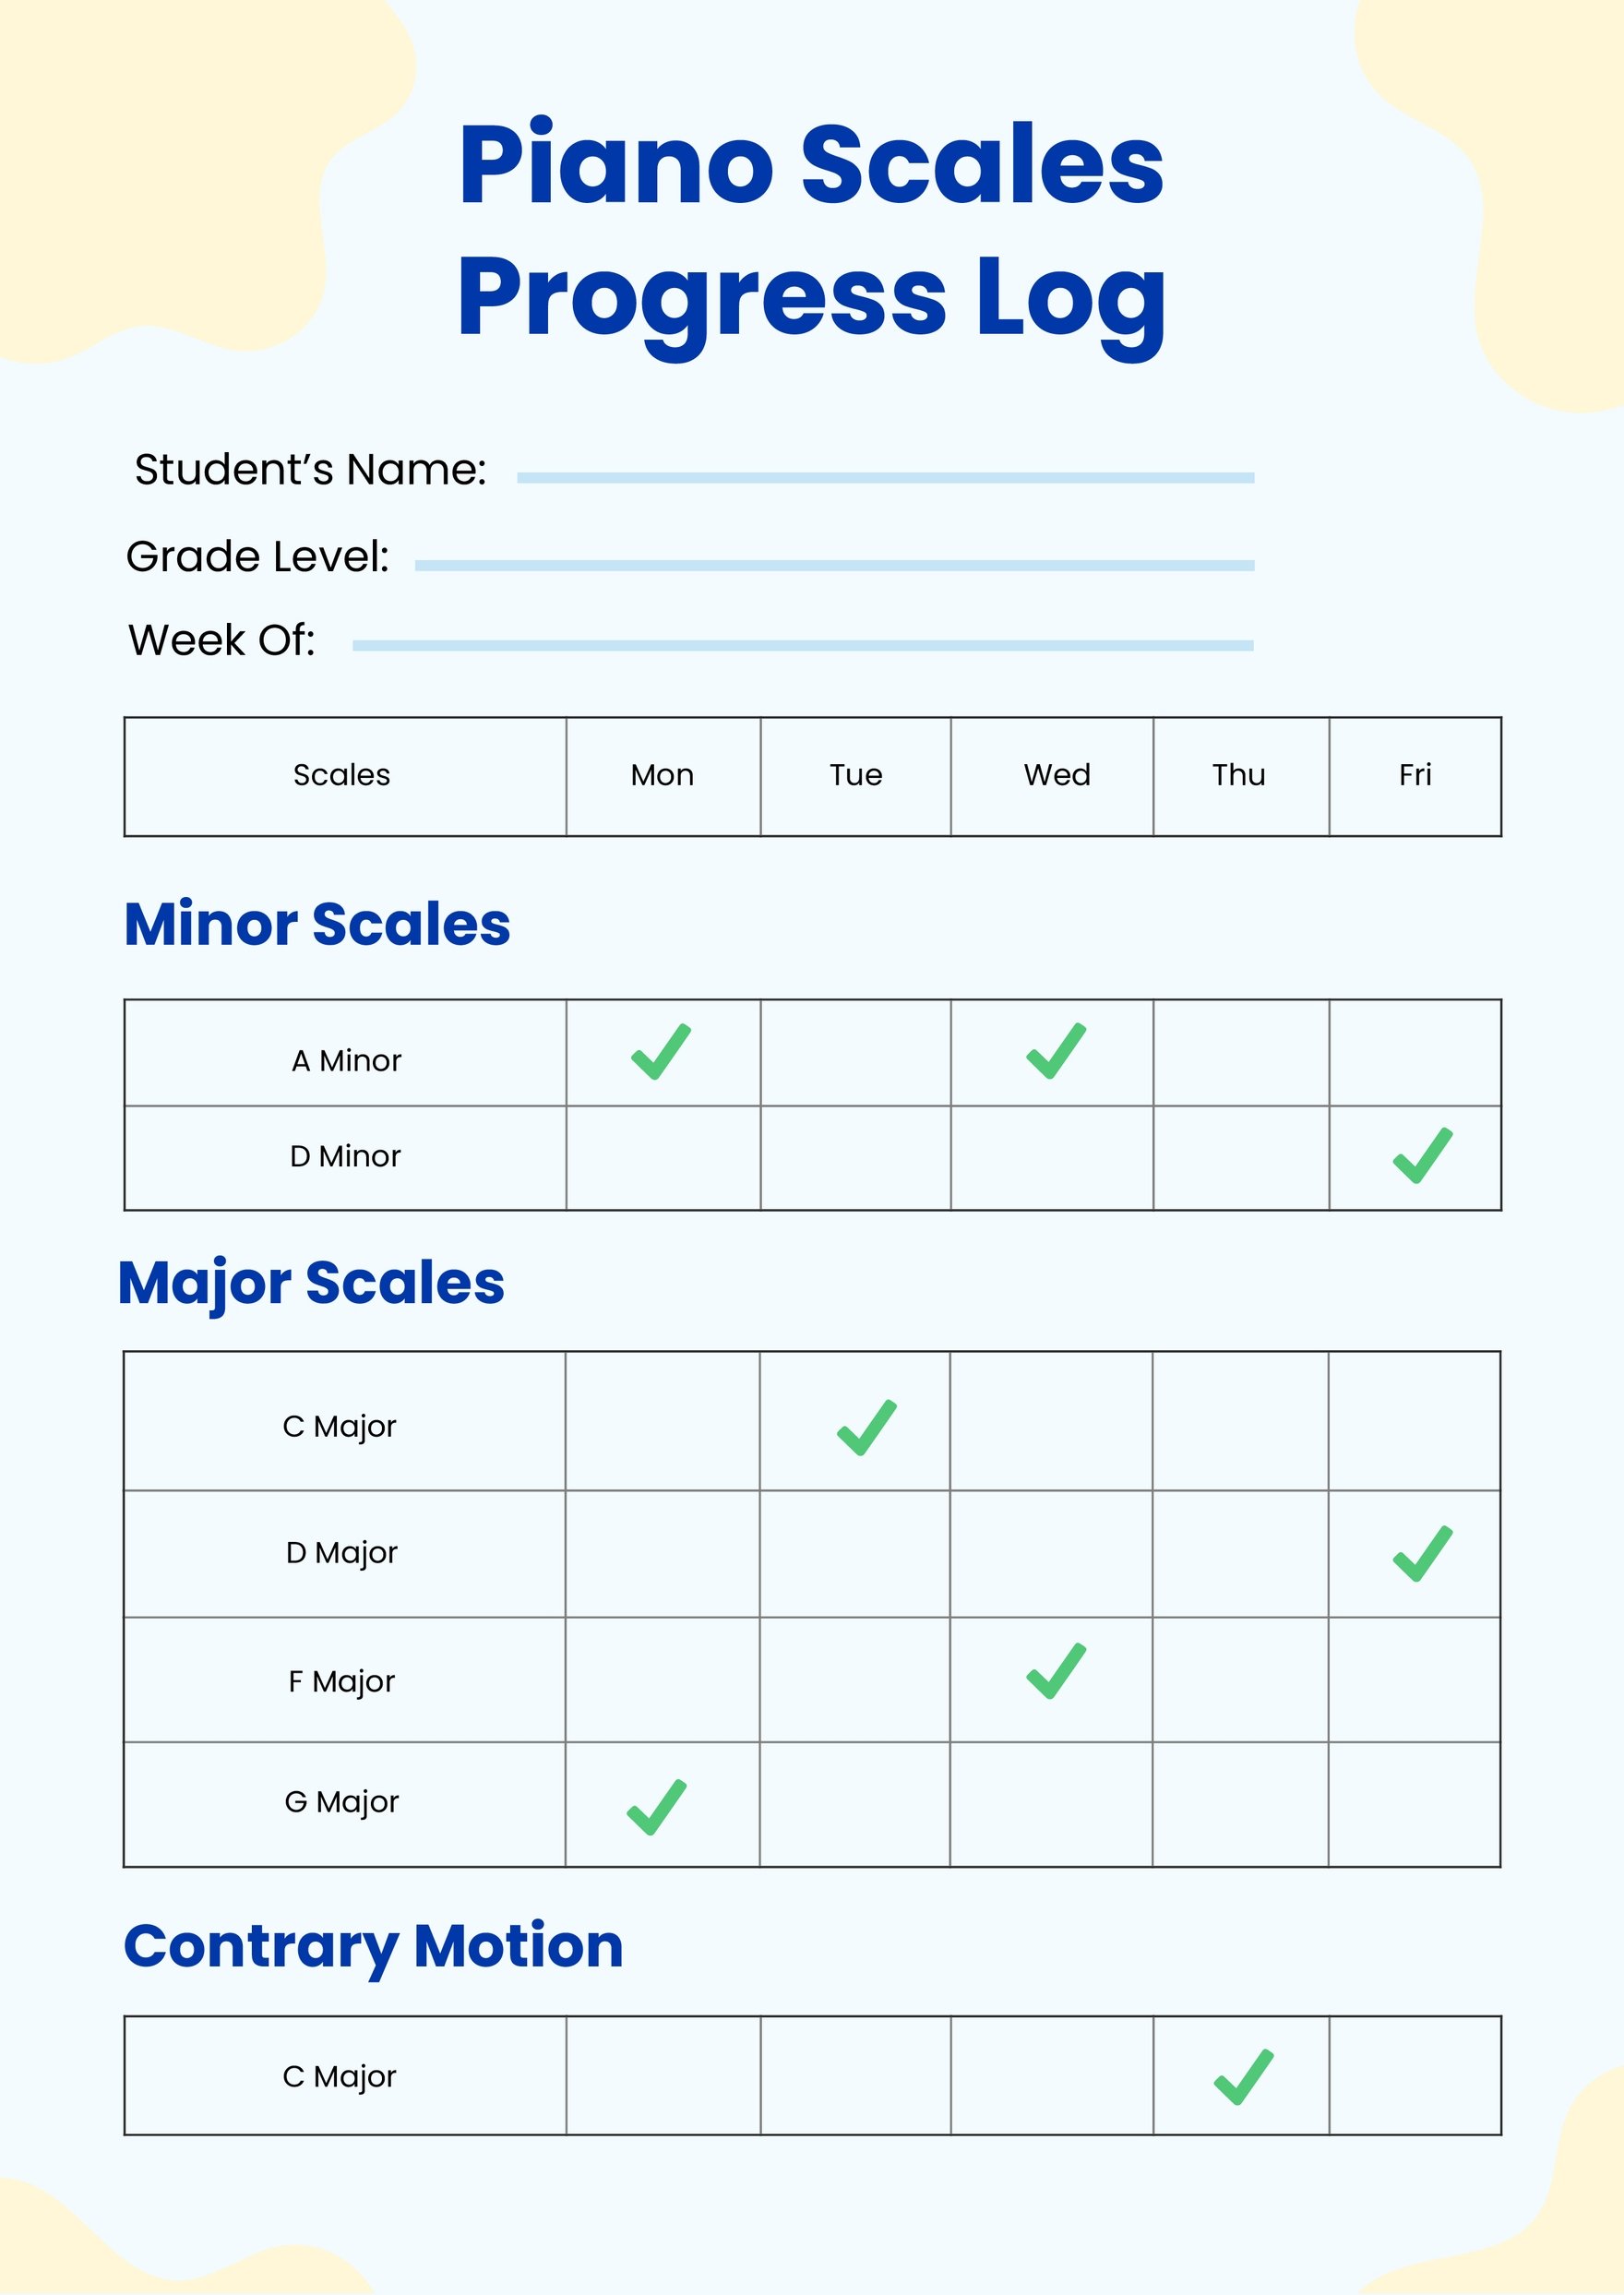
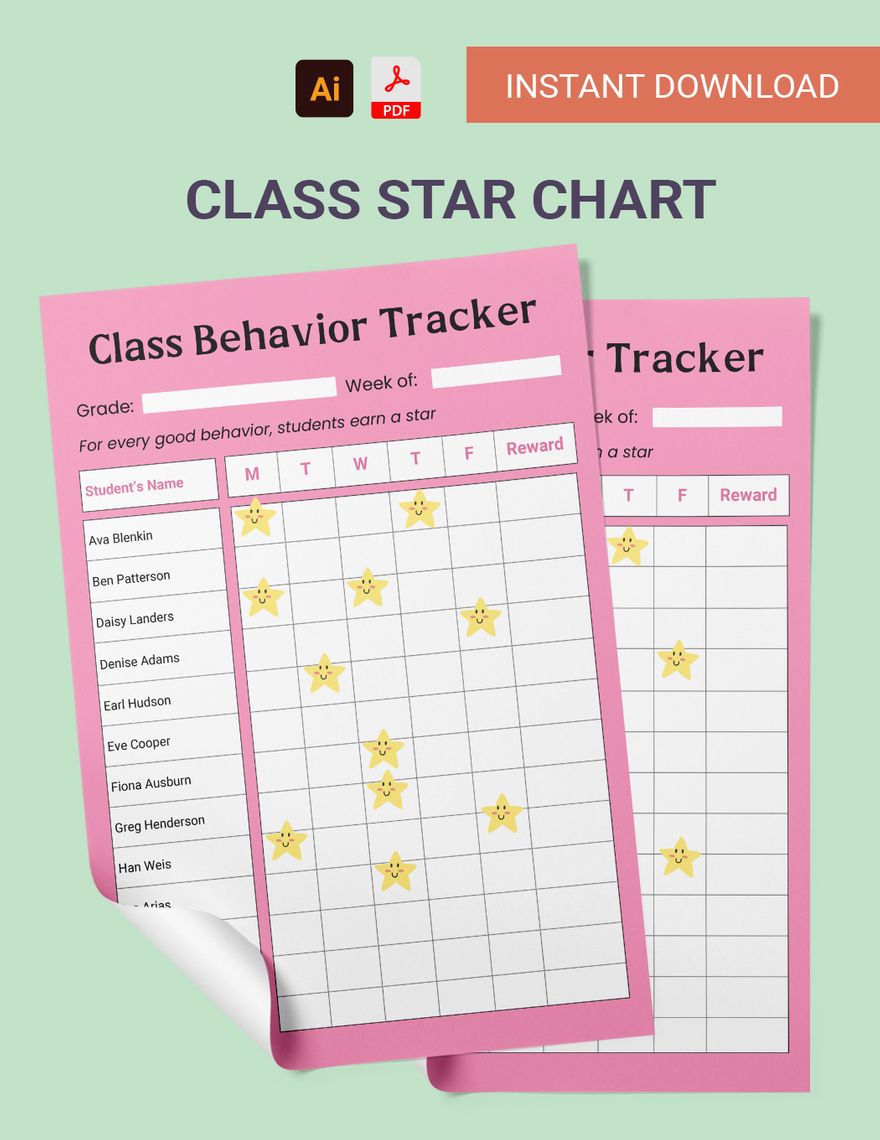
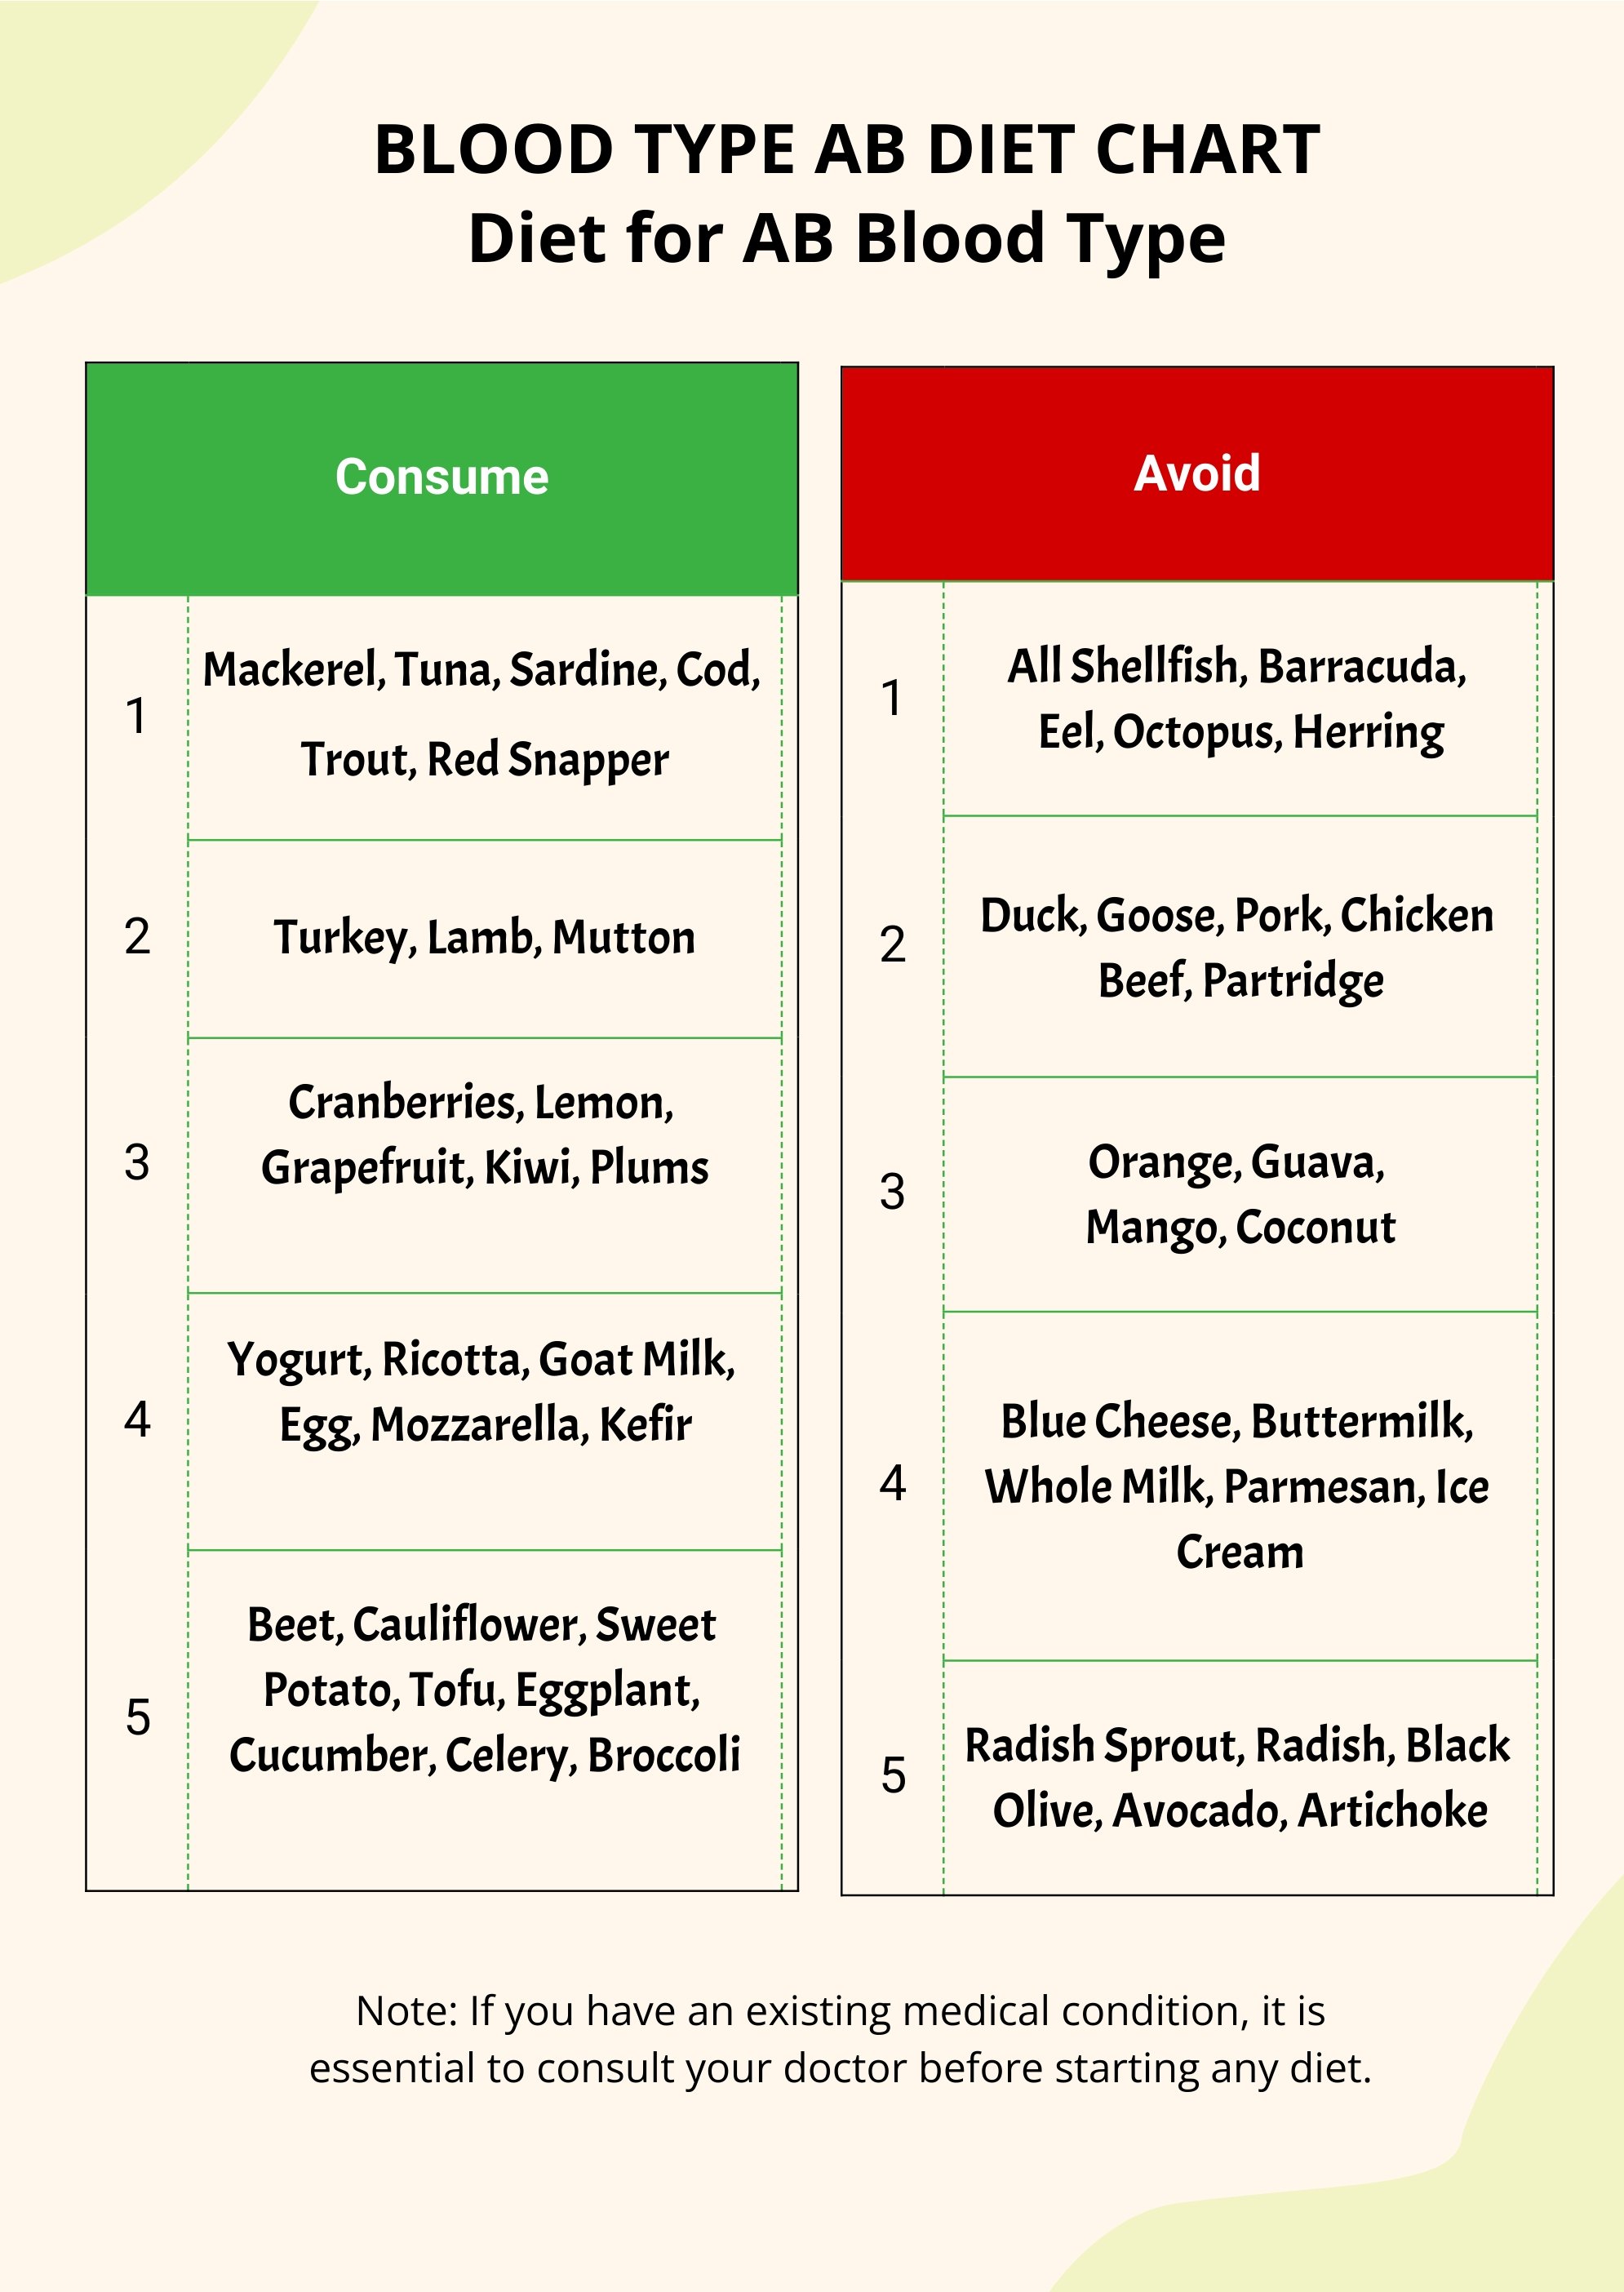
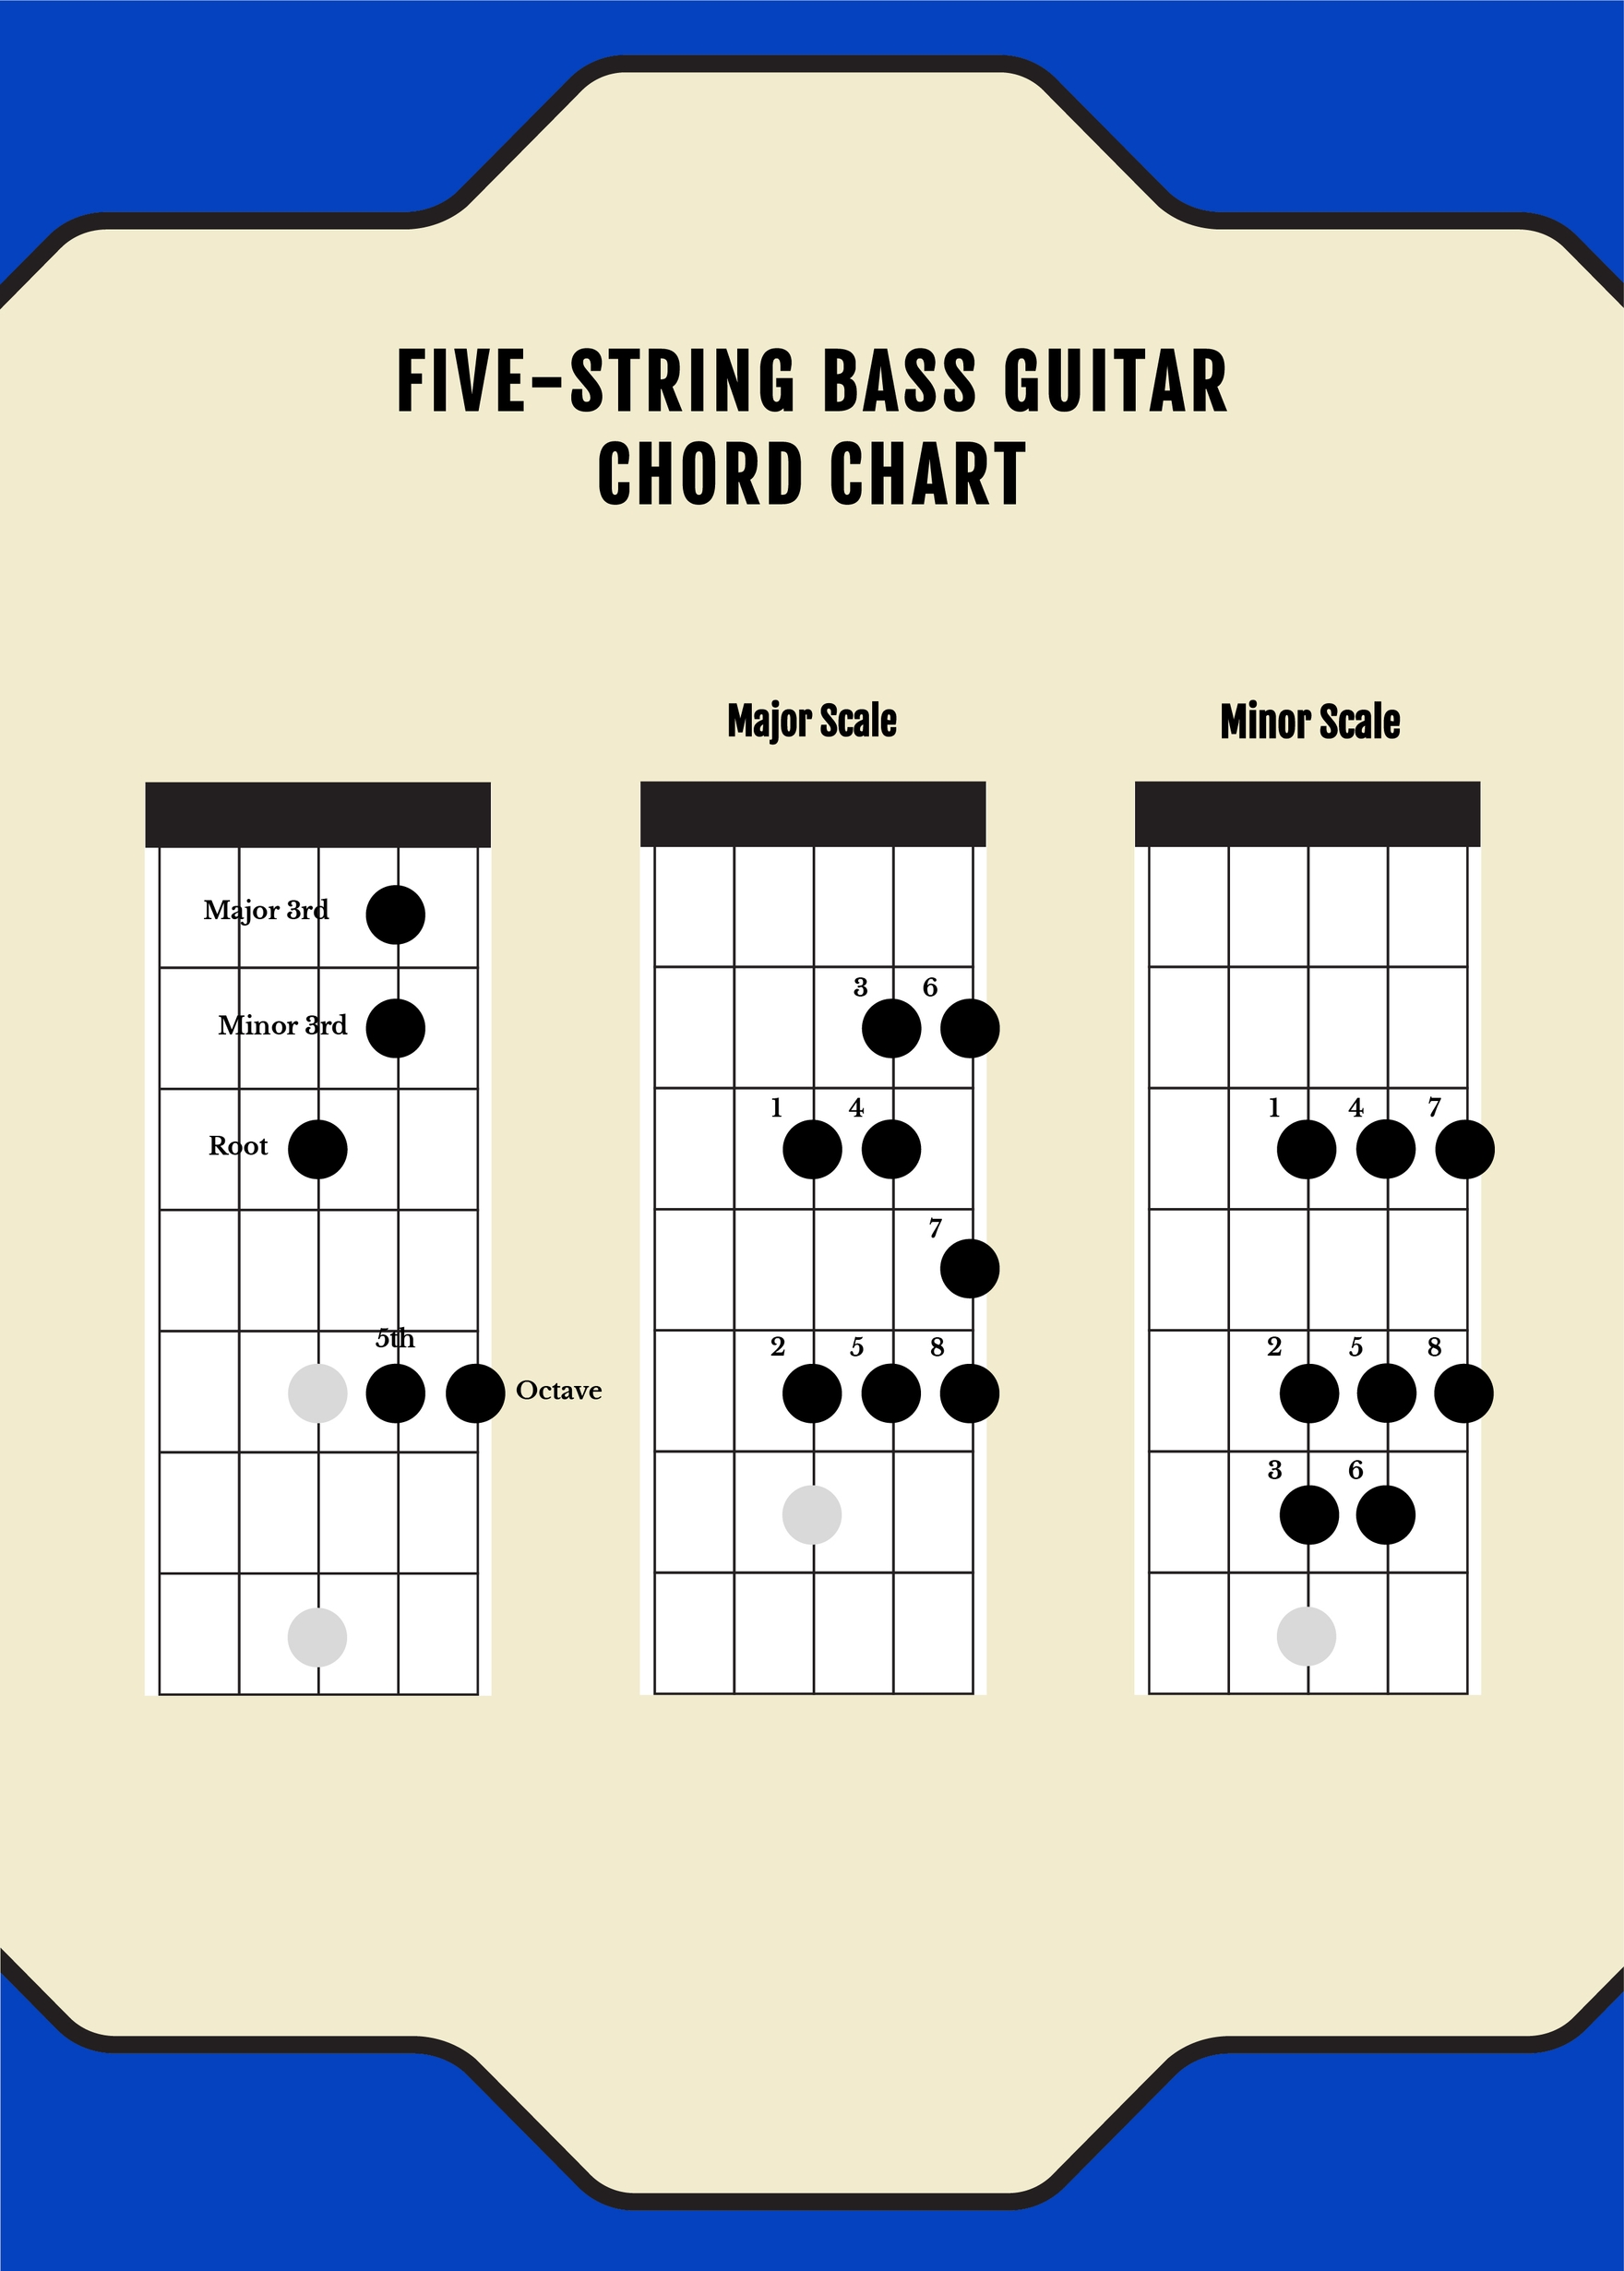
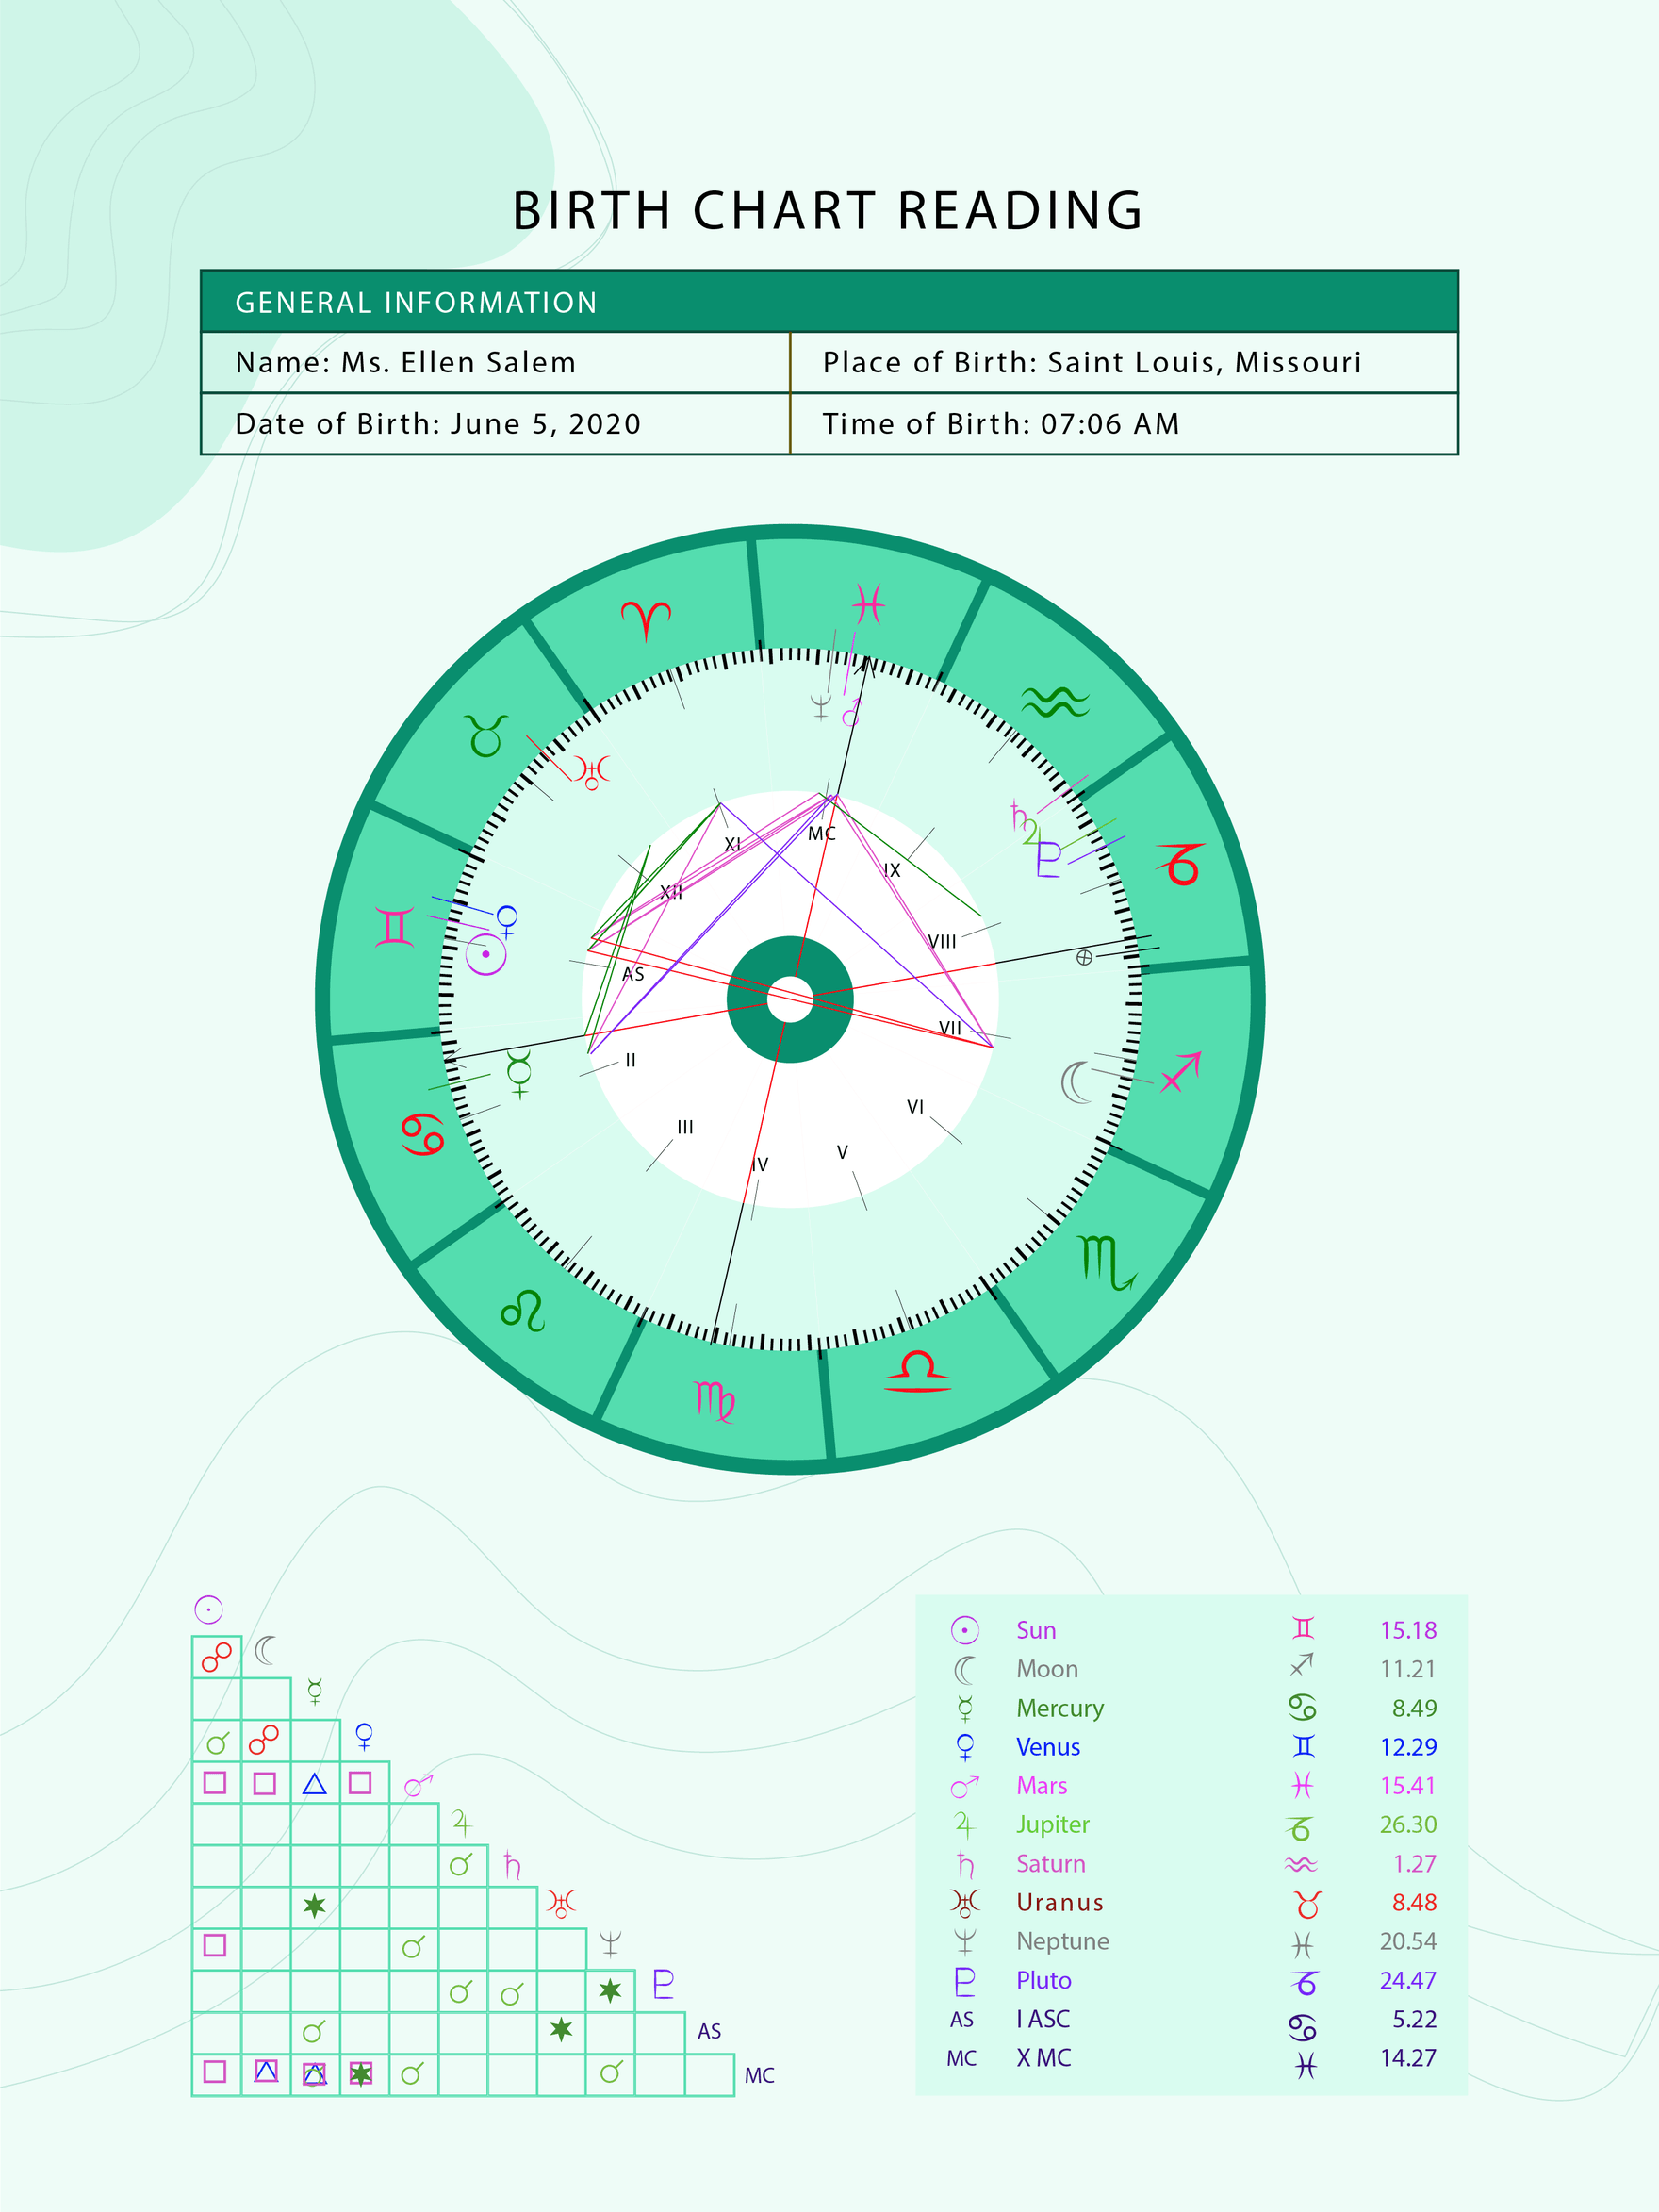
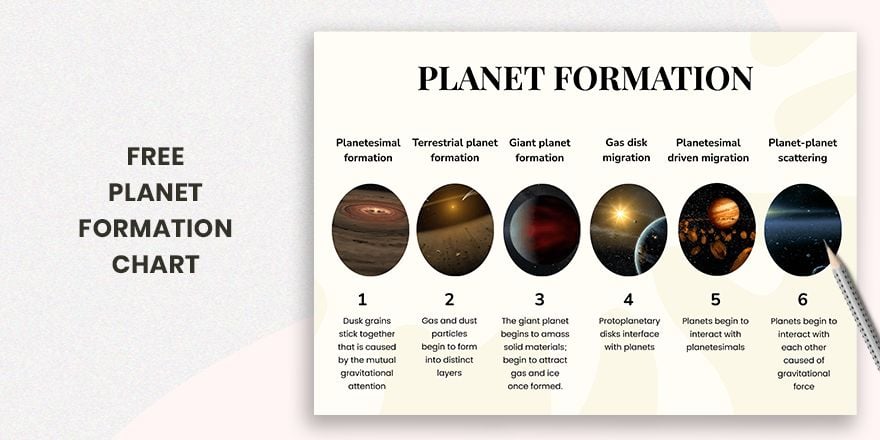
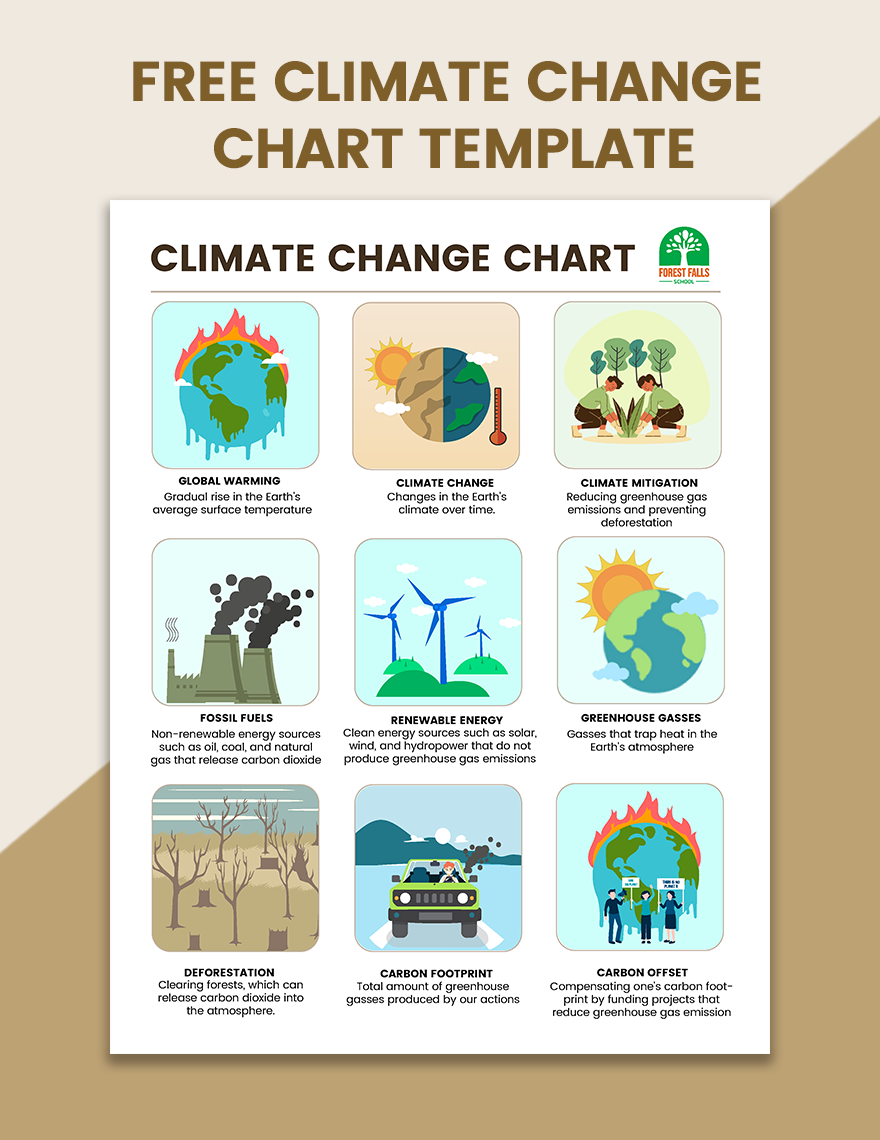
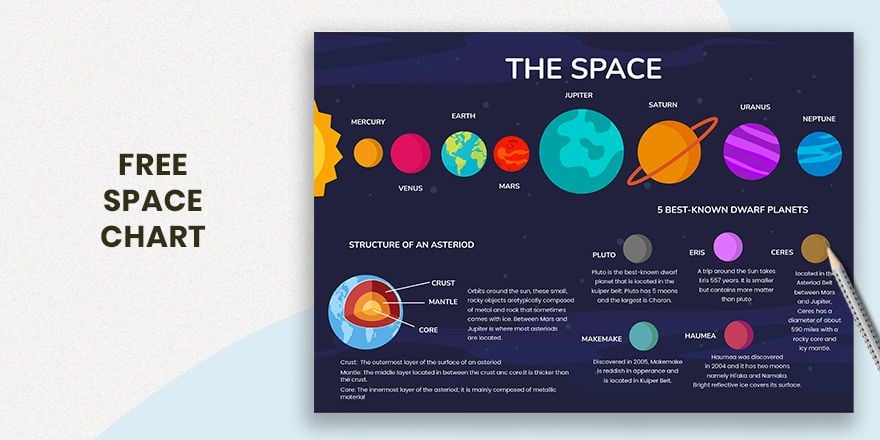
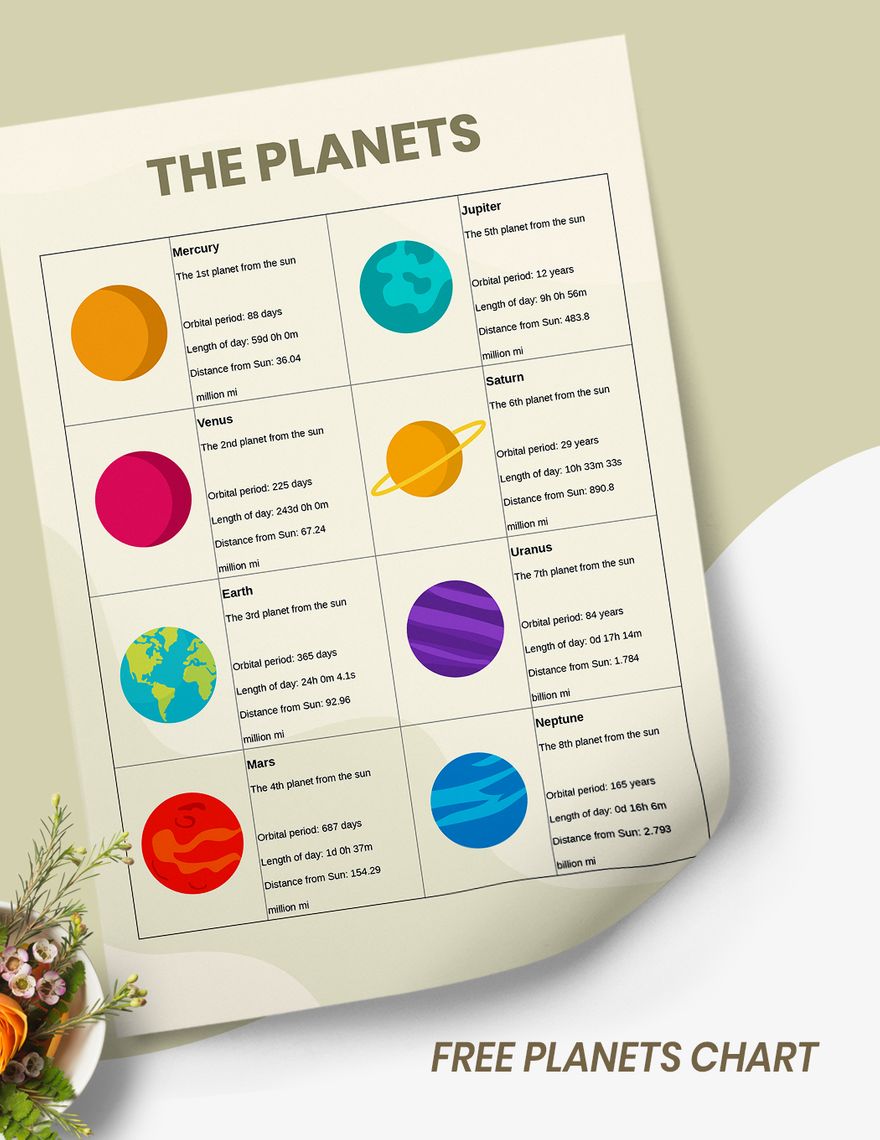
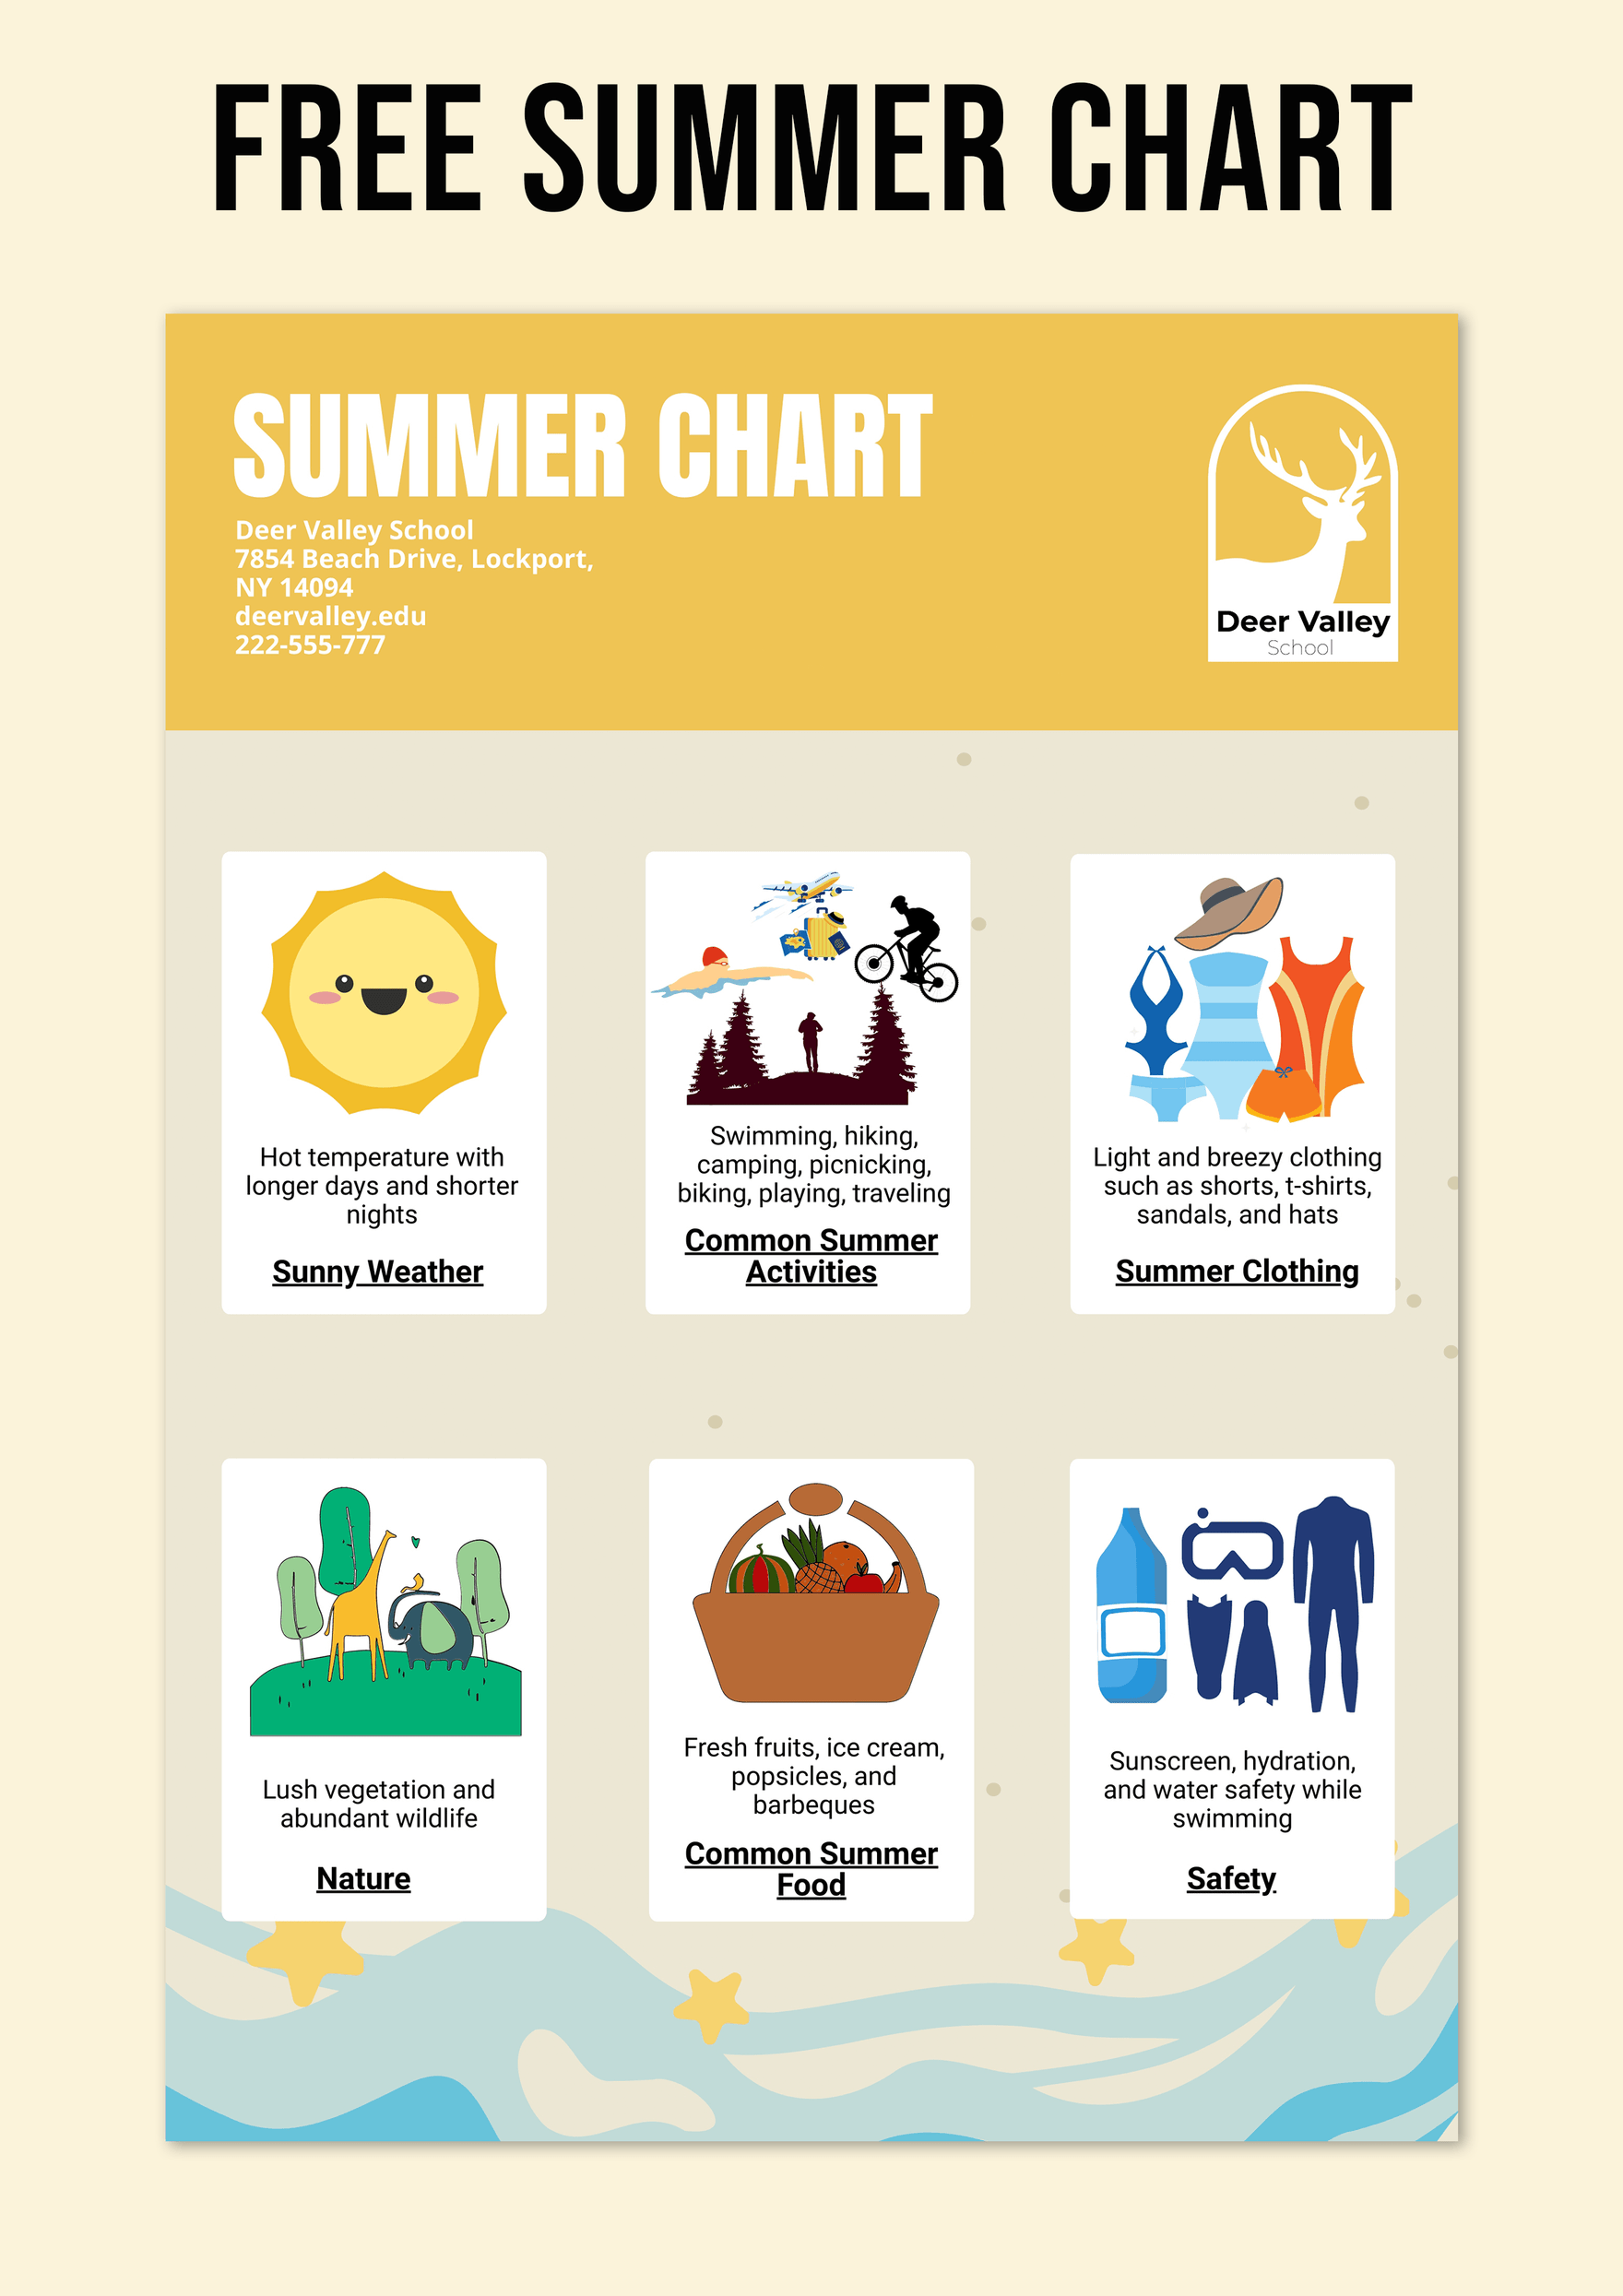
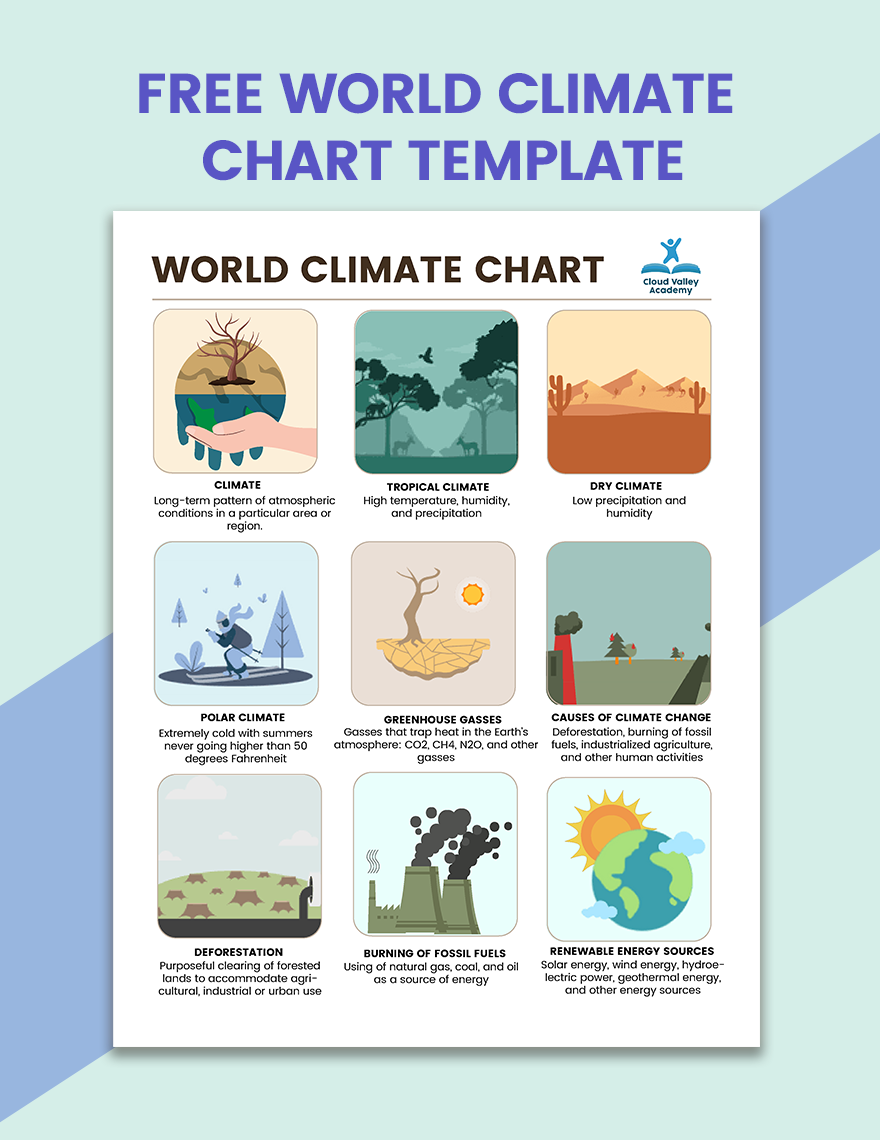
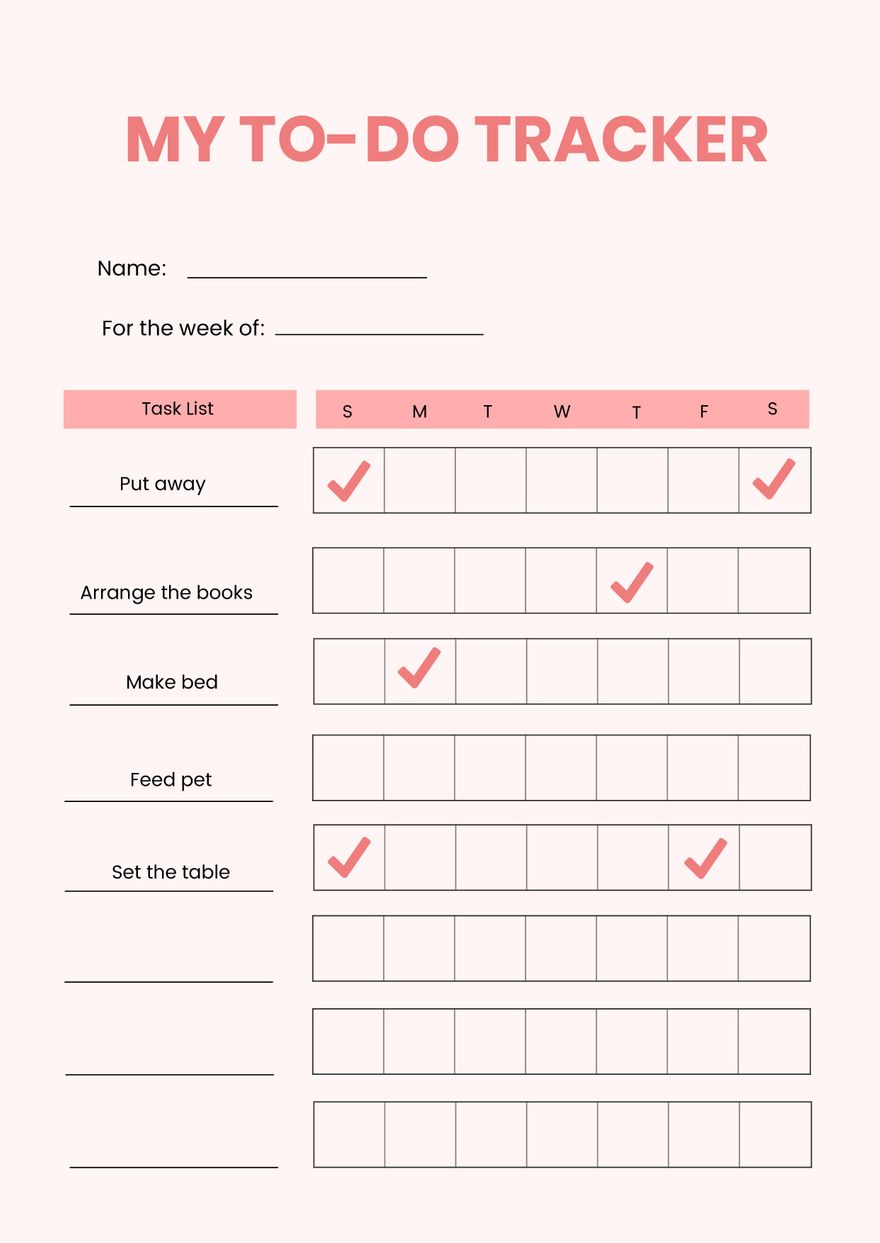
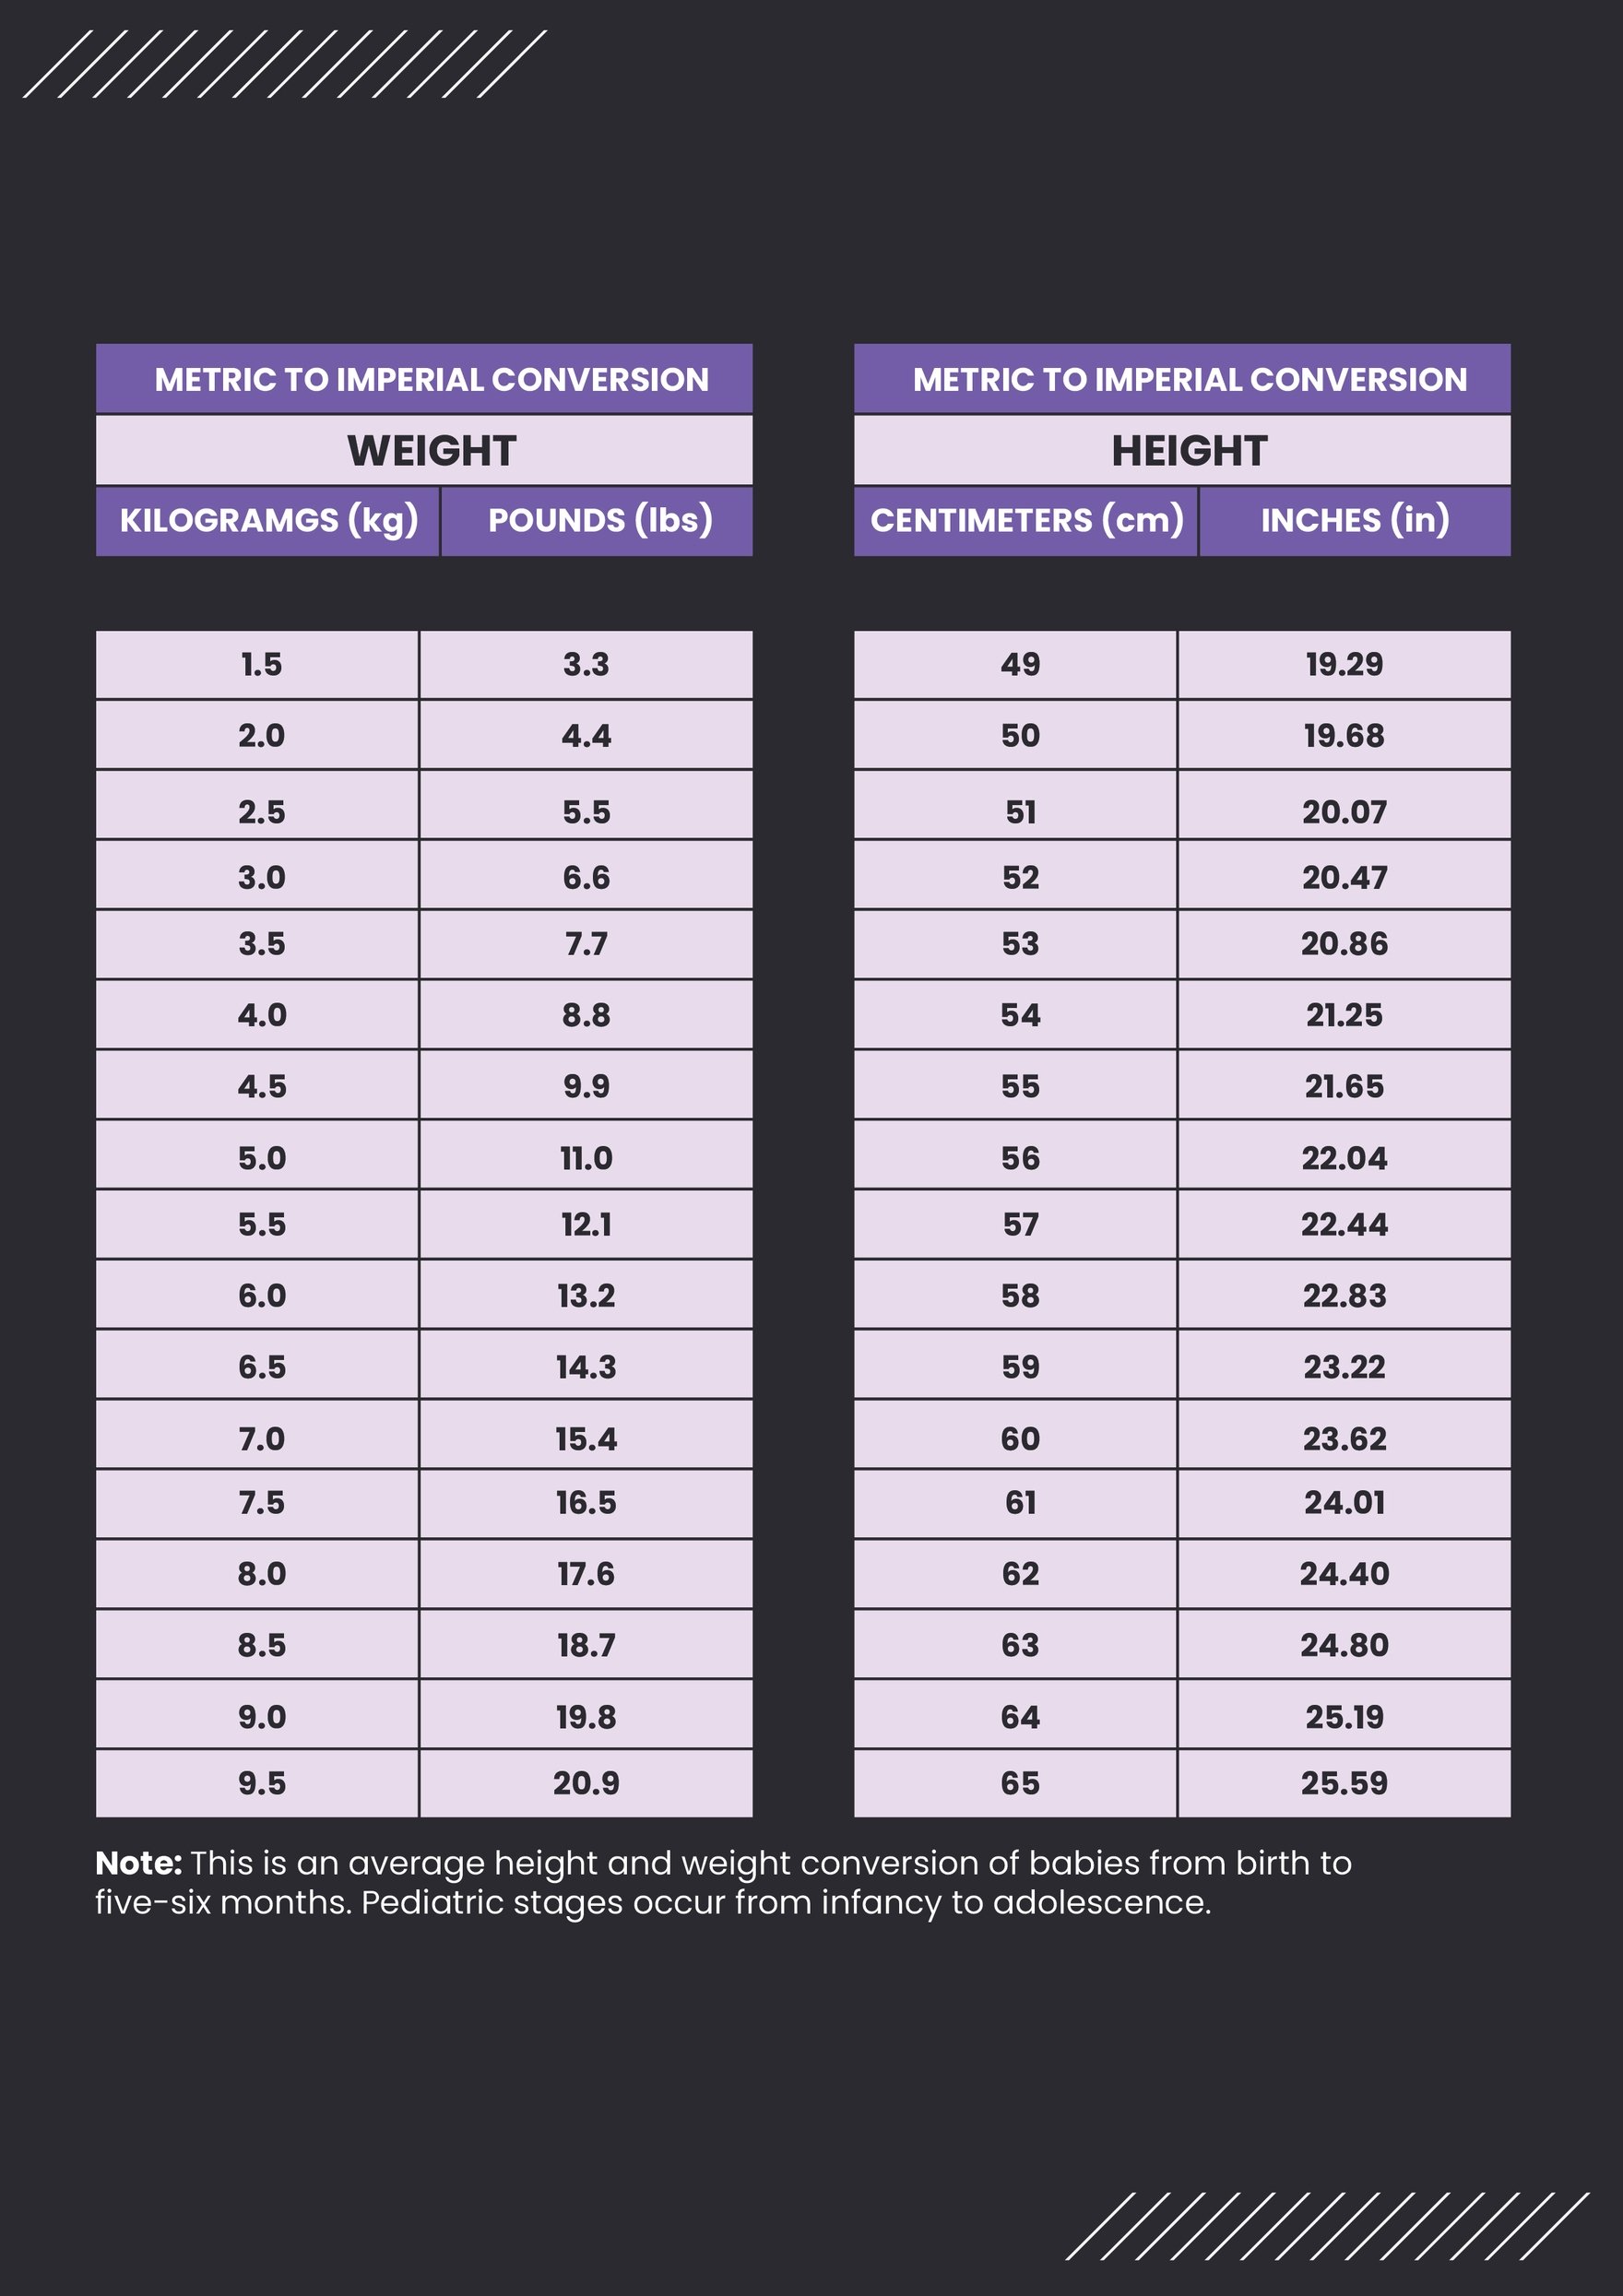
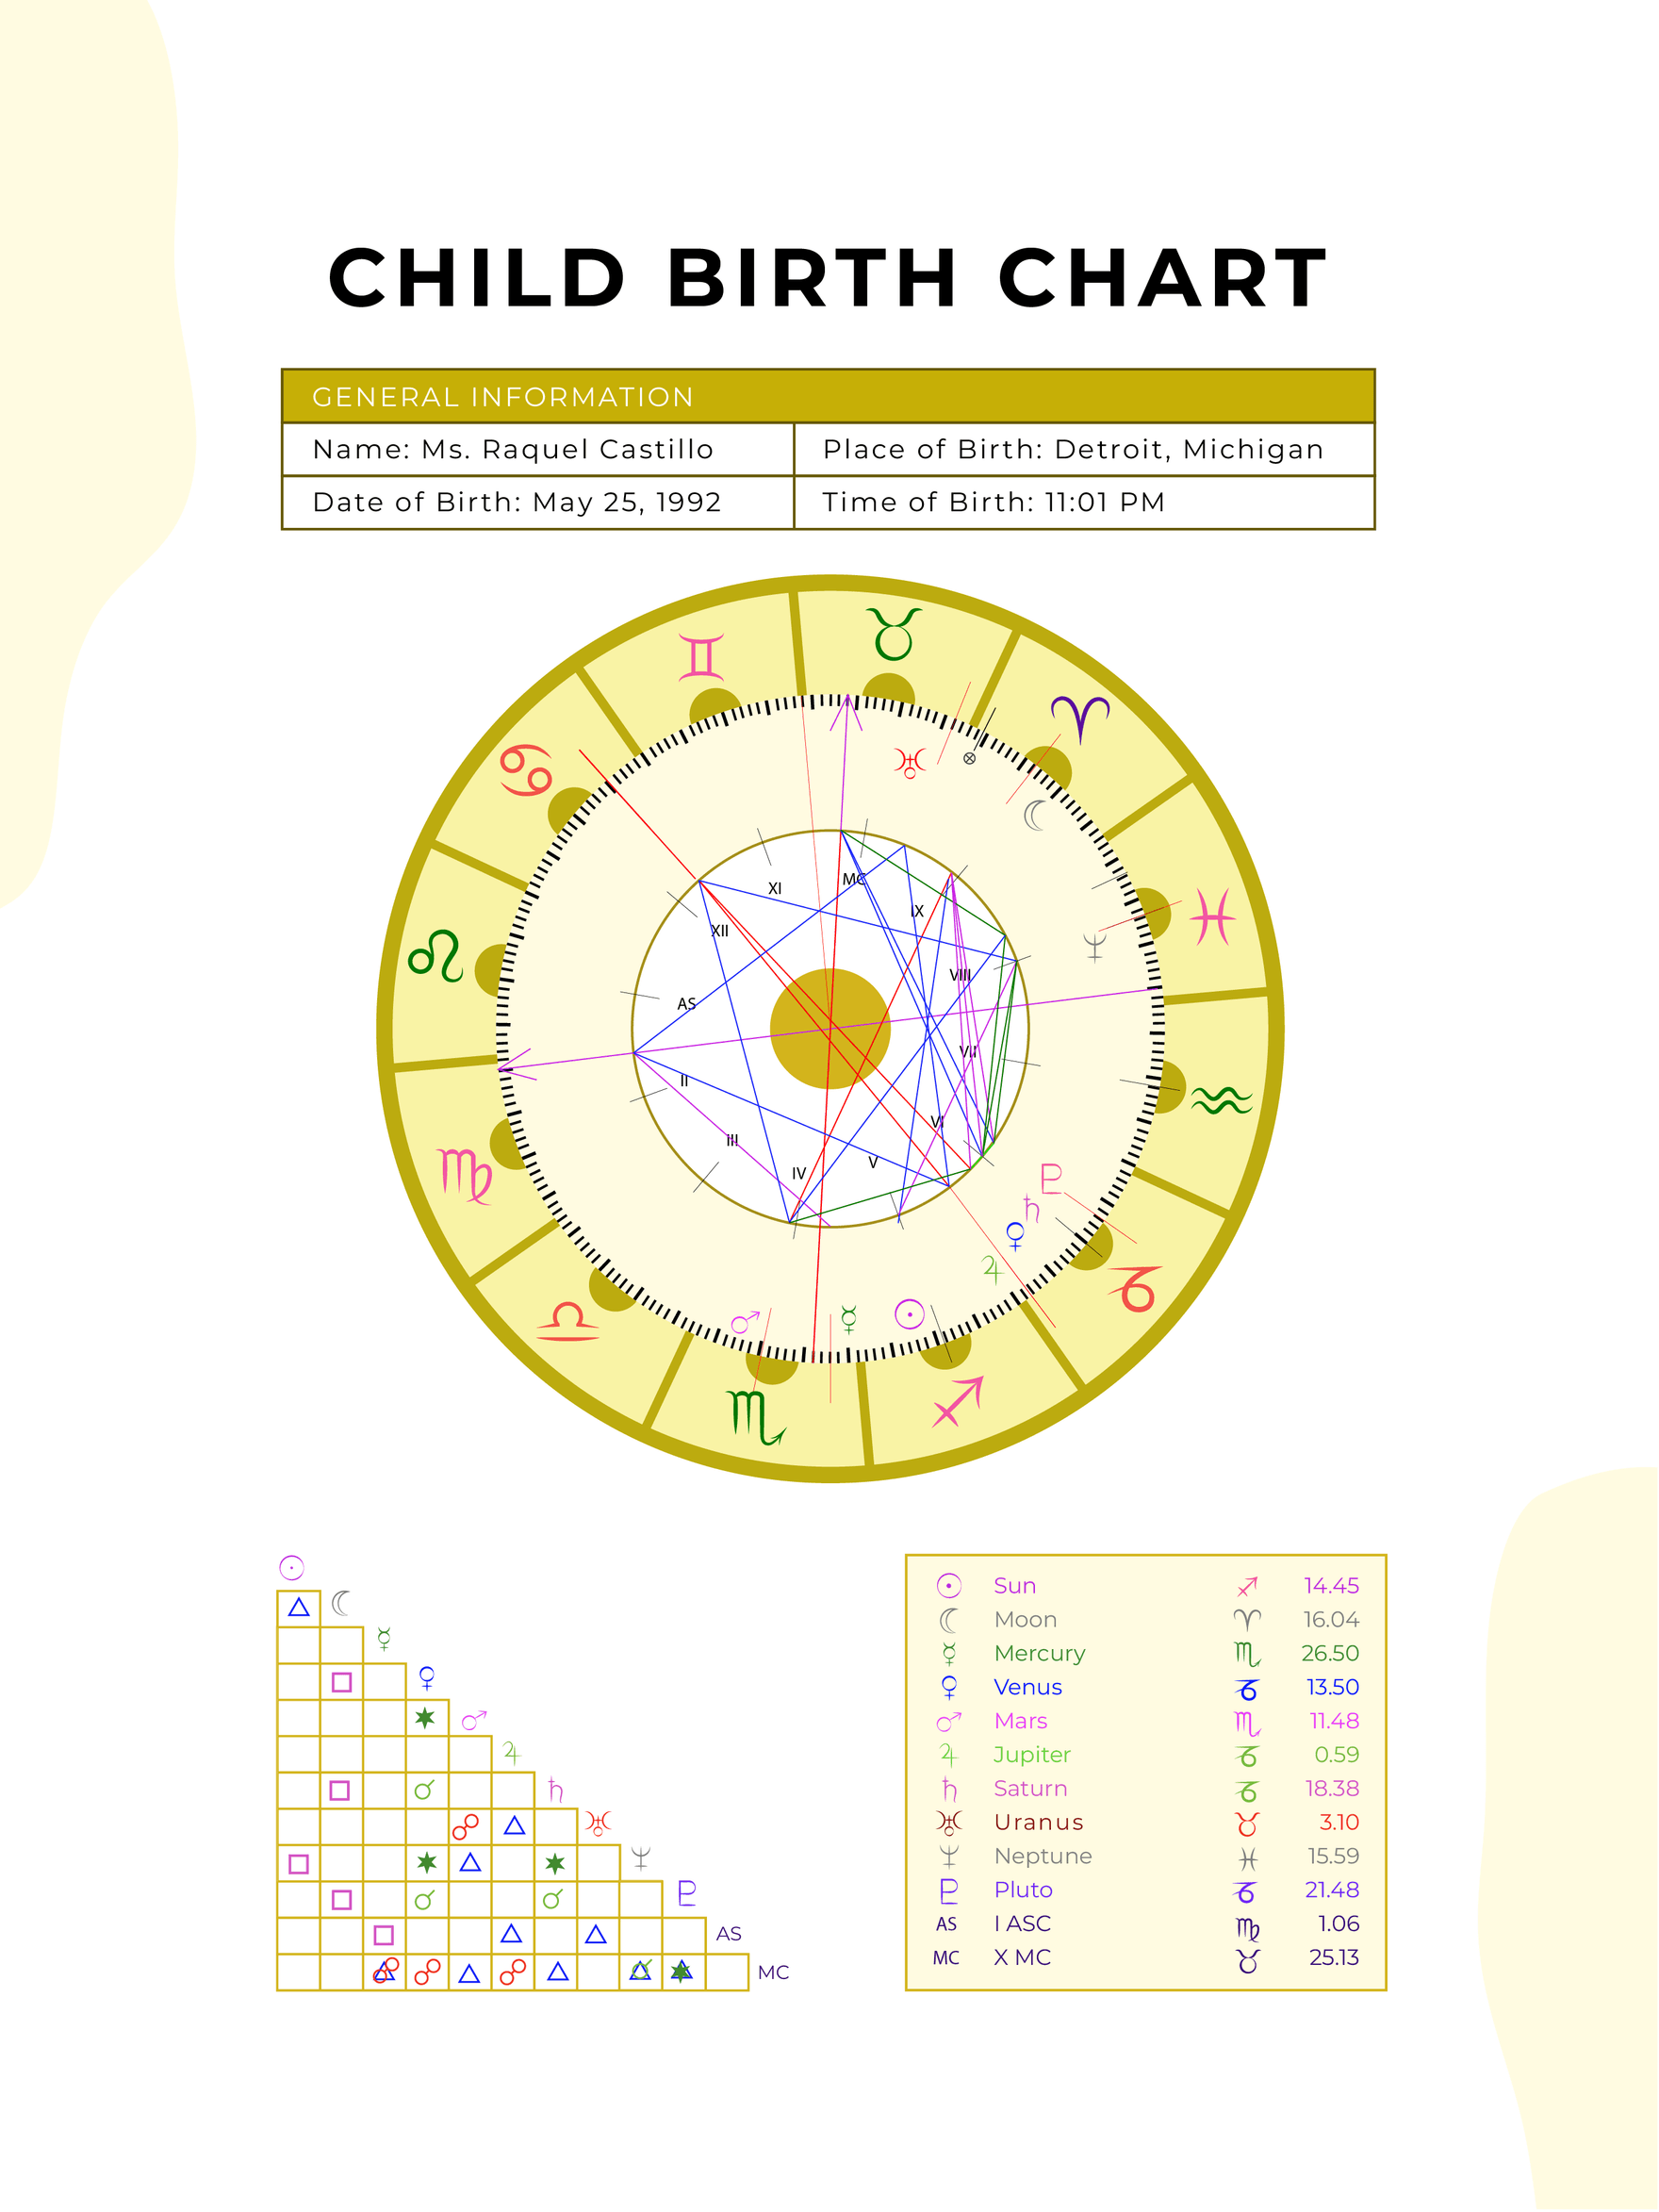
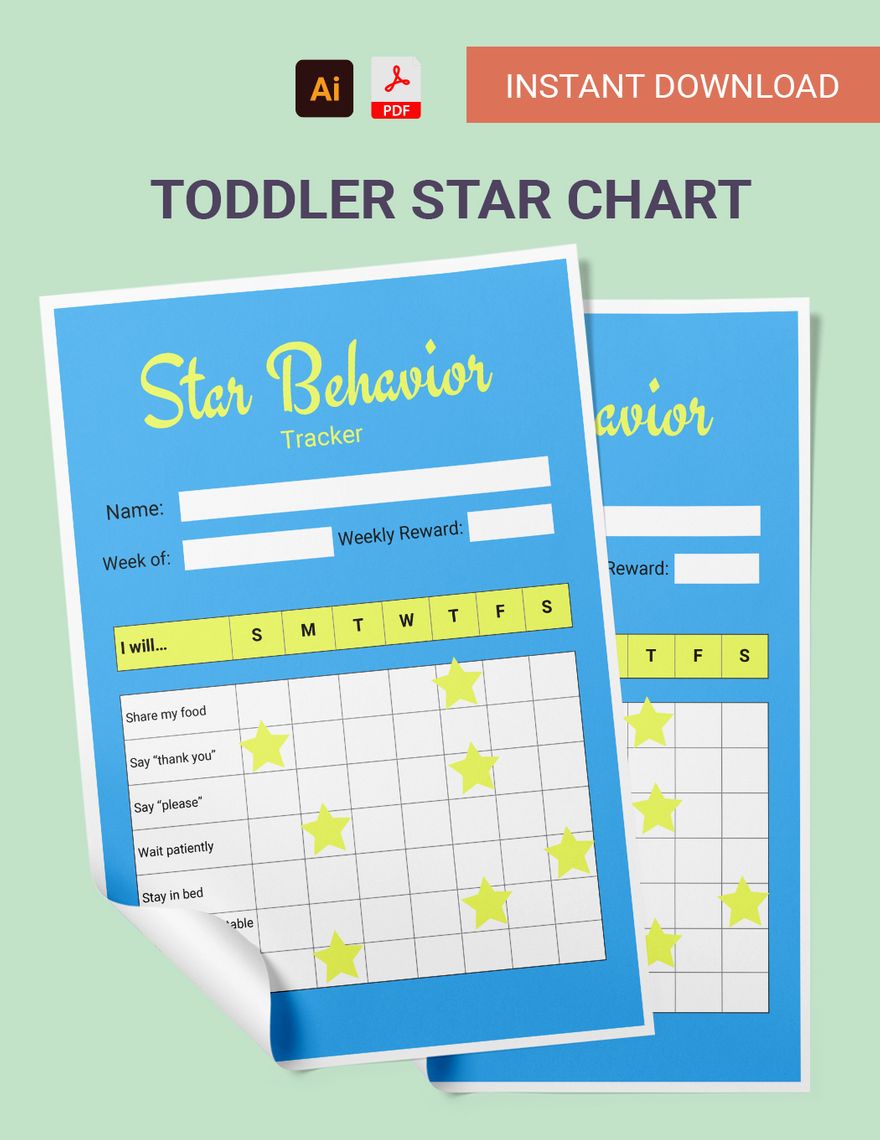
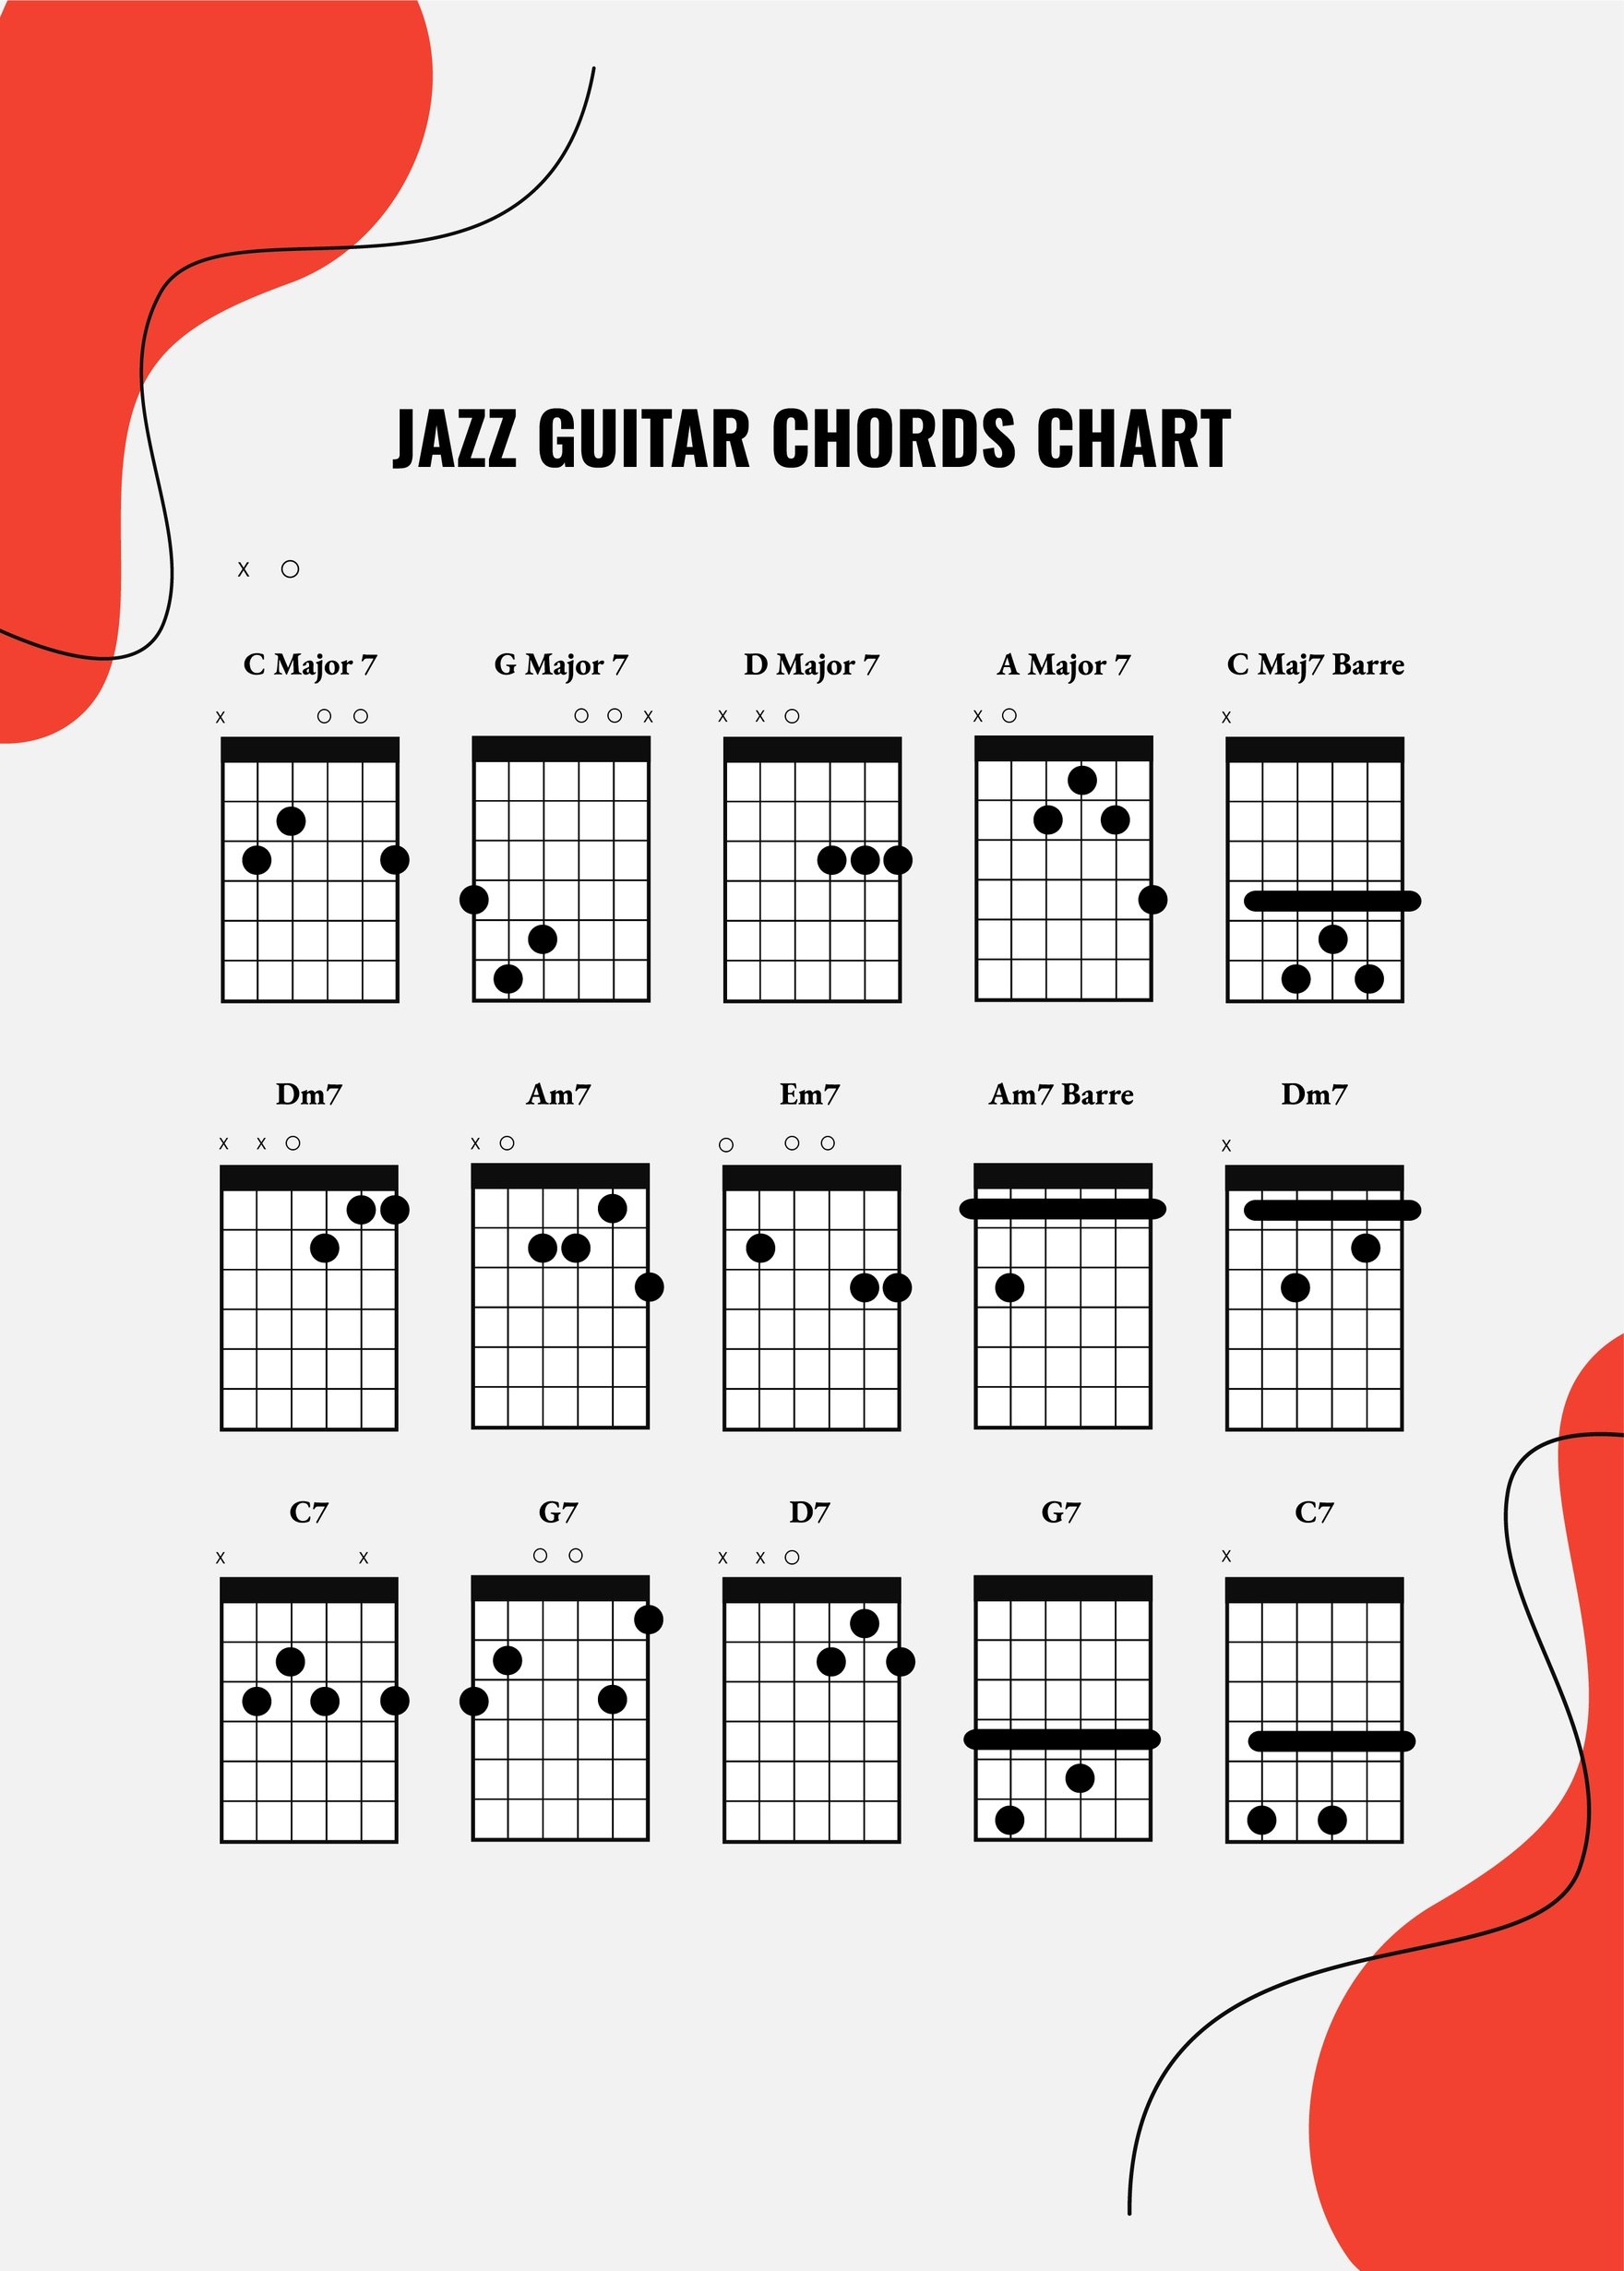
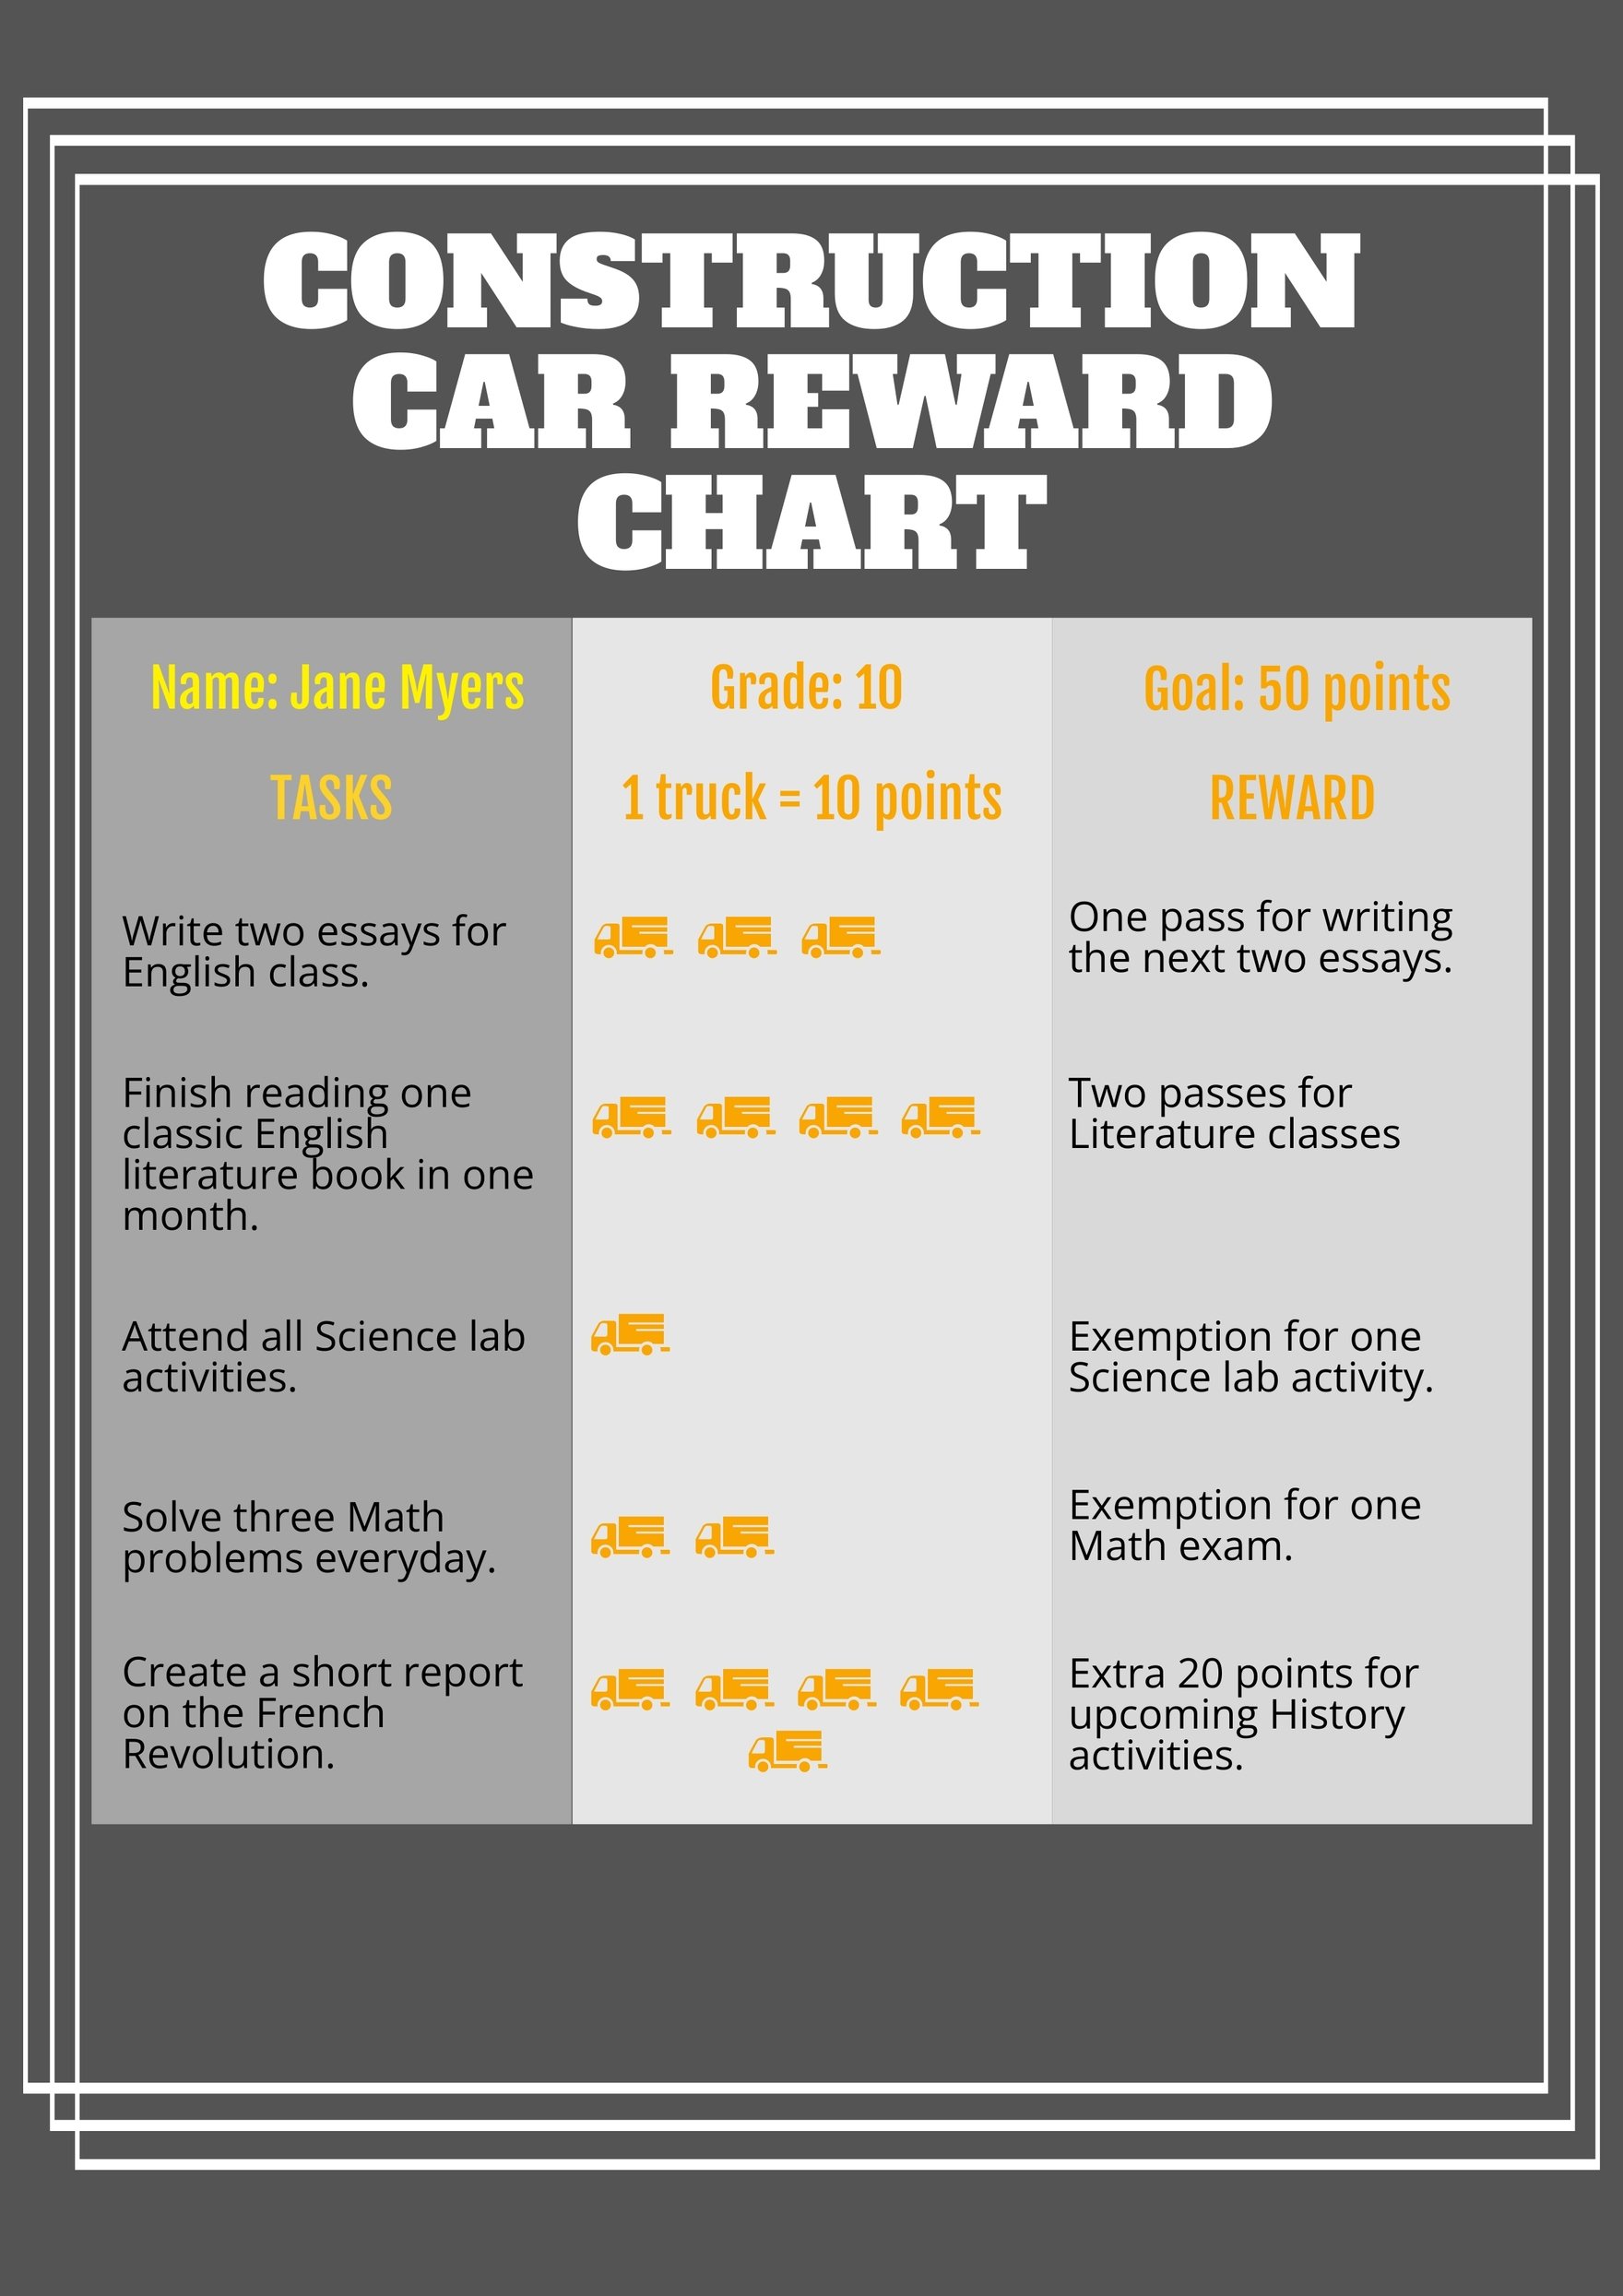
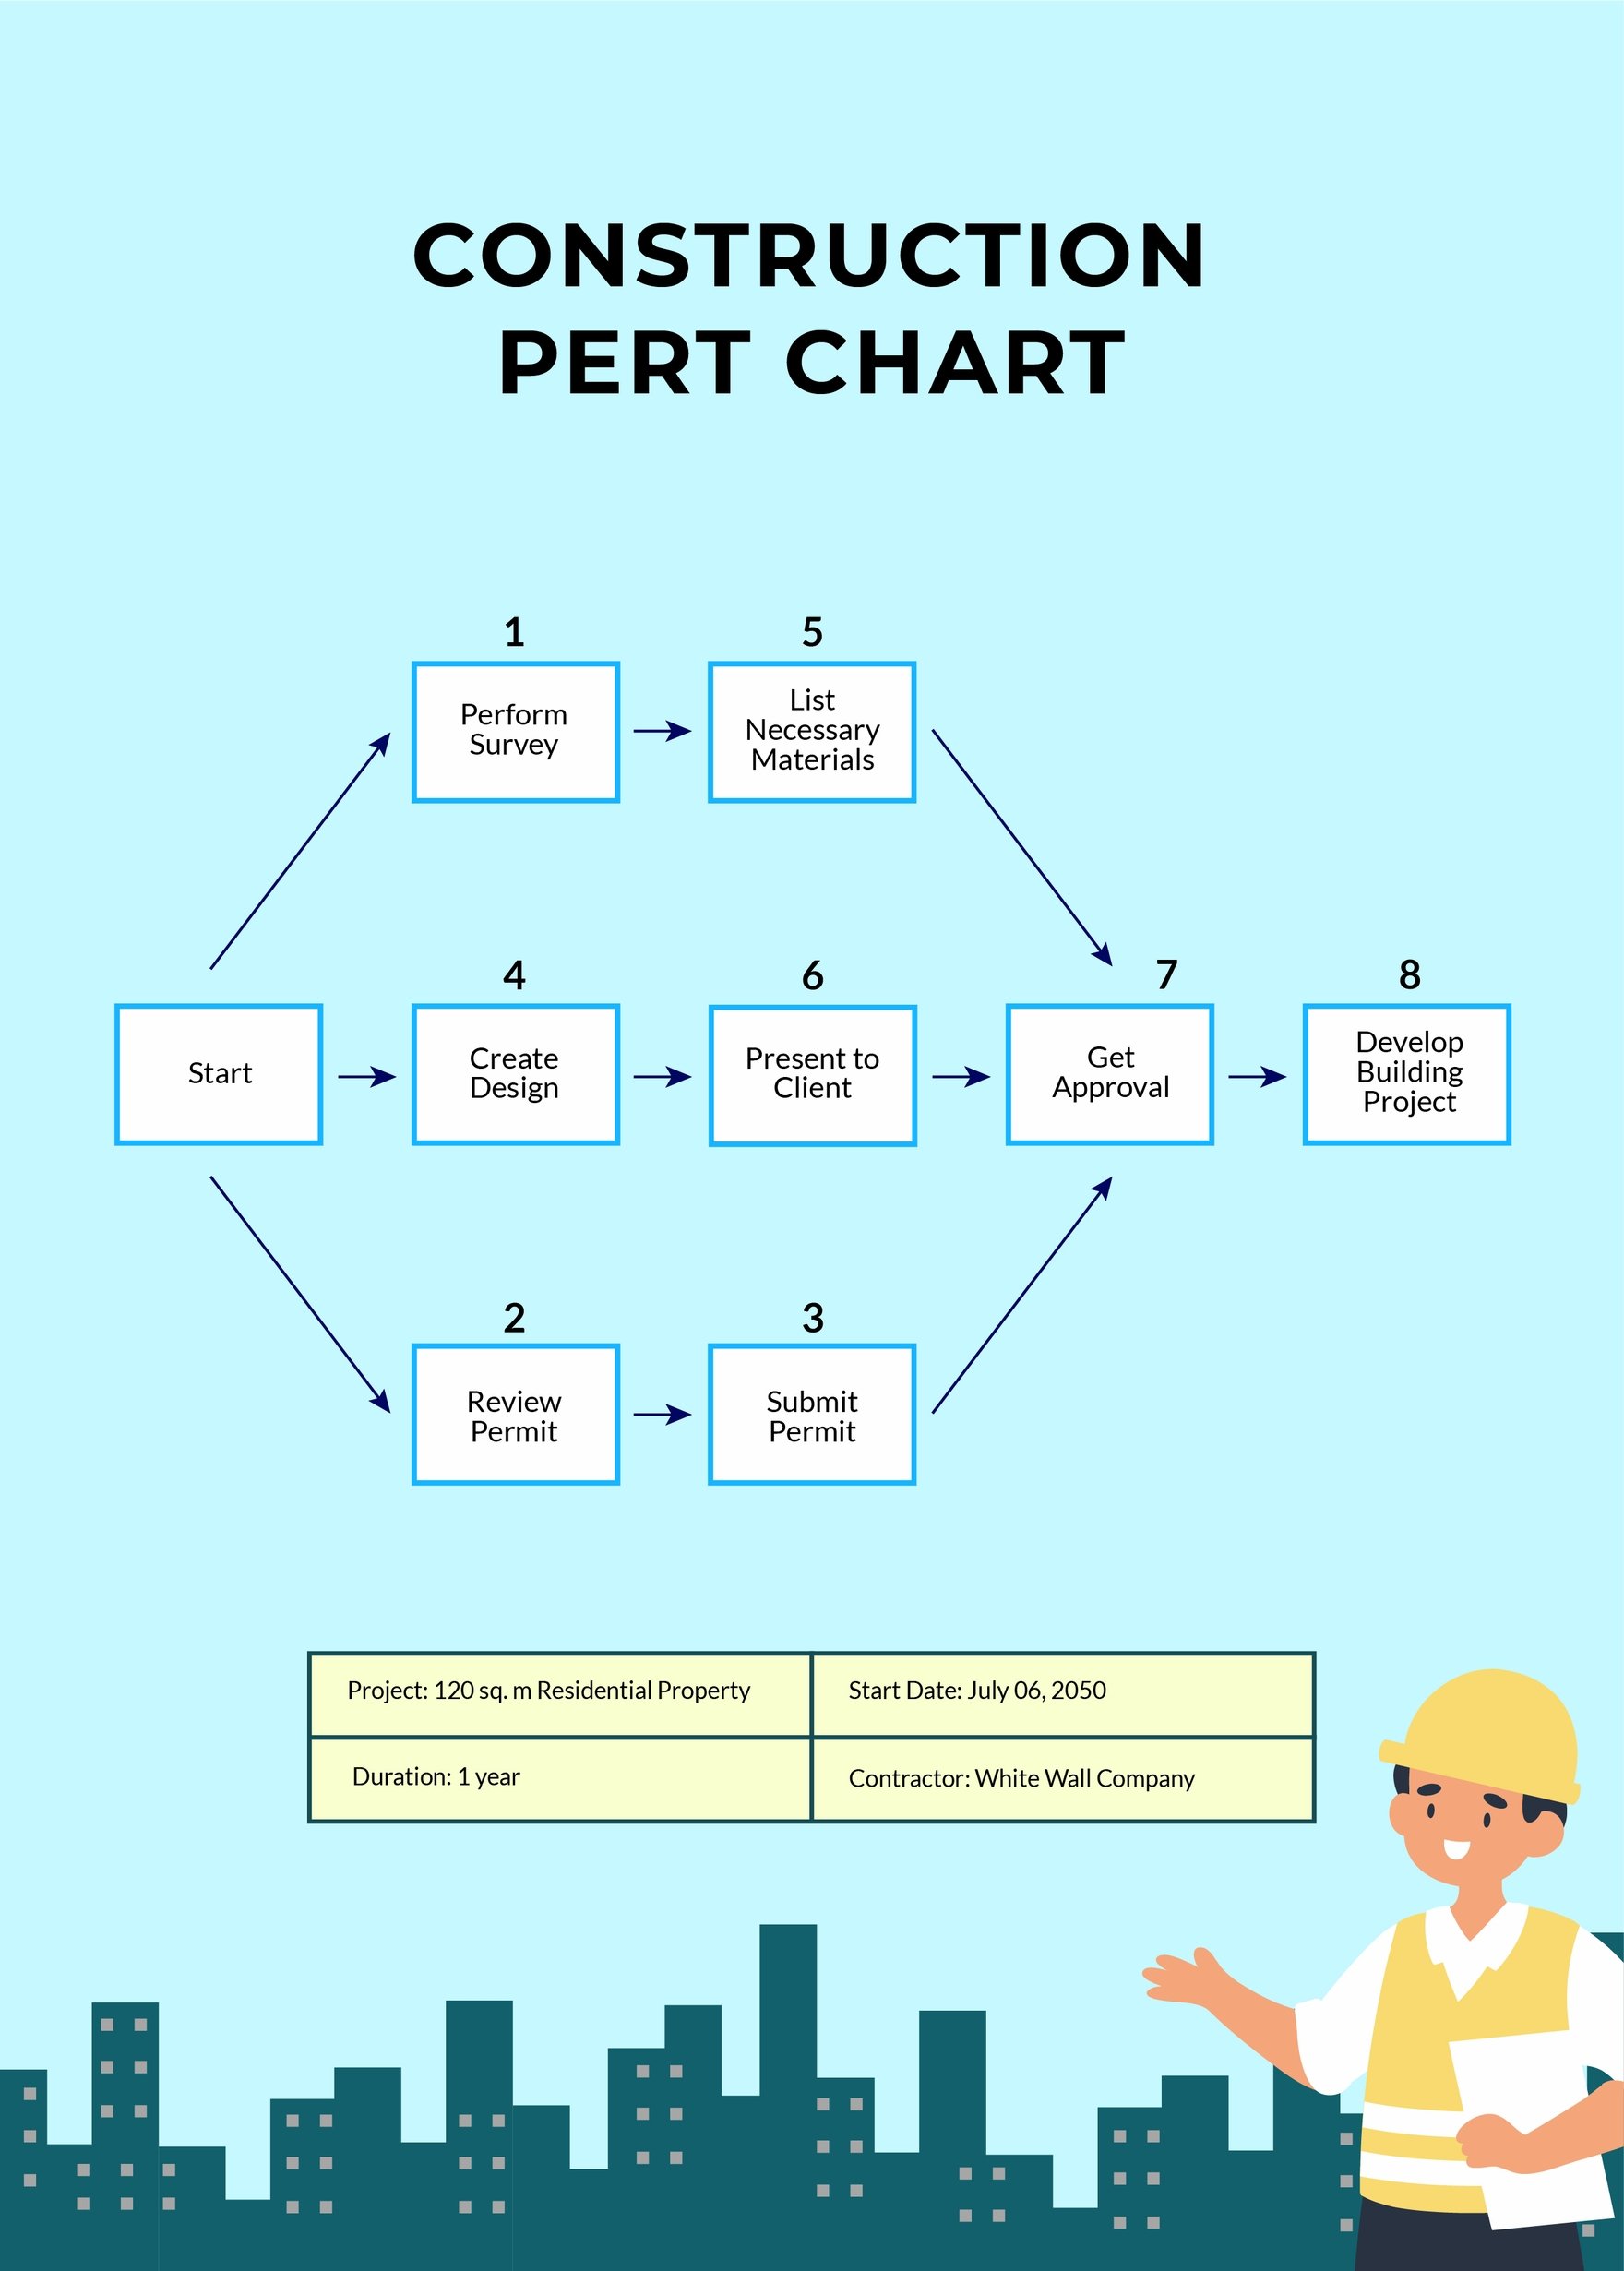
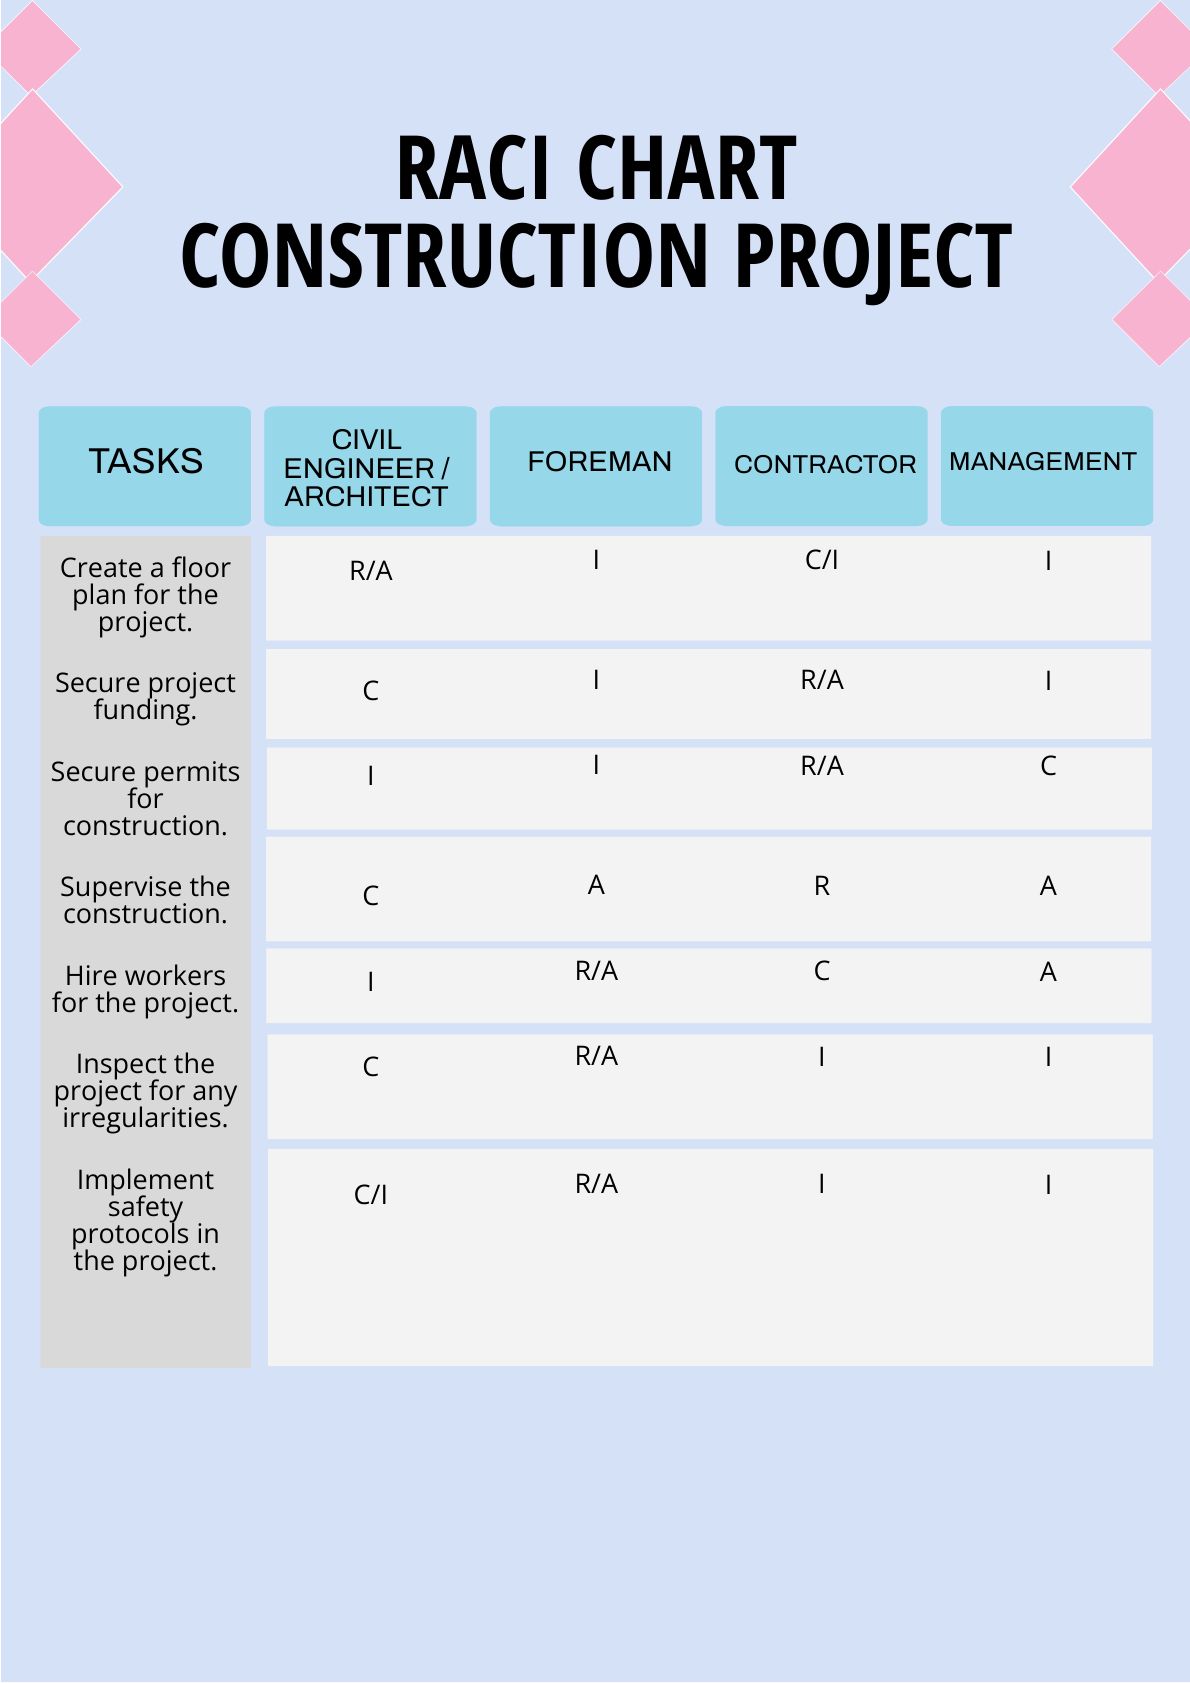
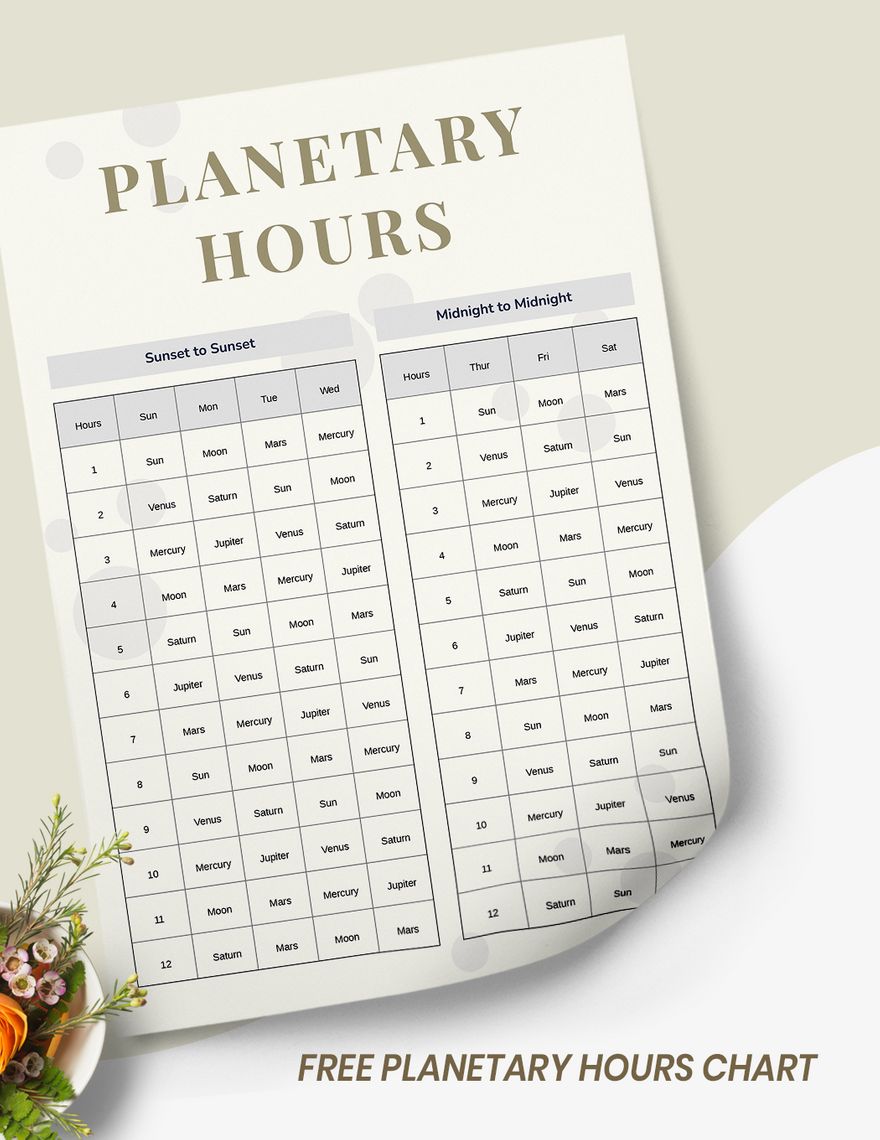
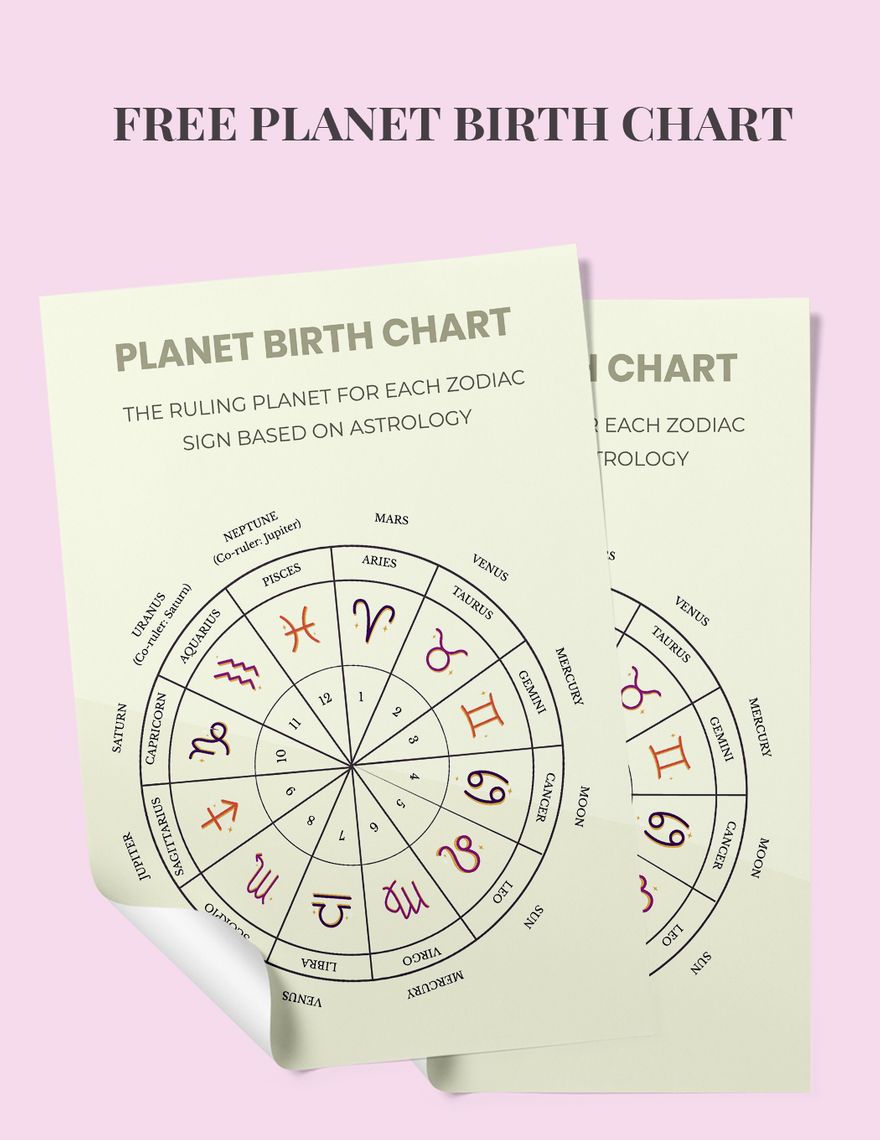
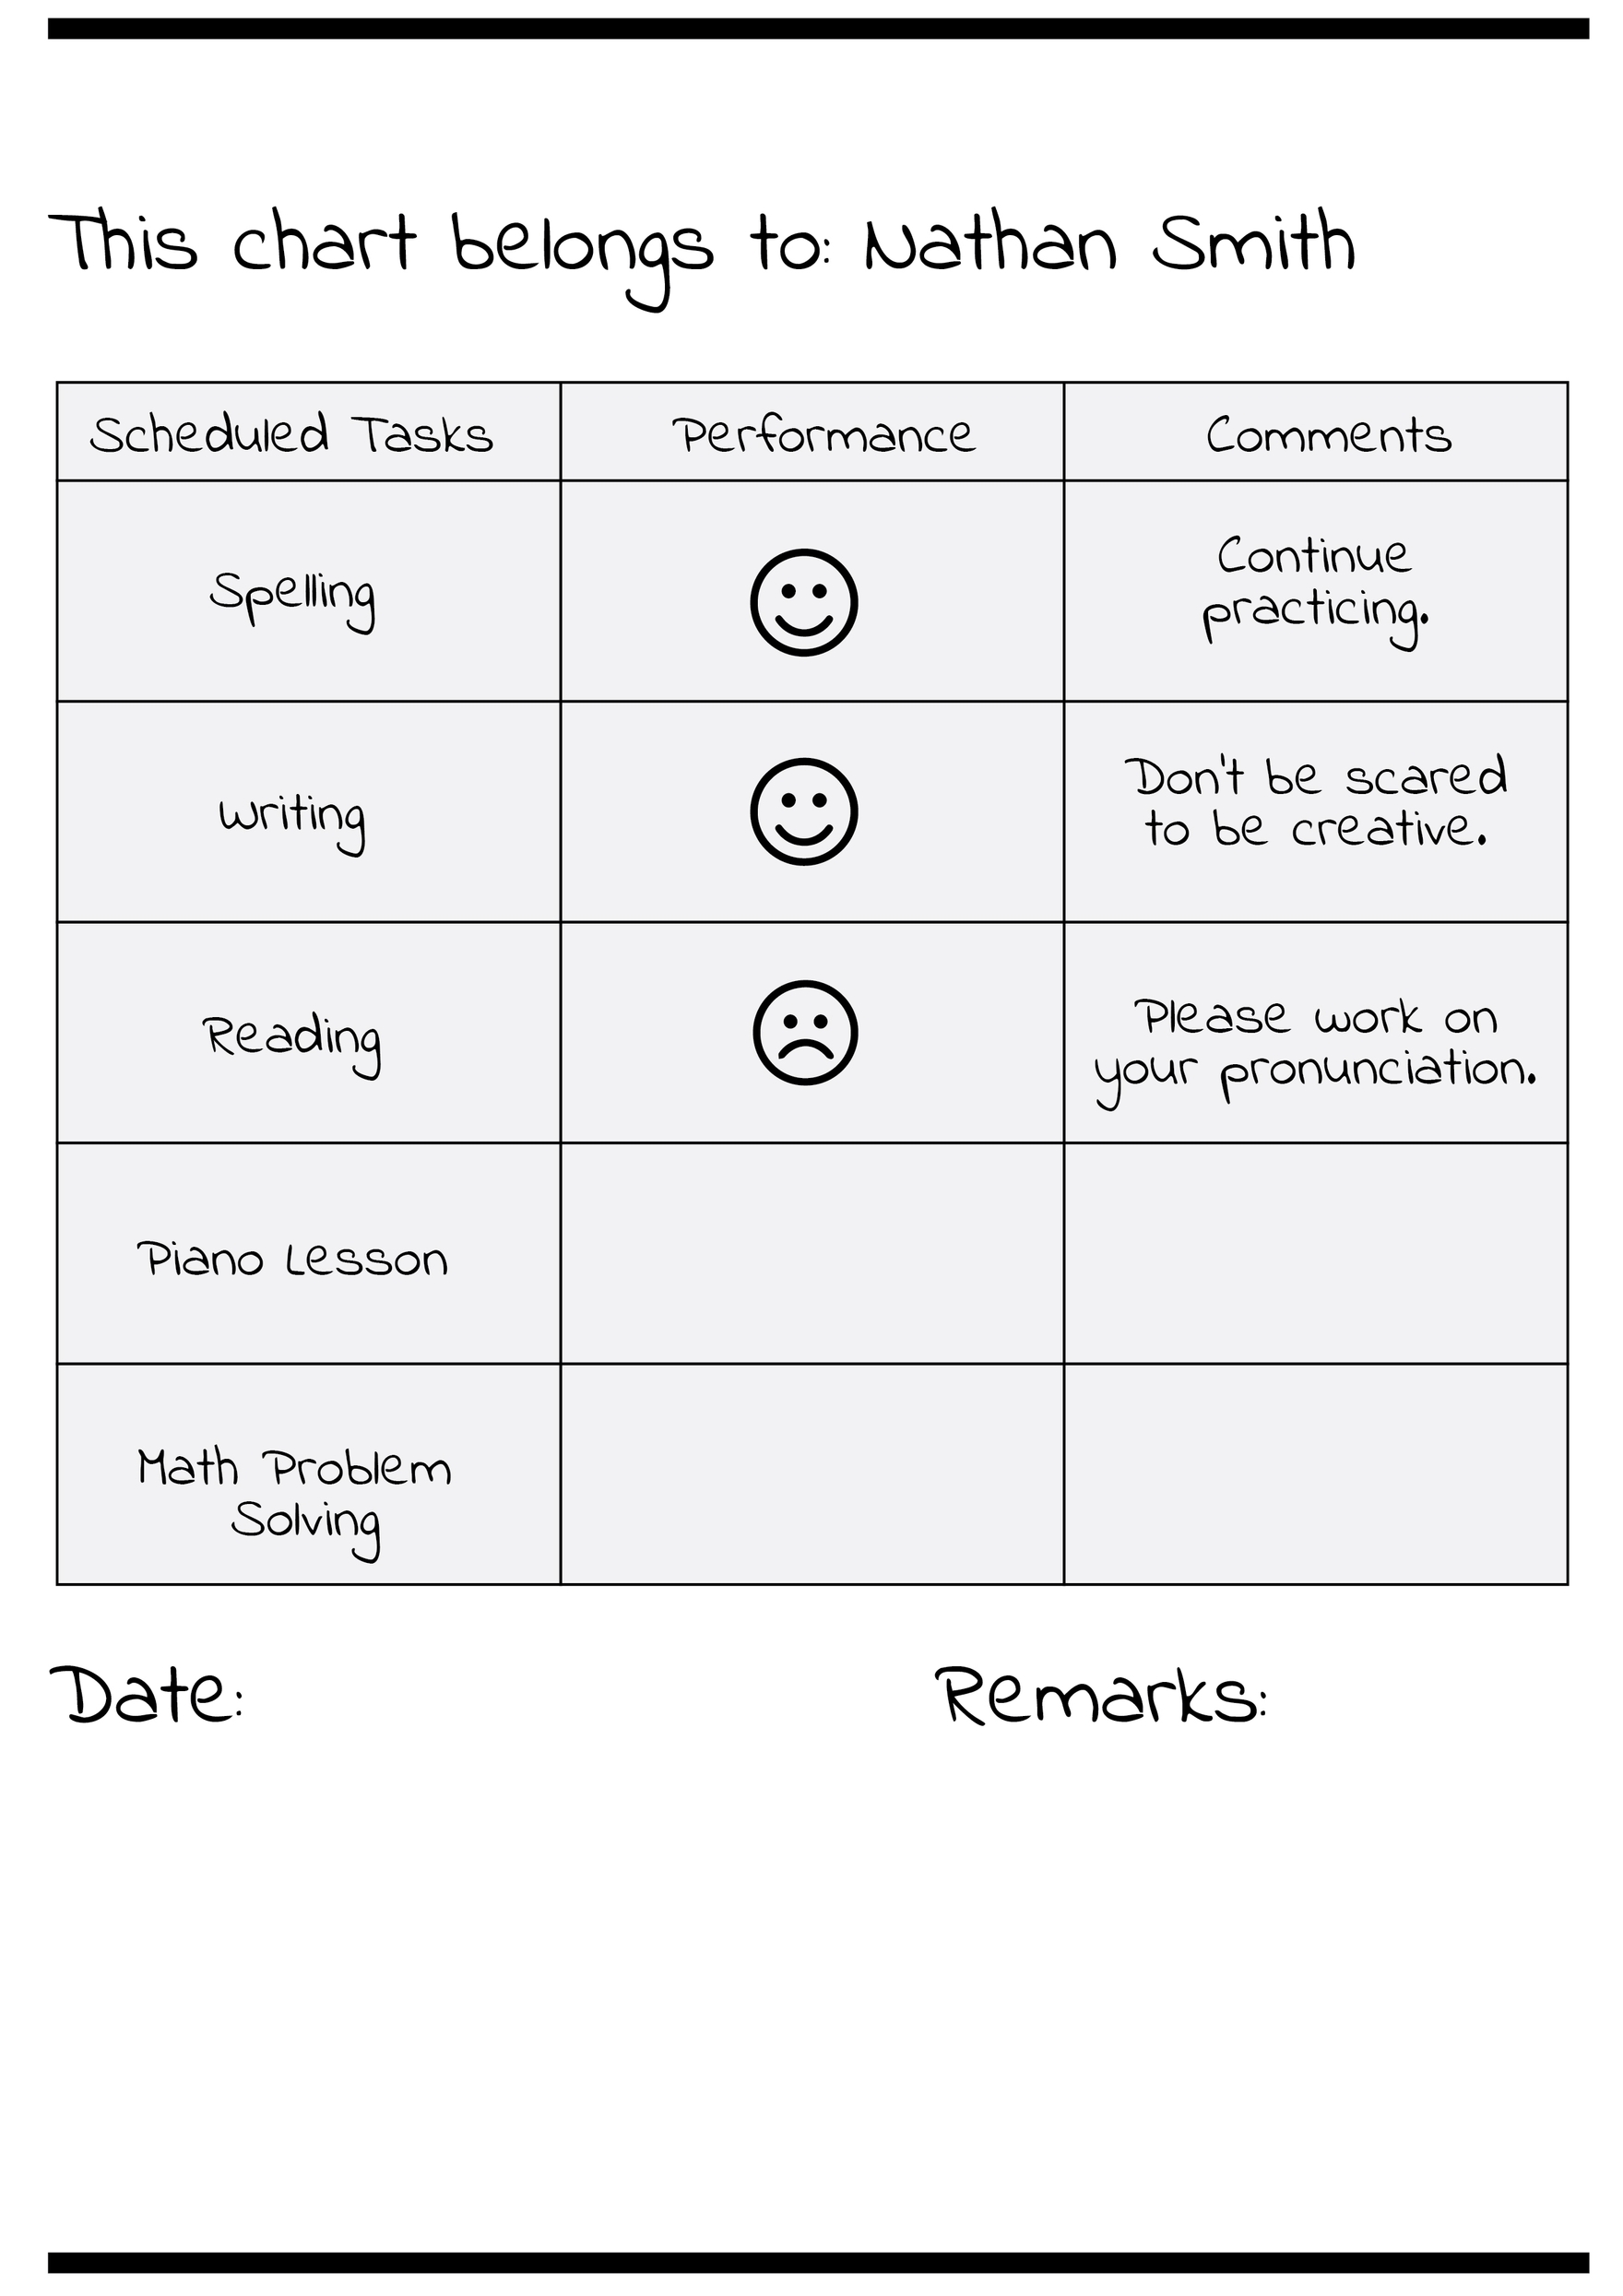
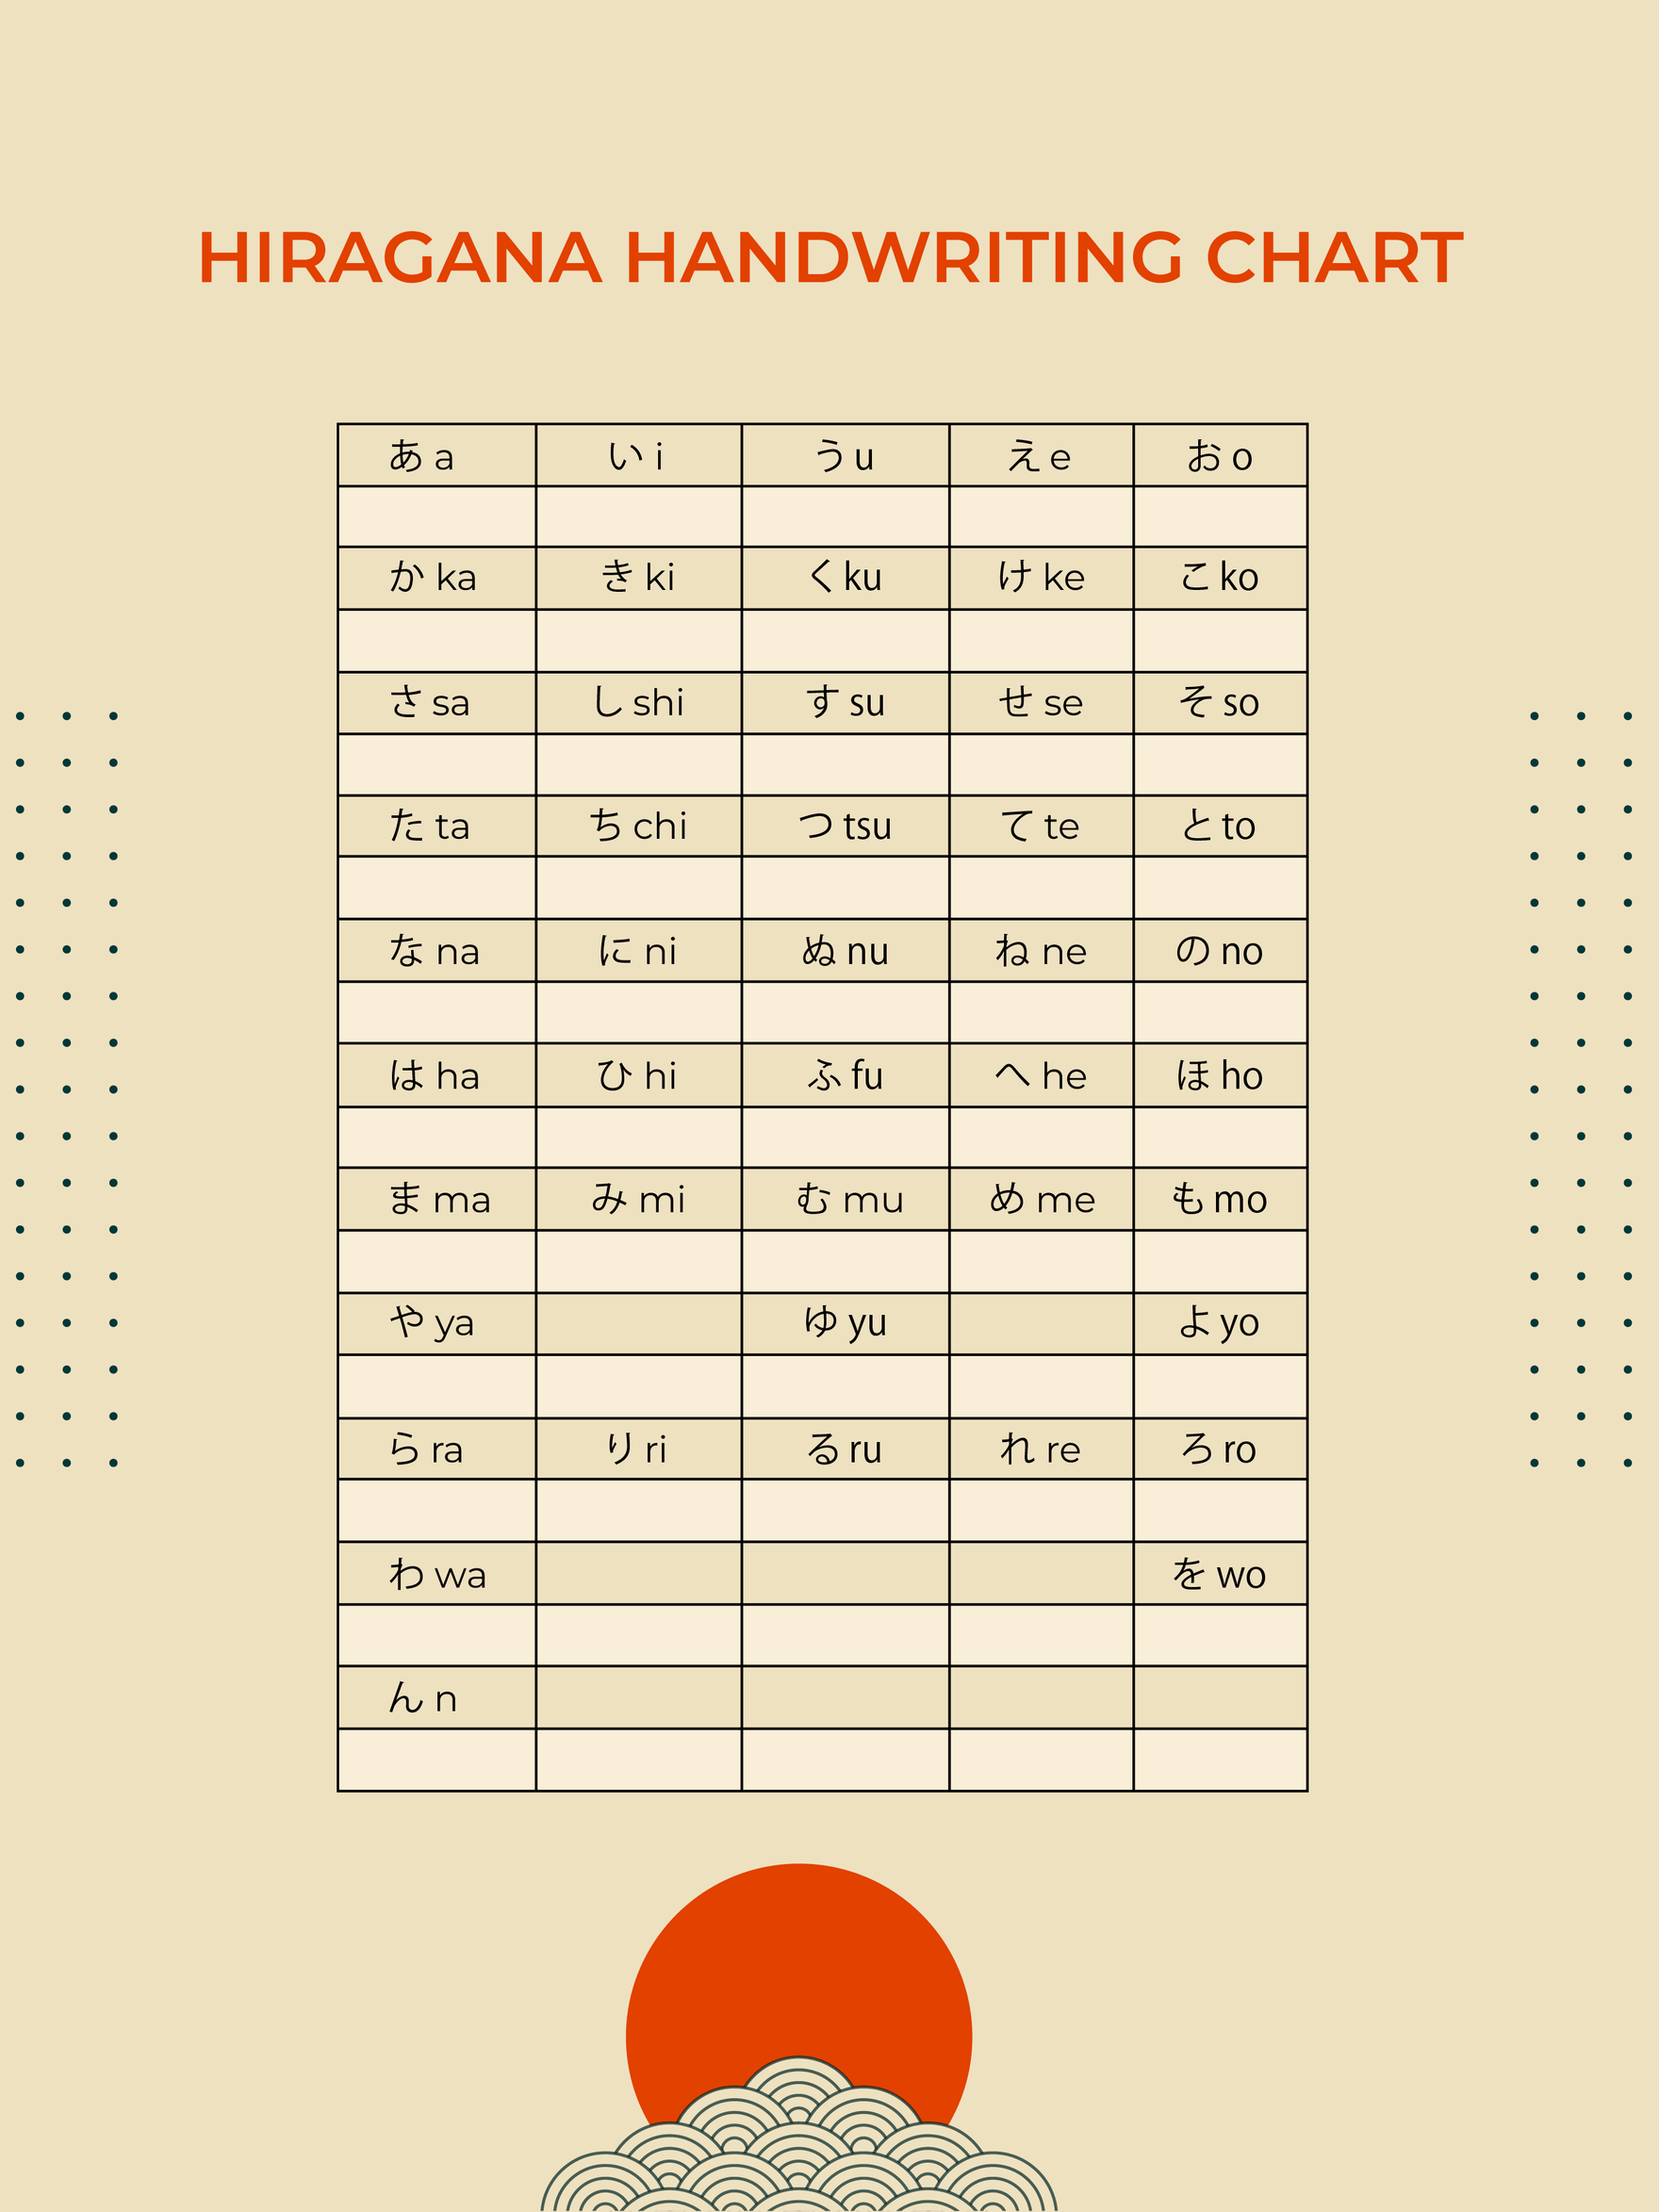
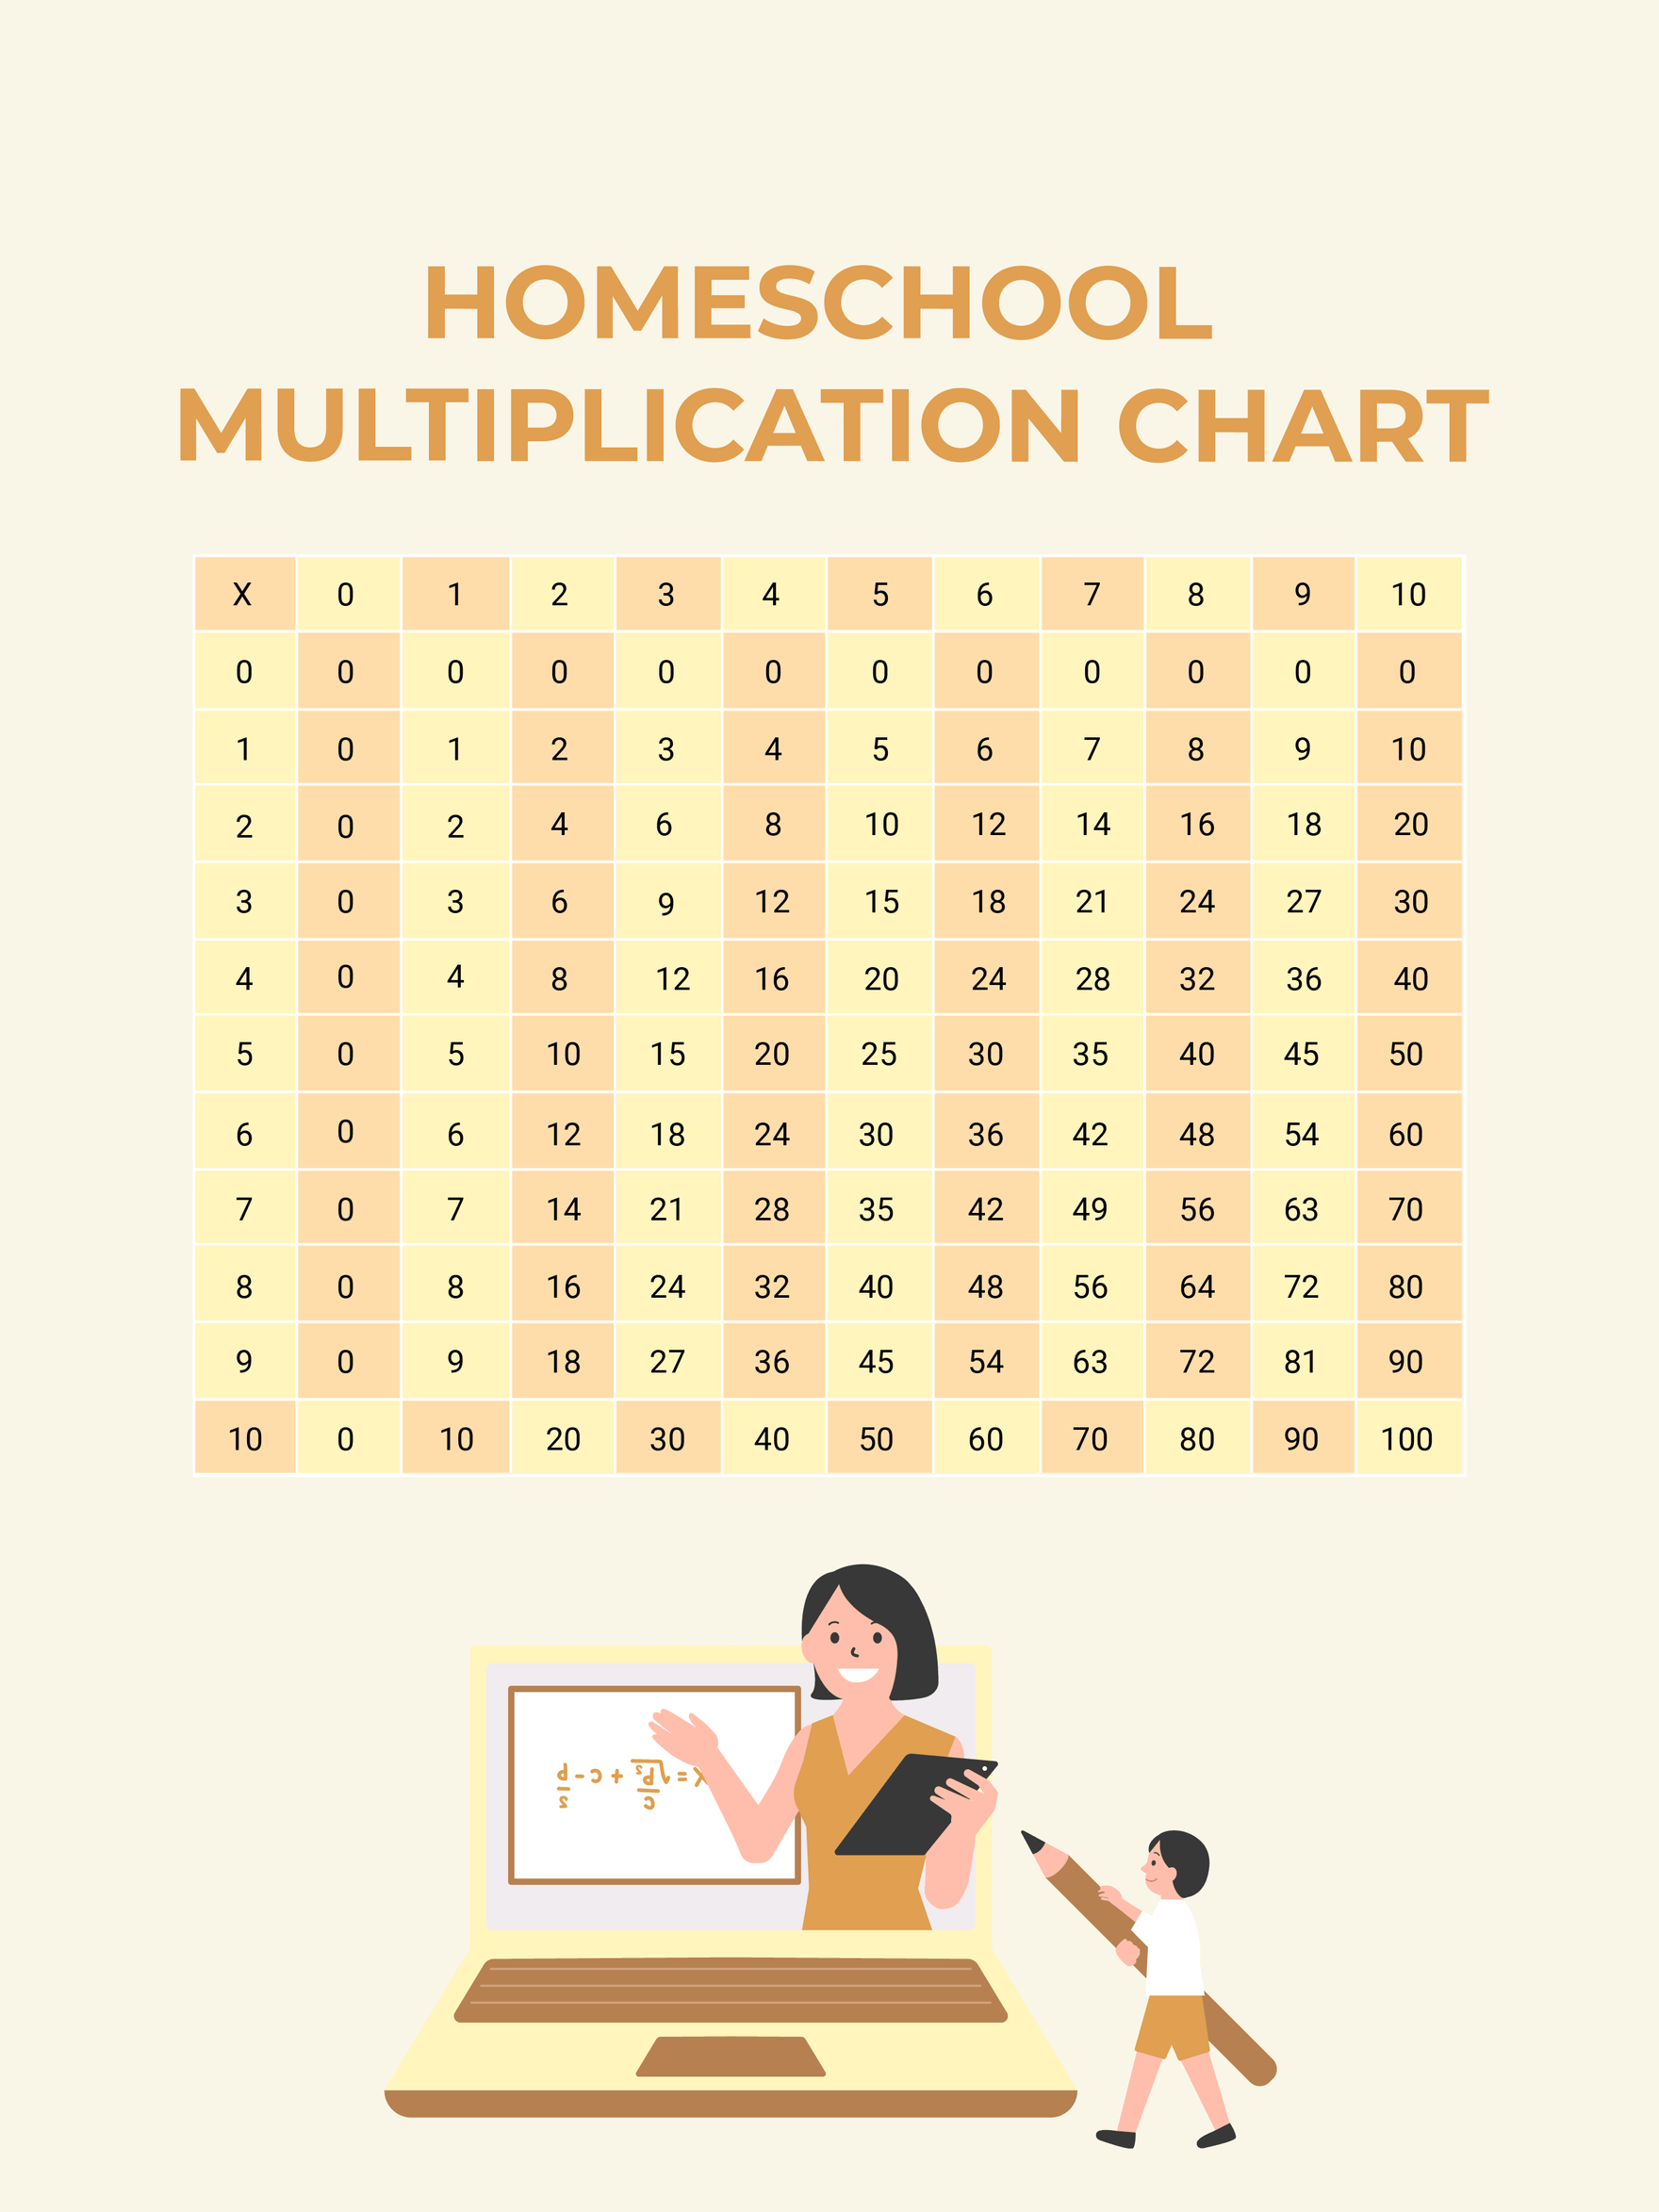
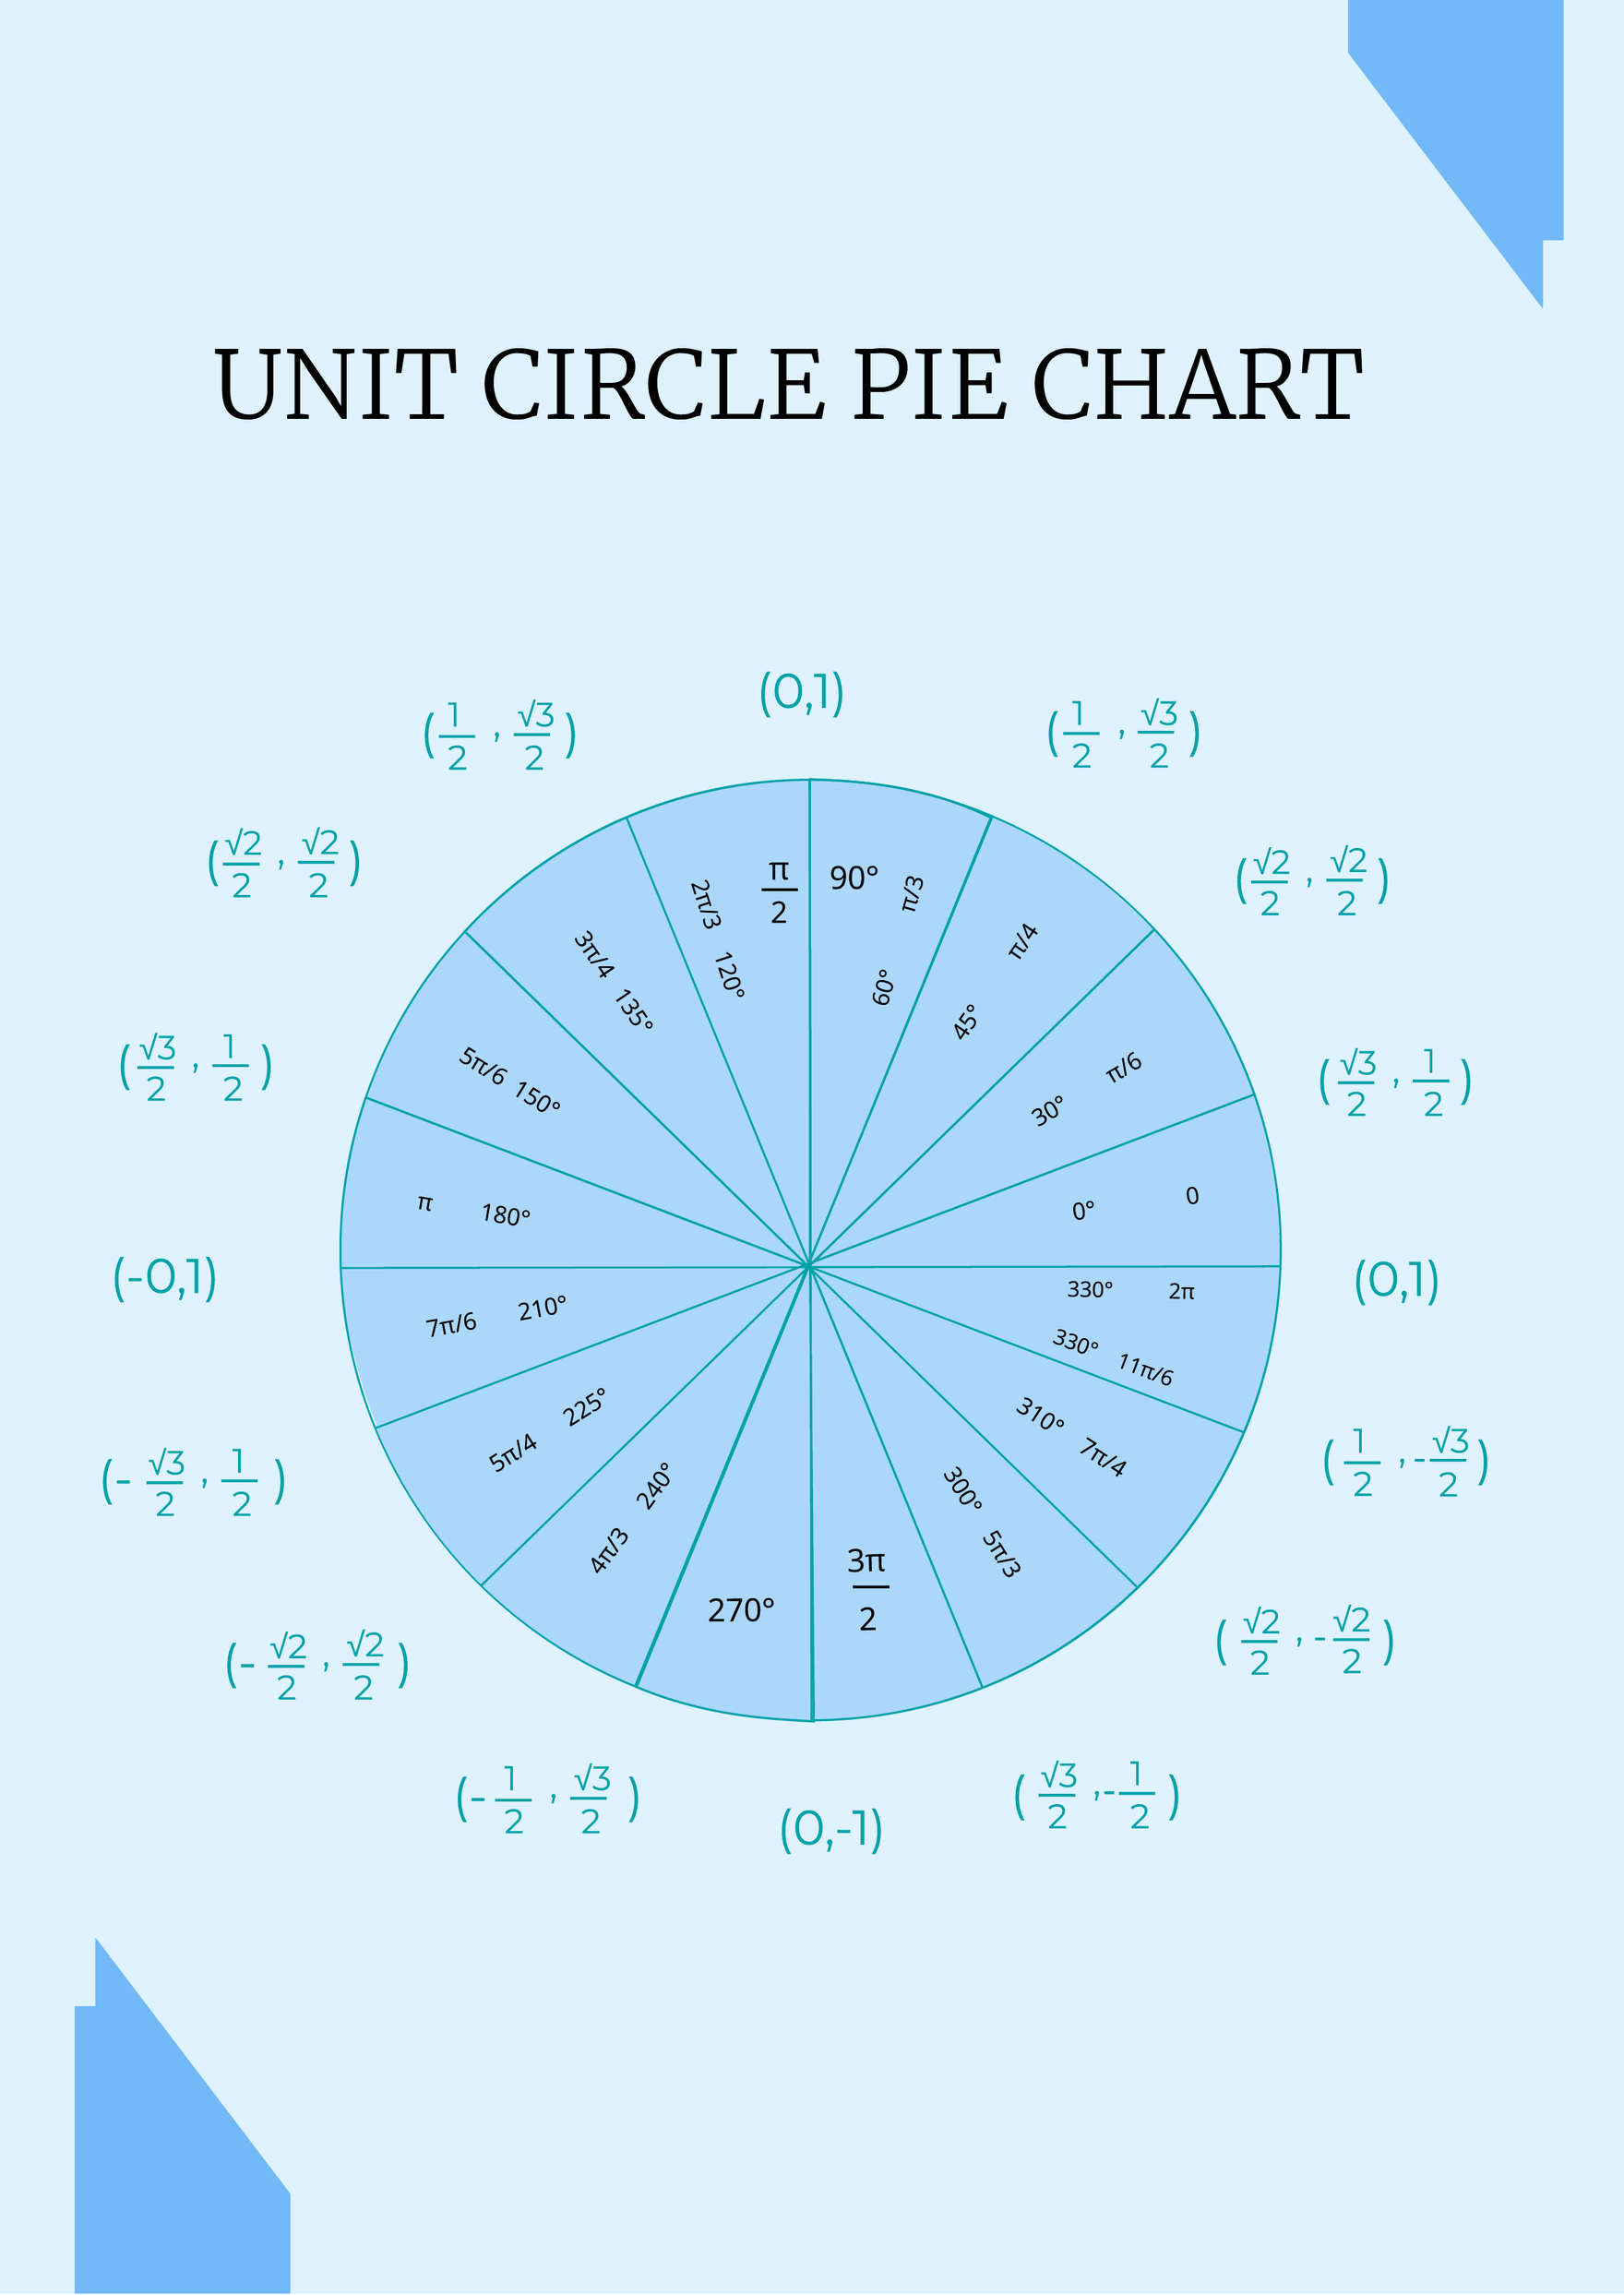
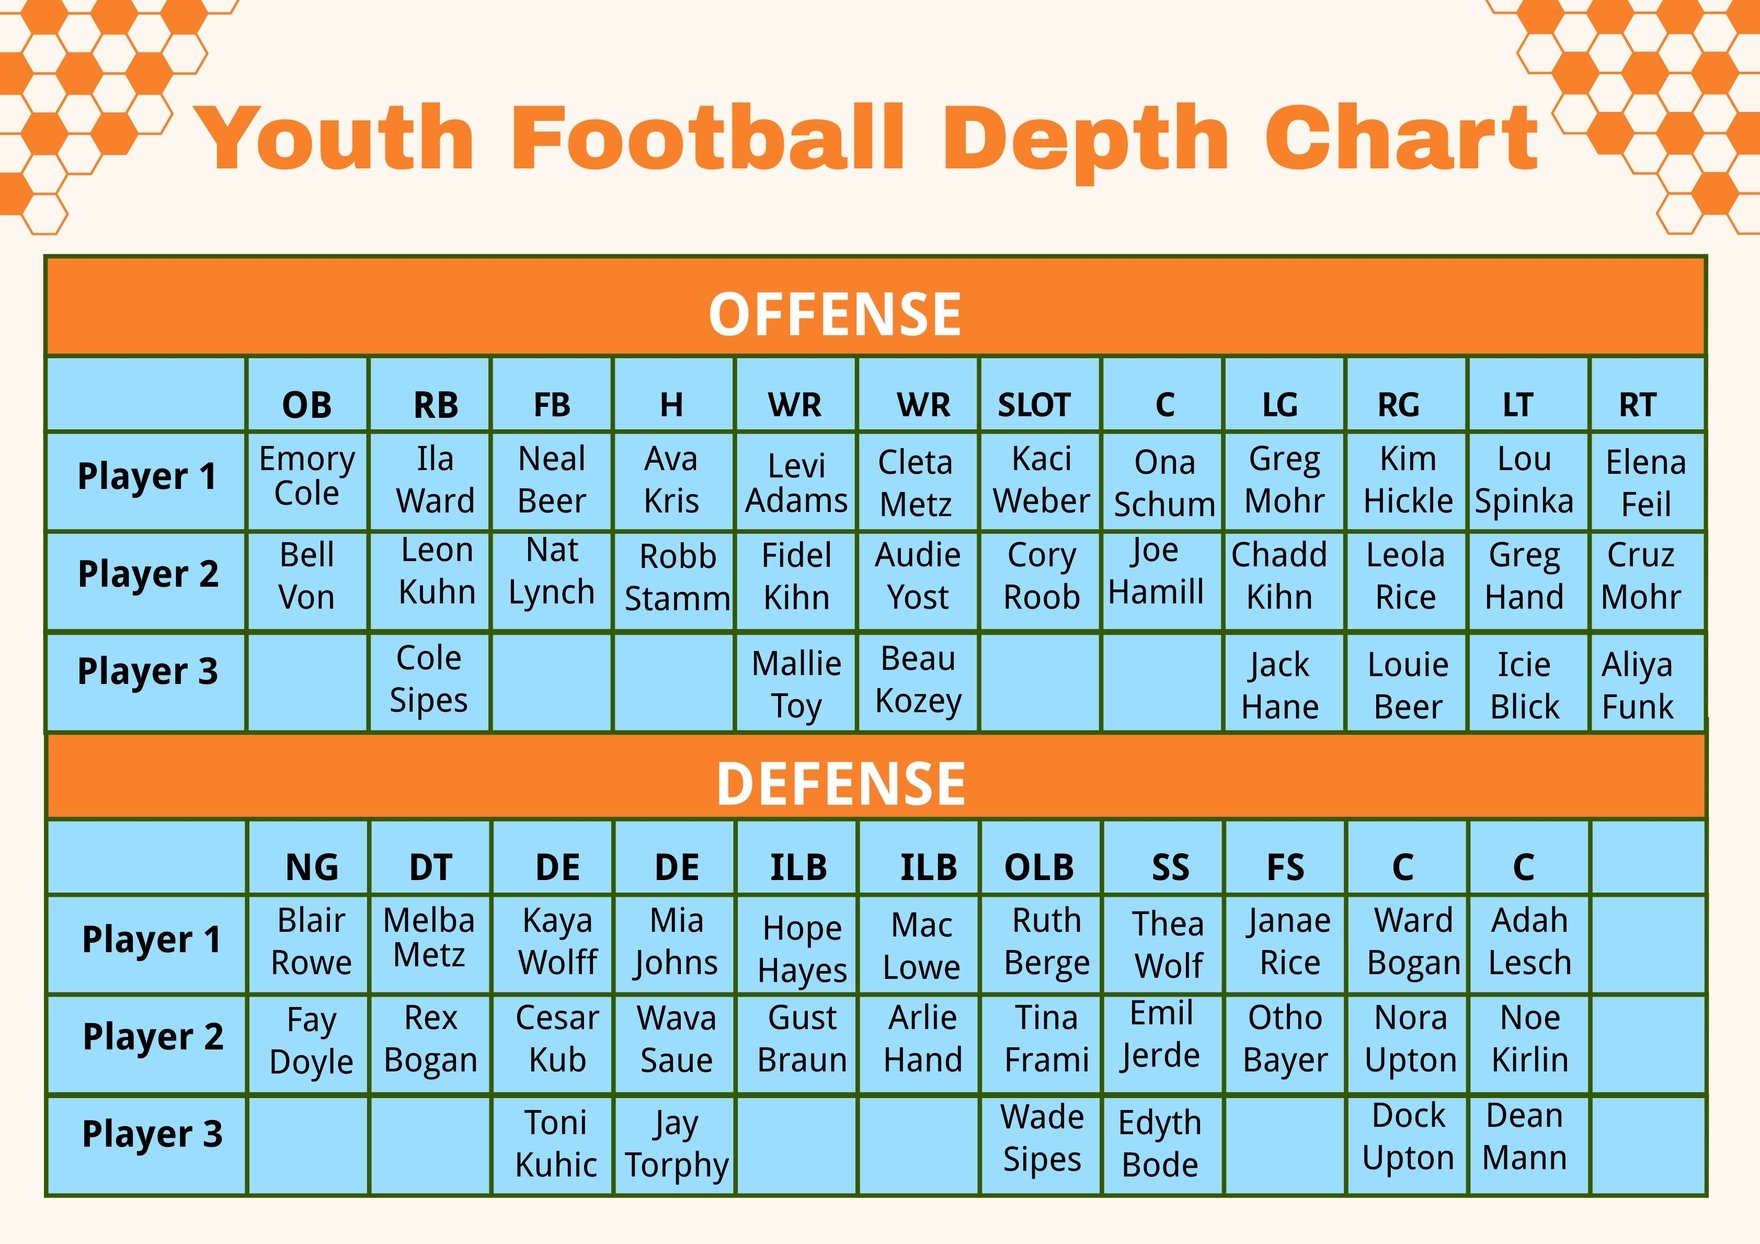
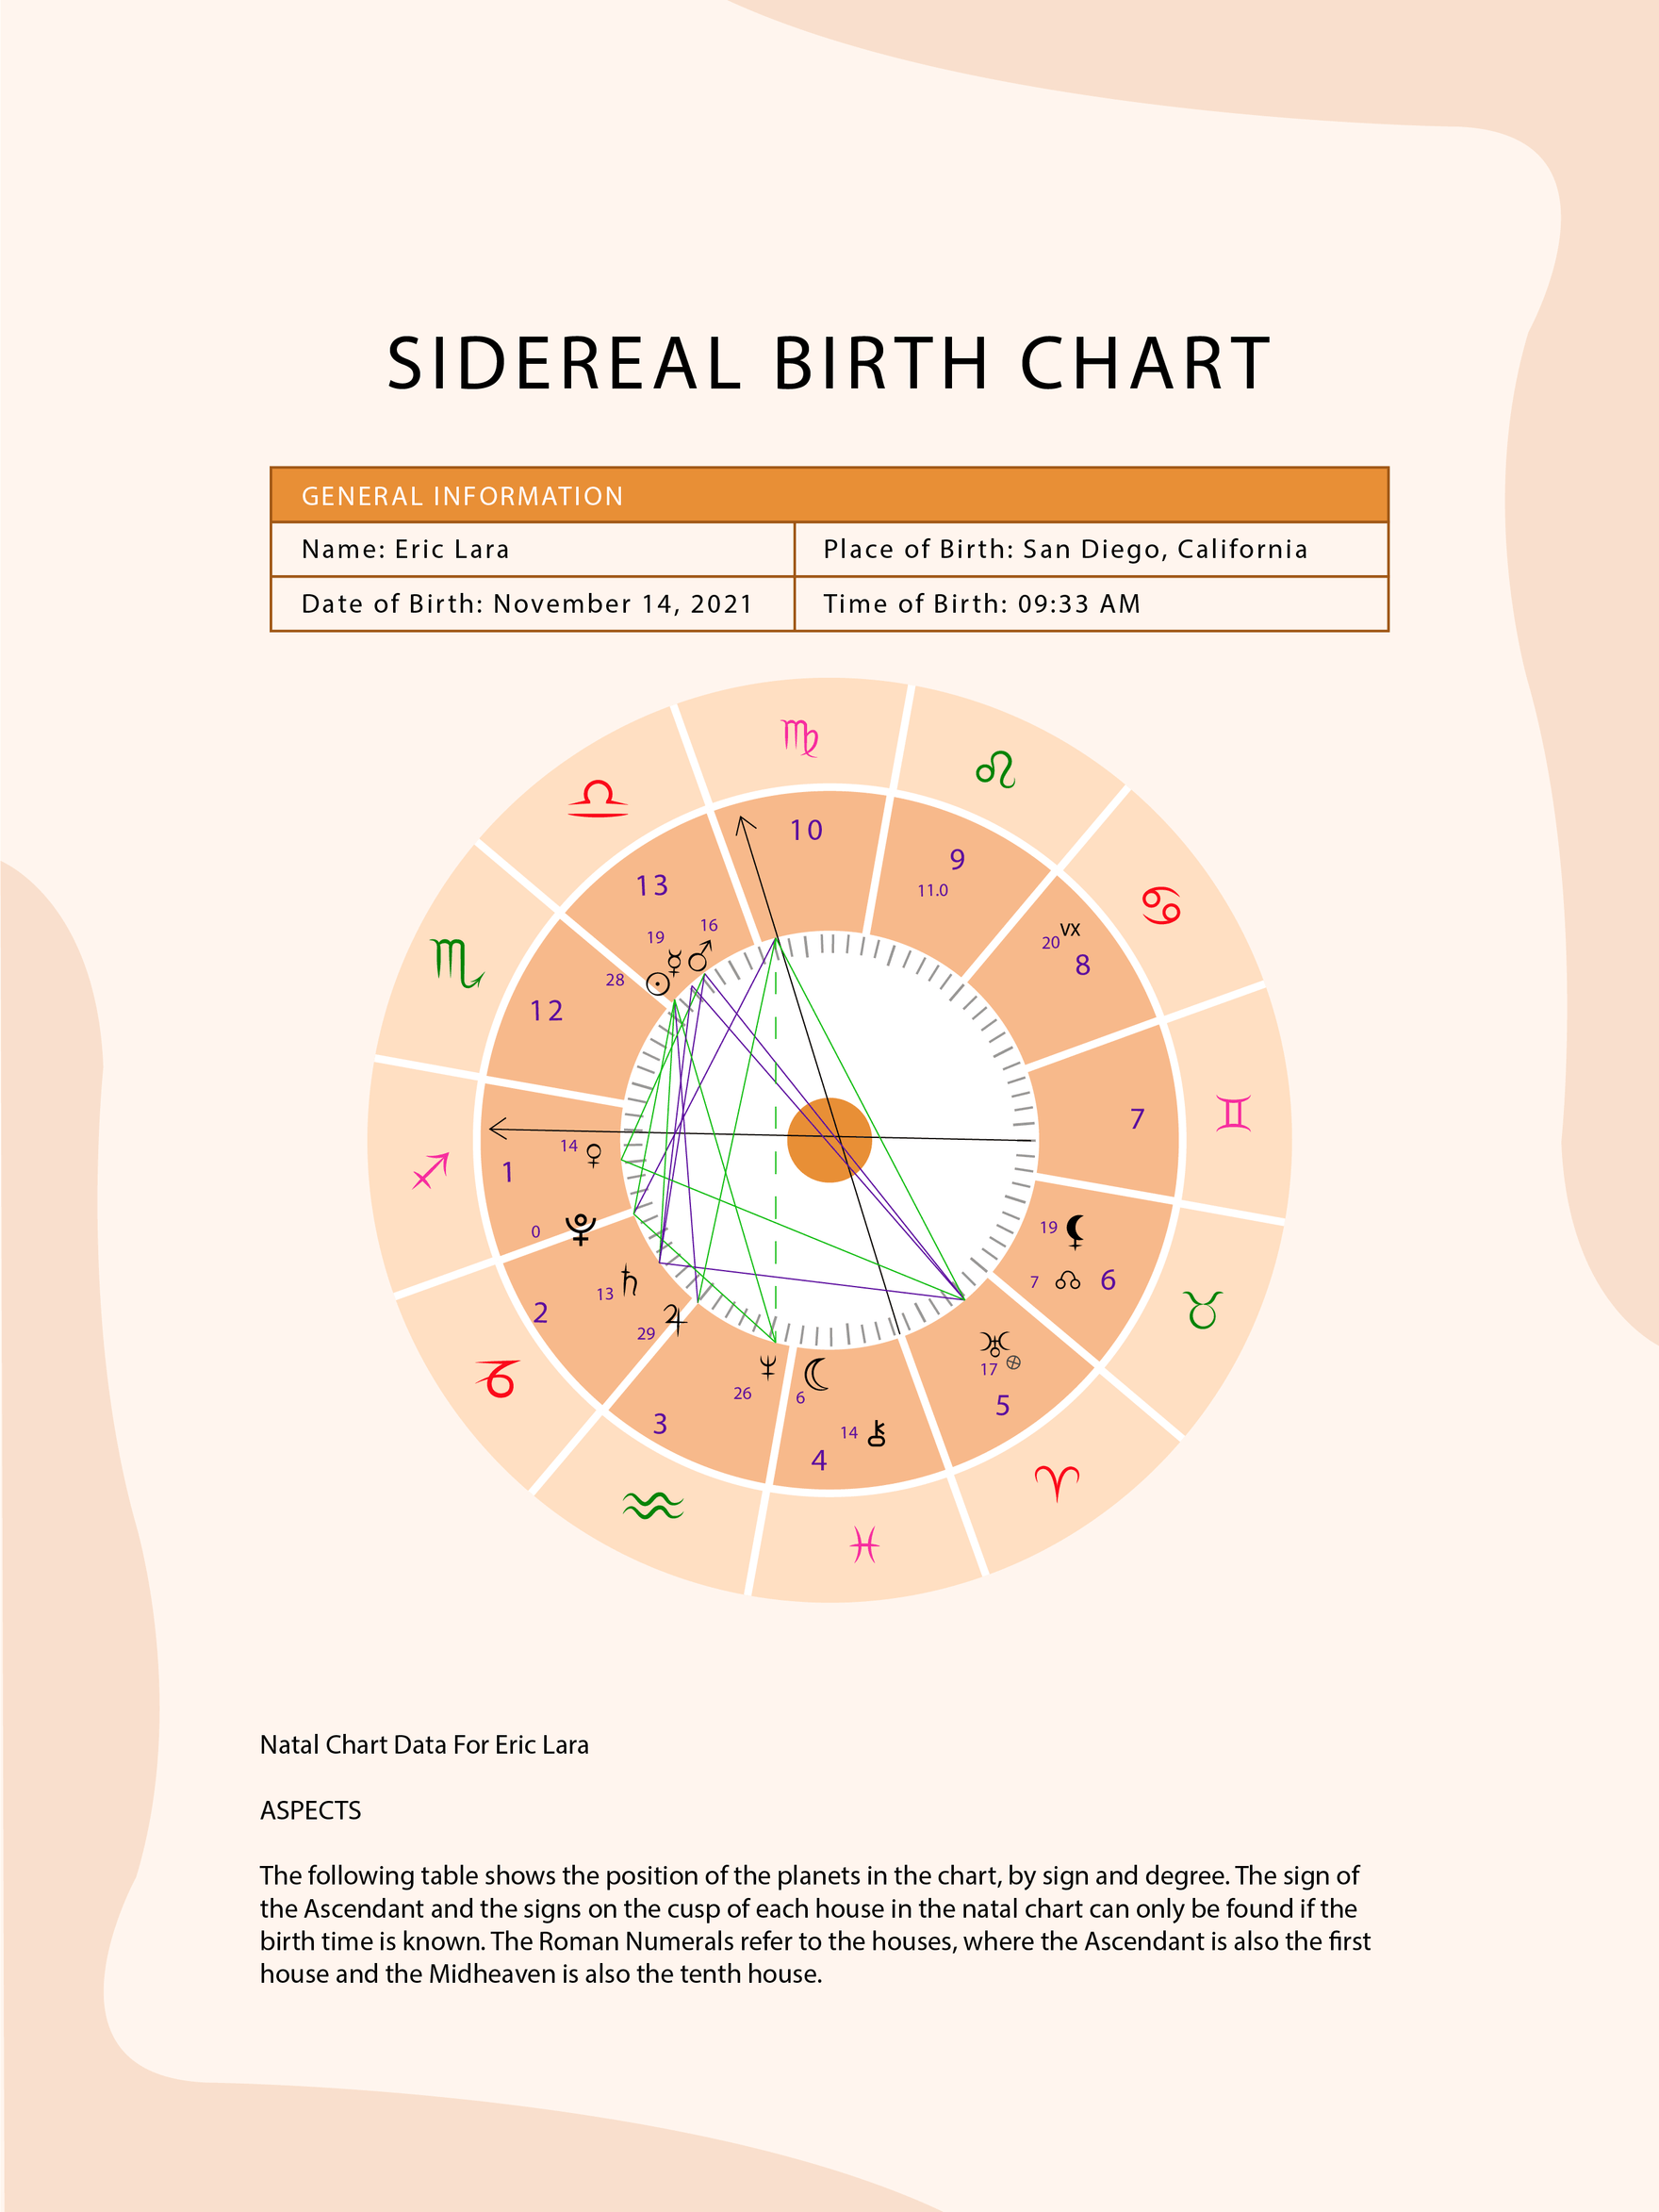
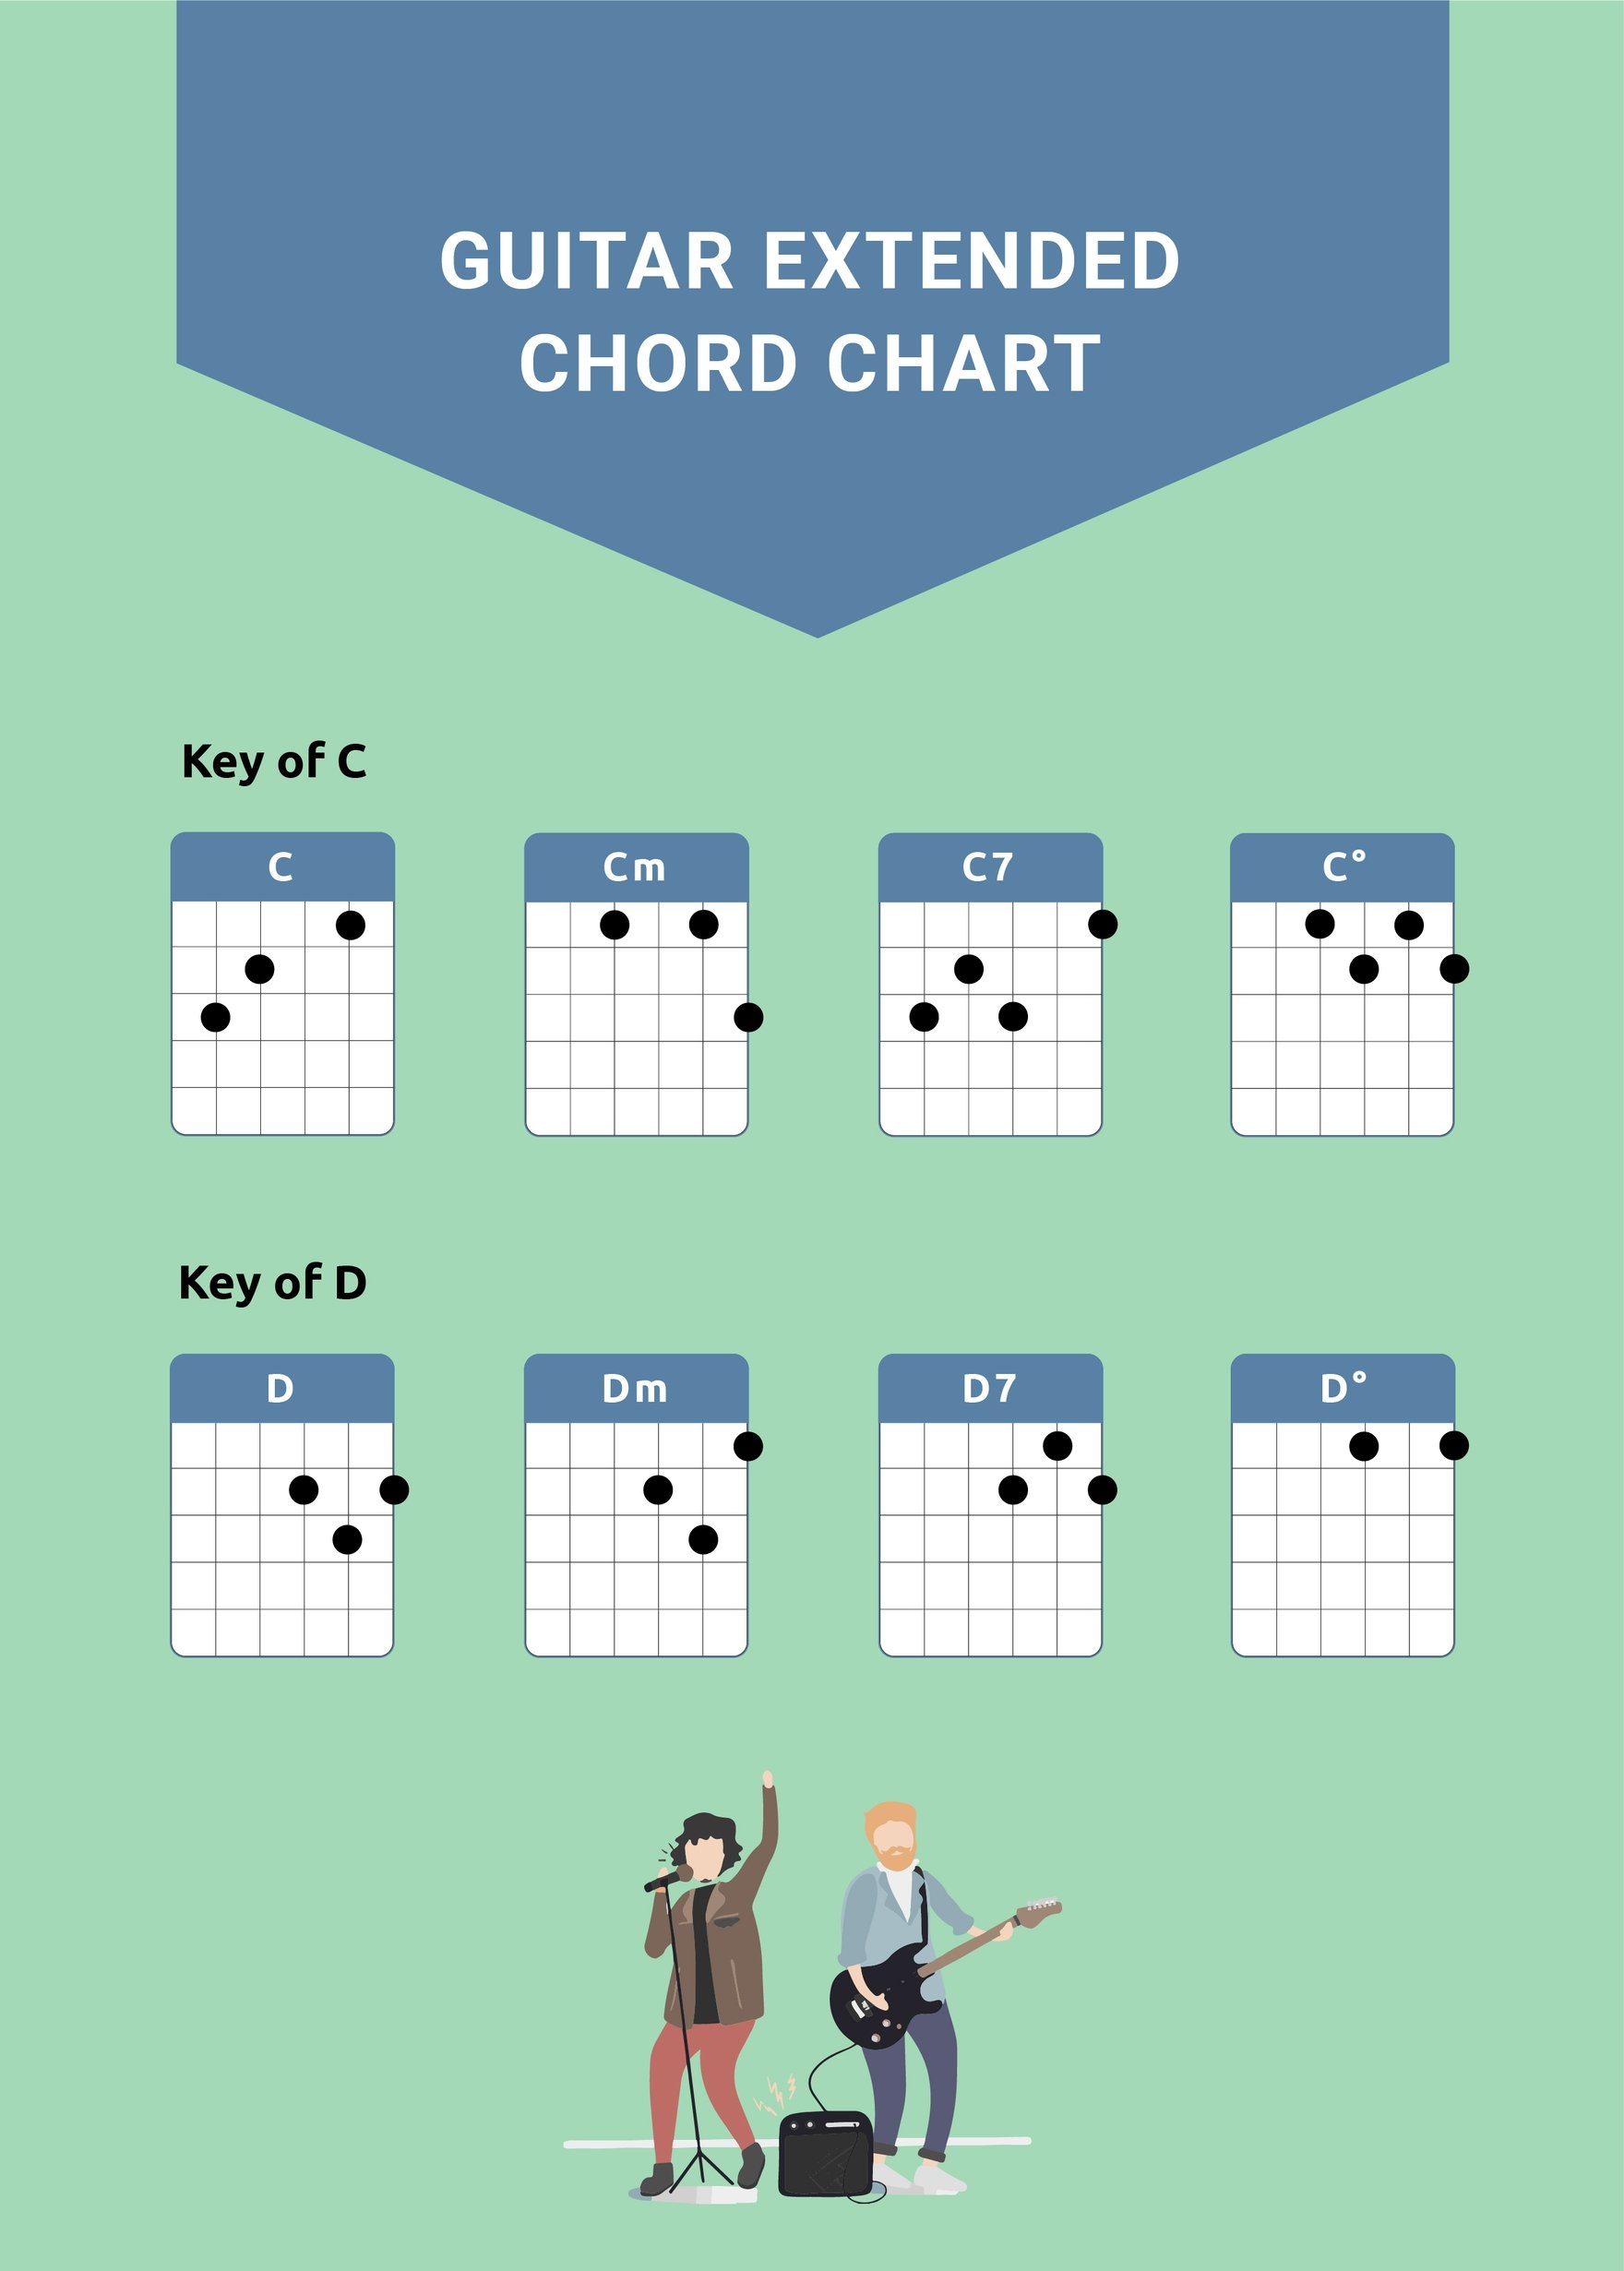
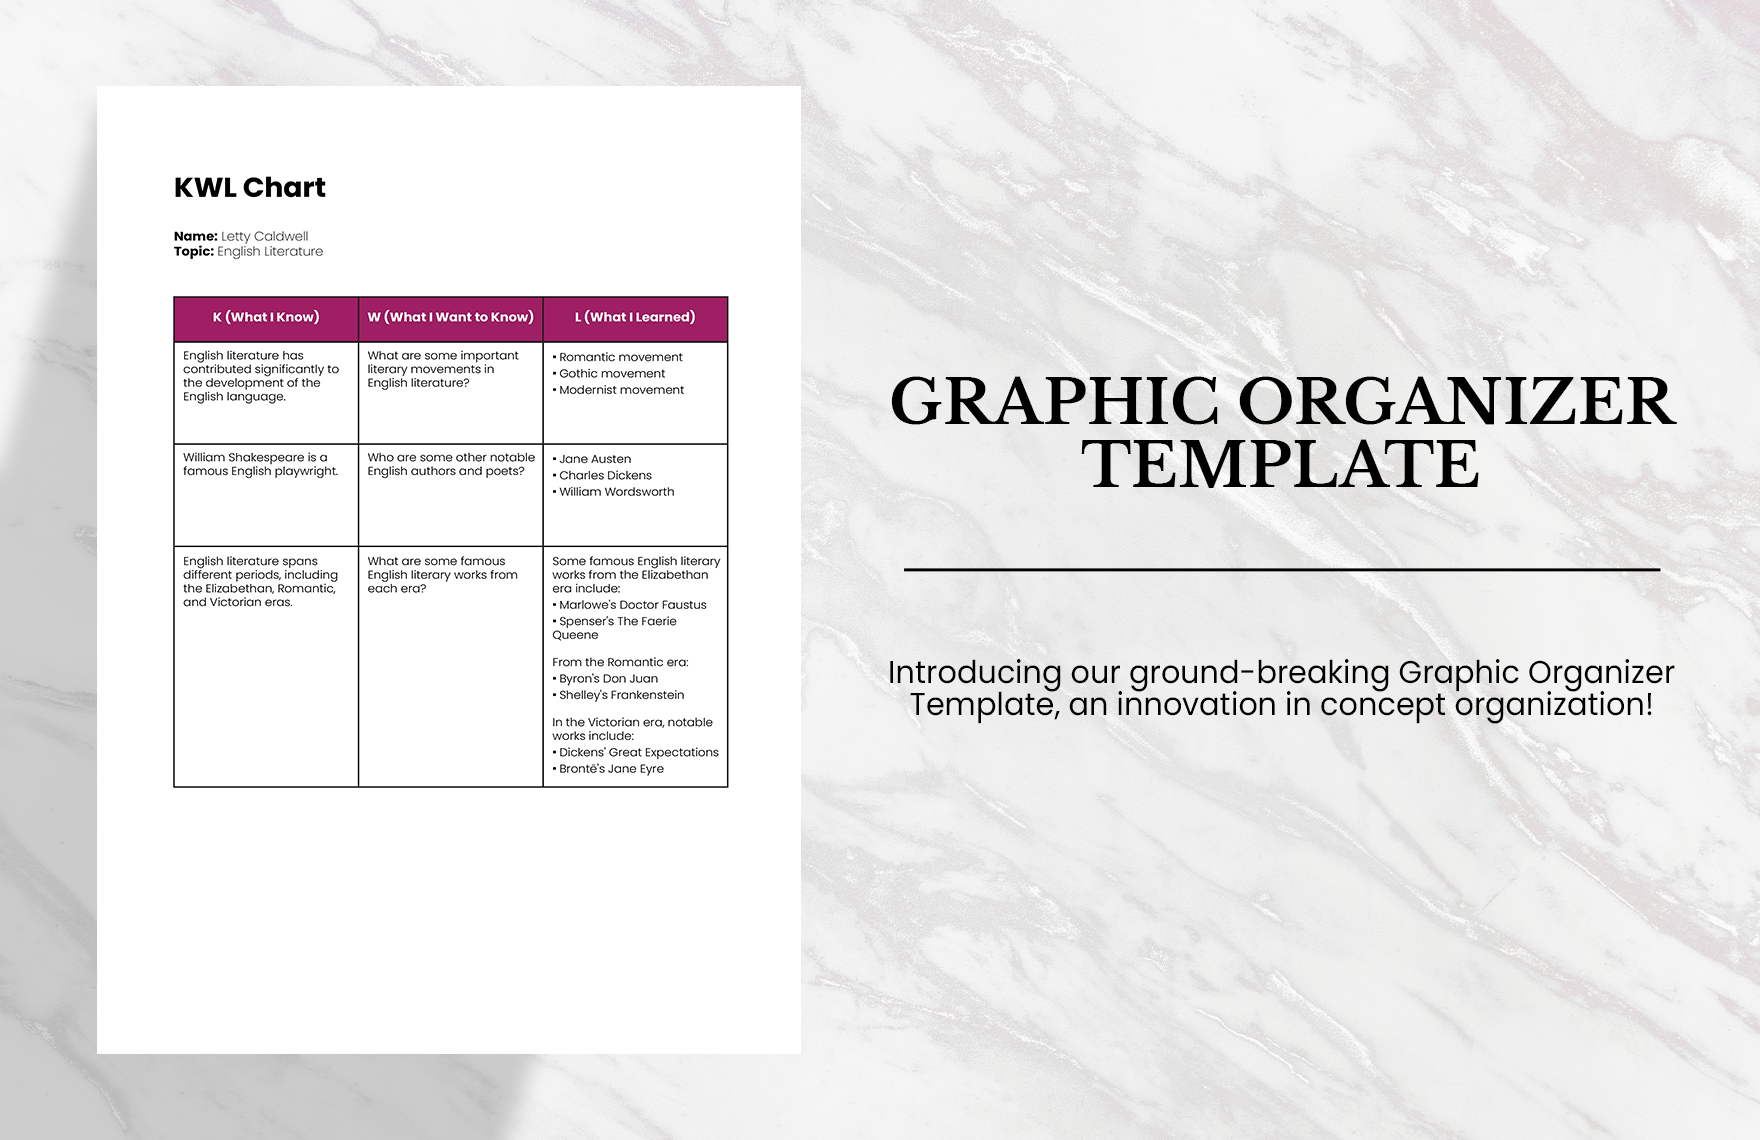
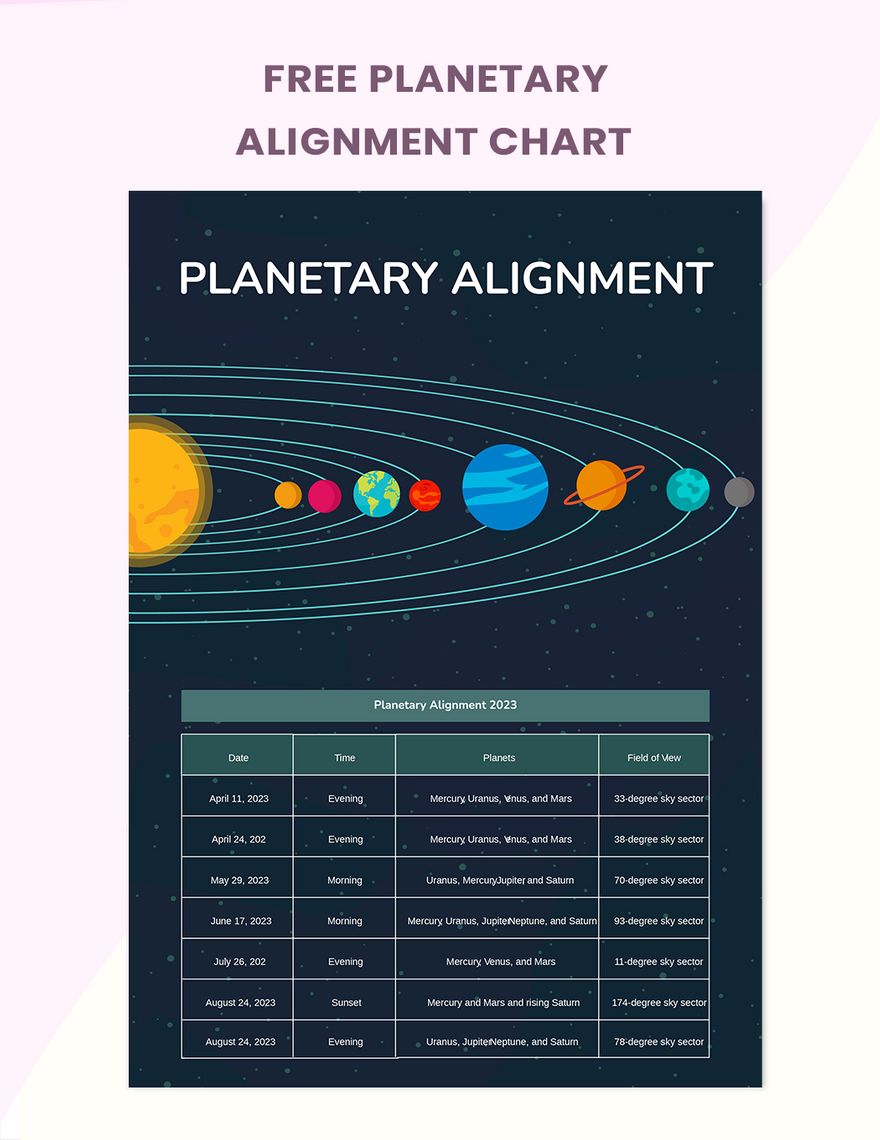
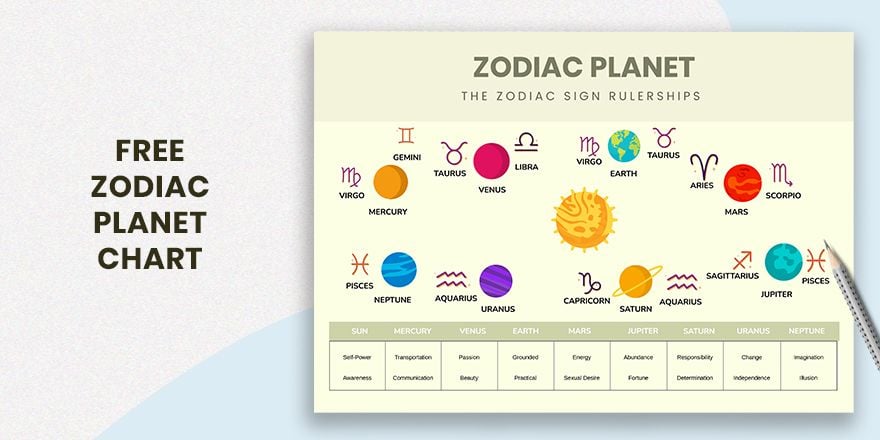
Have the capability to create an effective chart for both personal and business use with the help of our ready-made Chart Templates in Adobe Illustrator. These chart templates of ours are easily-editable and 100% customizable in any version of Adobe Illustrator. Hence, you have the opportunity to use their high-quality default layout or slightly modify them according to your specifications. All of them are available in A3 size — Print-Ready in any computer system of your choice. With the help of these templates, there's no longer any need for you to create a chart from scratch. Download any of our Chart Templates in Adobe Illustrator today!
How To Create A Chart In Adobe Illustrator?
Charts have been around ever since humanity has adapted the concept of written records, statistical analyzations, and data comparisons. As time went by, and humanity's knowledge grew ever more widely, charts had become a staple in our lives. Nowadays, this type of document is used for many different purposes. They come in different forms and names, depending on how they're being used. In general, the purpose of charts today is for business reasons and personal reasons. As a busy individual or a hard-working entrepreneur such as yourself, a chart can undoubtedly aid you with whatever task you're about to do, regardless if it's personal or business-related. That's why we are eager to share some tips on how to create a chart that will help you with your tasks.
1. Select Adobe Illustrator
Adobe Illustrator is a fully capable editing software to be used as a chart creator. It has a user-friendly interface that makes it easier and convenient on your behalf to create your sample chart. Adobe Illustrator is actually designed for the creation of graphic images and web interface layouts. With that fact, you can expect that it has the power to create any chart of you're choice. However, it's entirely up to your preference on what editing software to use. Other good options are MS Word, MS Excel, Adobe InDesign, and Apple Pages.
2. Determine The Function Of Your Chart
It's basically impossible for you to create a editable chart without determining what its function will be in the first place. So before you start creating your chart, identify what function it will serve. Once you've done that, you'll have some ideas on how you're going to formulate it.
3. Form Your Chart According To Its Function
The form or structure of your chart must cater to what function you wish it should serve. For example, if its function is to showcase your company's hierarchal chain of command, you should form it into an organizational seating chart or a flow chart. If it's a data comparison, you should form it into a line chart, a bar chart, or a pie chart.
4. Apply Some Creativity If Needed
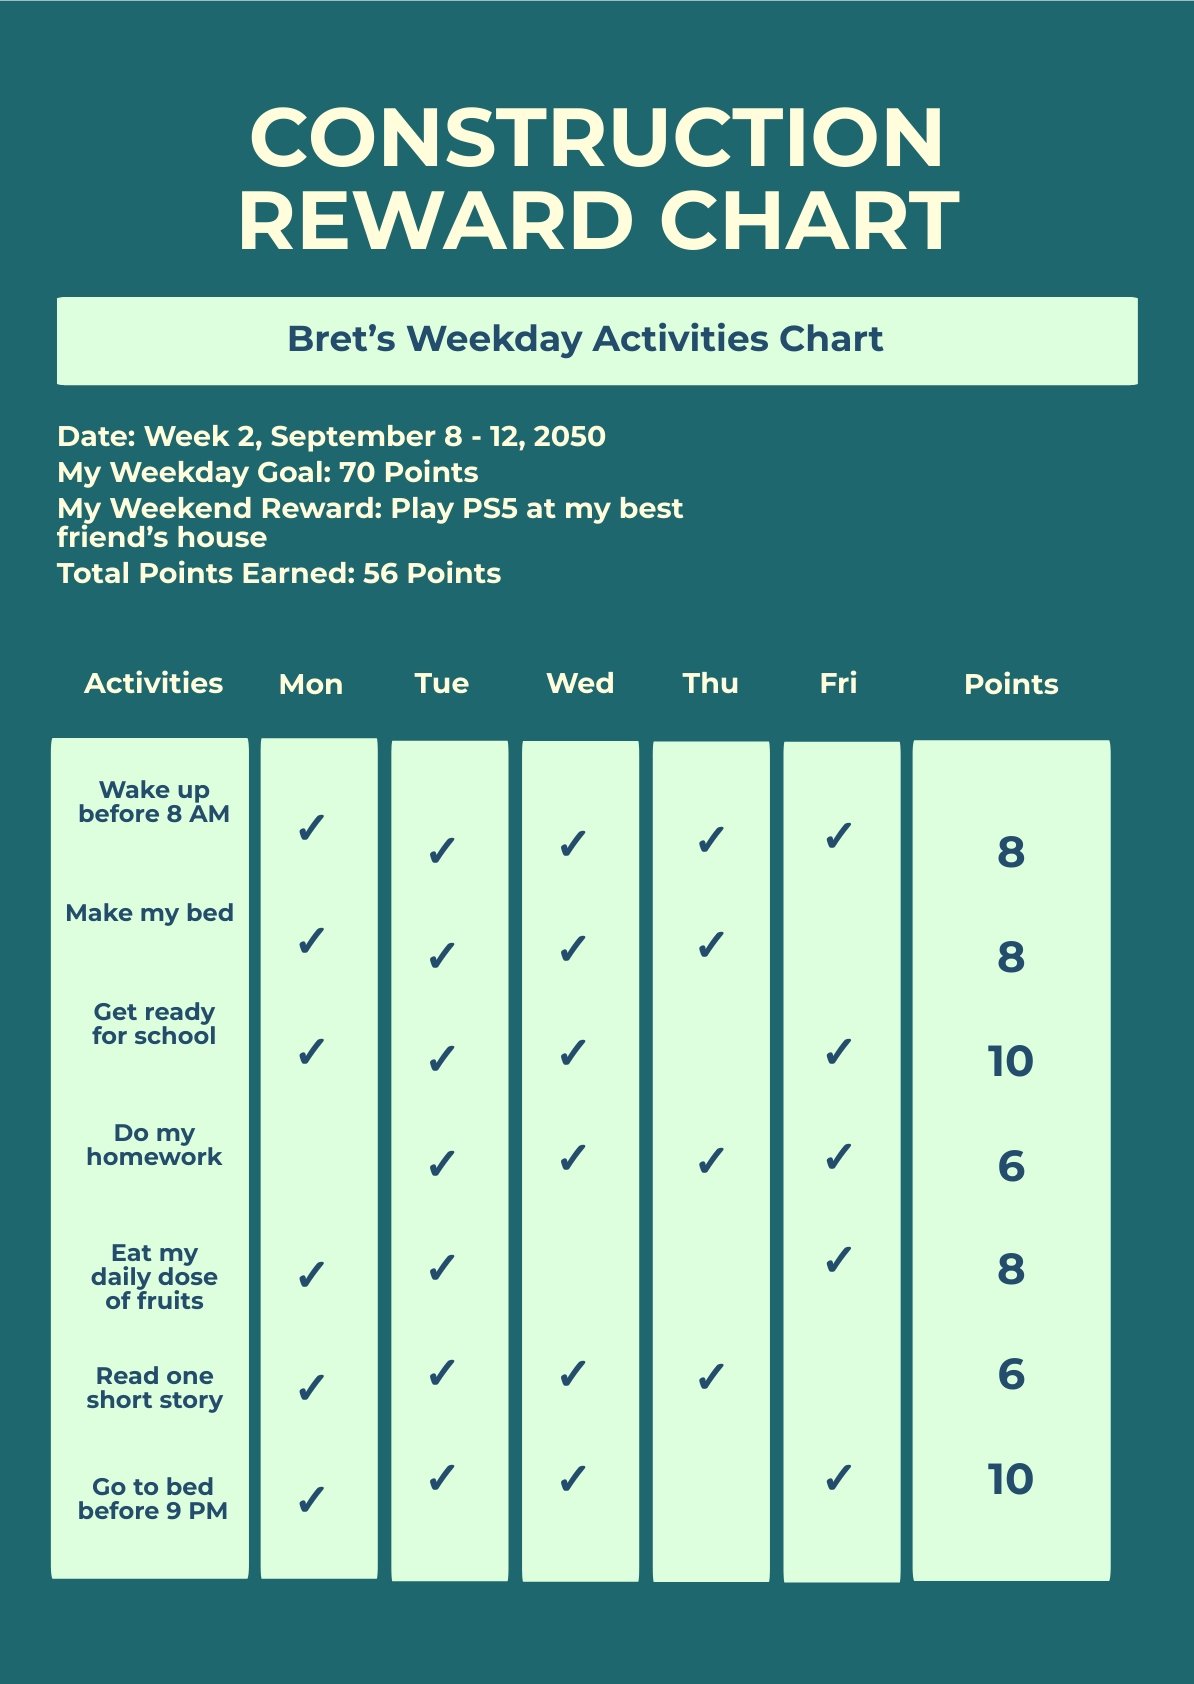
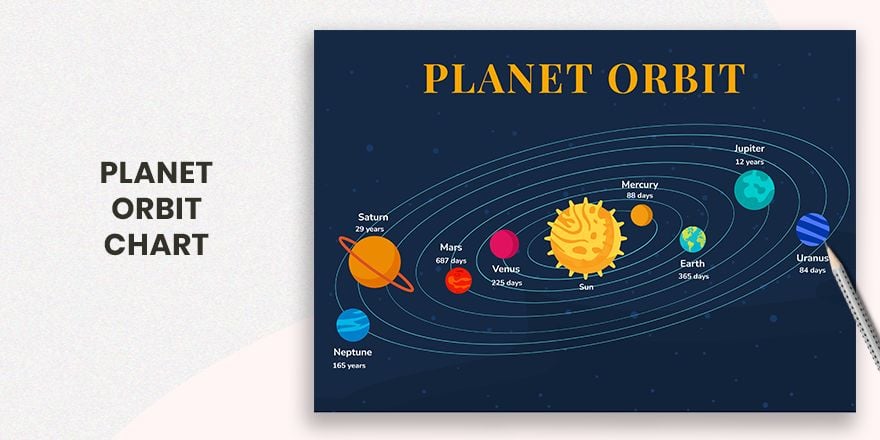
There are some cases wherein a chart is used for a business presentation or seminar. In cases such as that, it's best to apply some creativity with your chart. Just see to it that it's contents are not drowned, but rather elevated to be better understood. A good example is the use of artistic infographics and images that represents a chart's data and stats. However, if the chart you'll be making is for personal reasons, such one for a diet guide or chore checklist, it's entirely up to you whether you want to craft creatively.
5. Use Our Chart Templates
We assume that an individual such as yourself is likely busy with no time to do extracurricular tasks. For that reason, we are proud to offer you our blank chart templates. We have organizational chart templates, Gantt chart templates, basic chart templates, flow chart templates, and so much more. With their help, you no longer have to structure a chart from scratch; thus saving a significant amount of your time.


