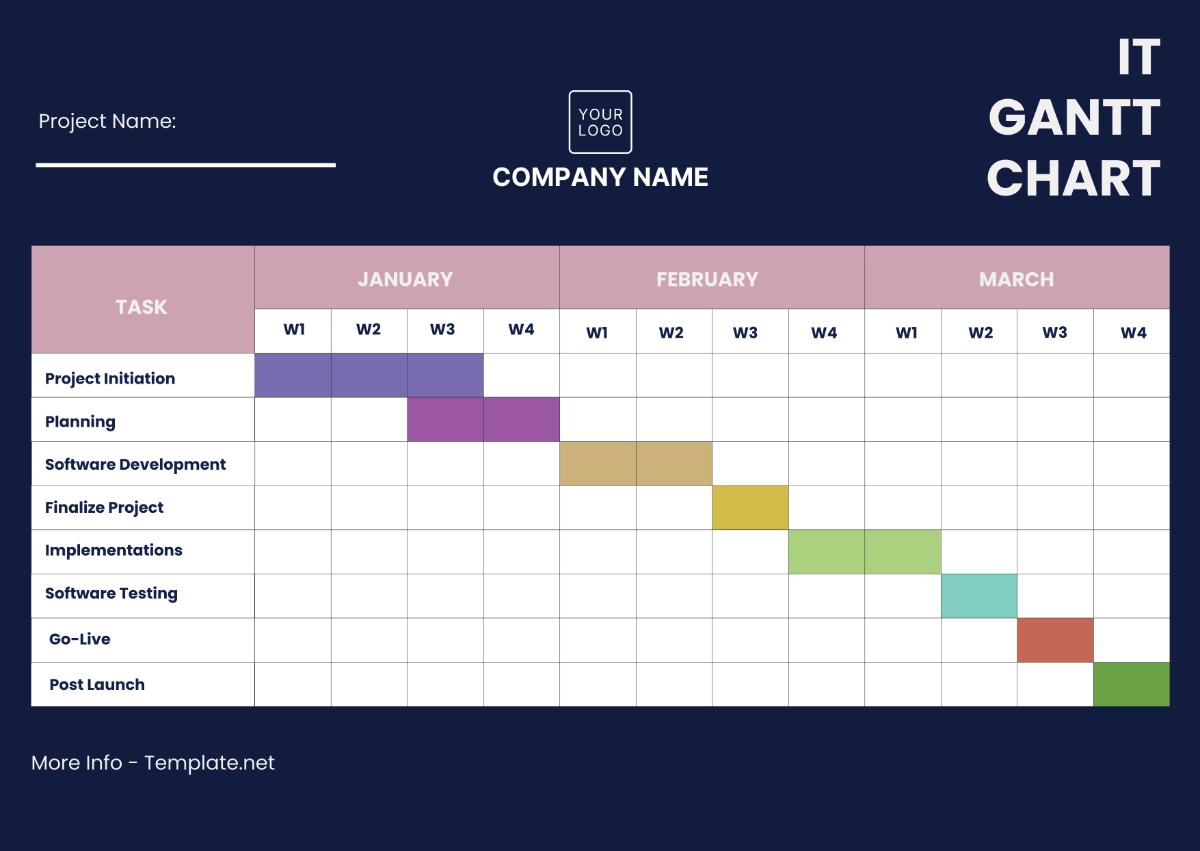
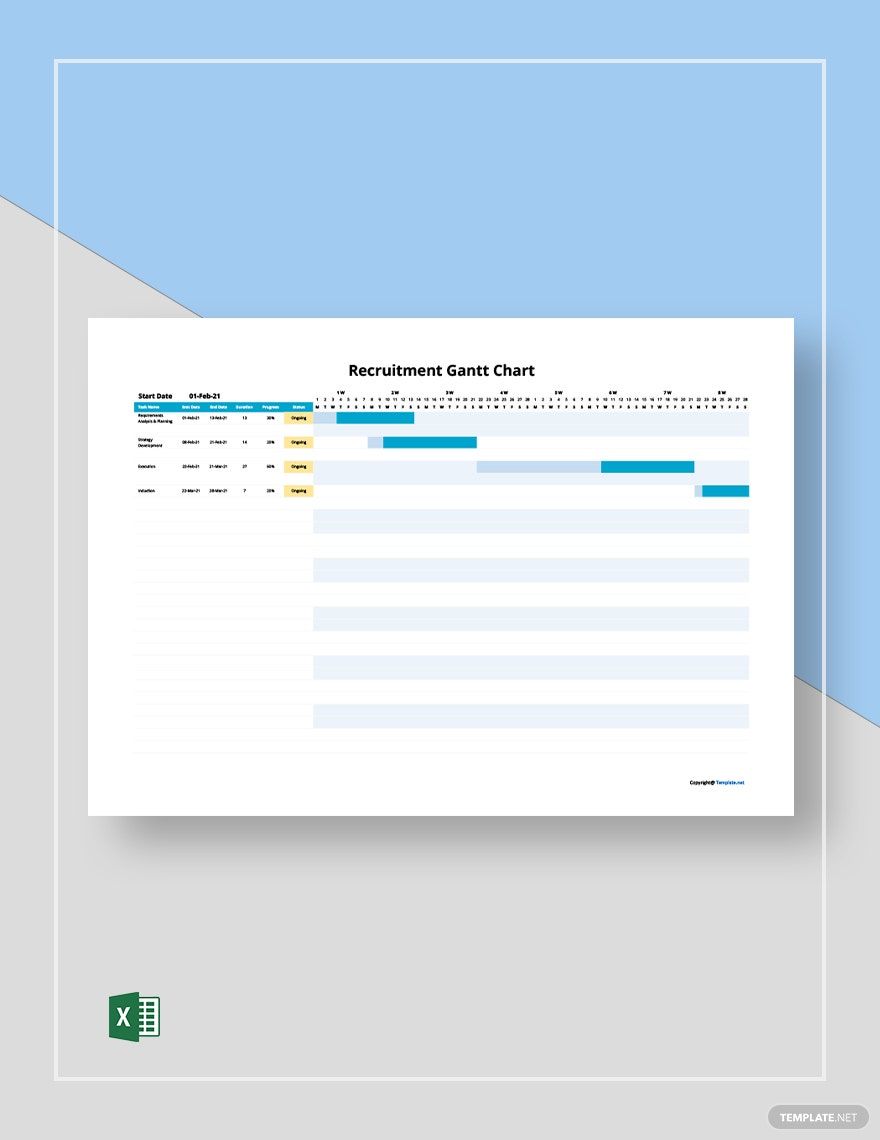
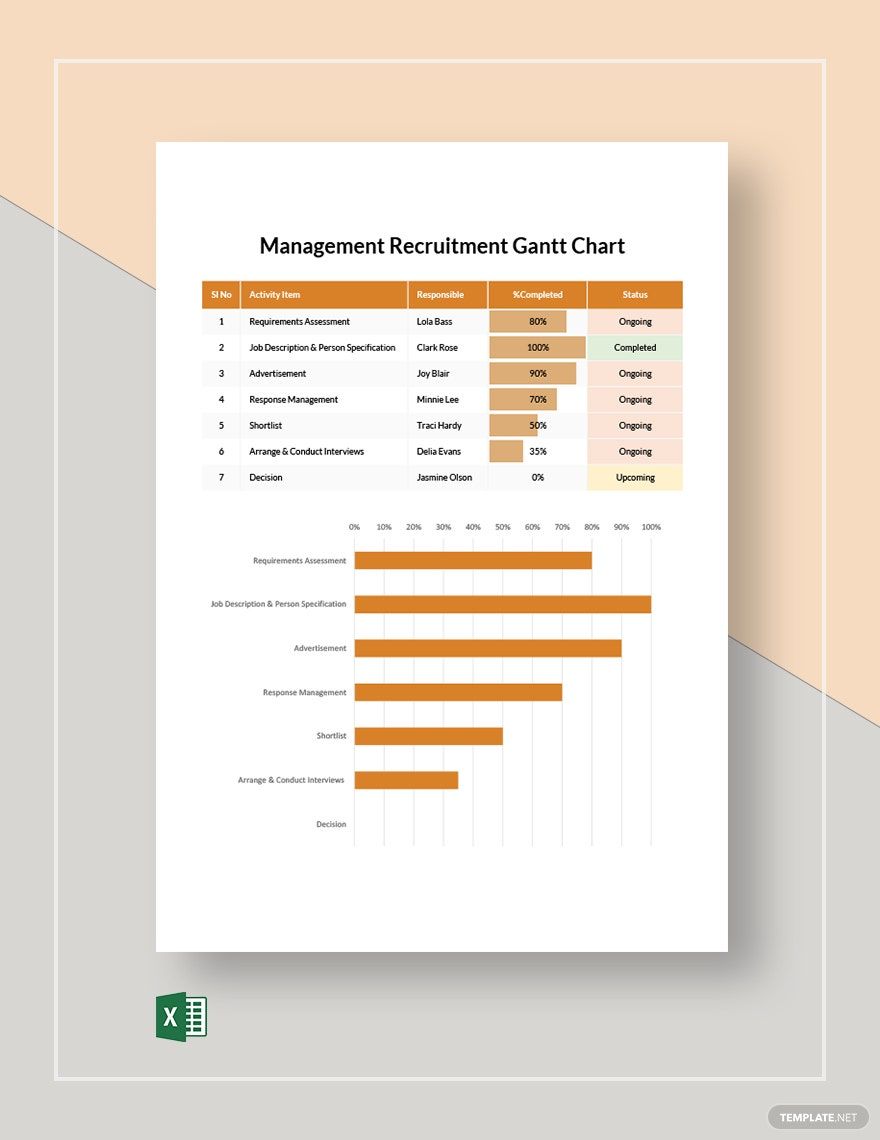
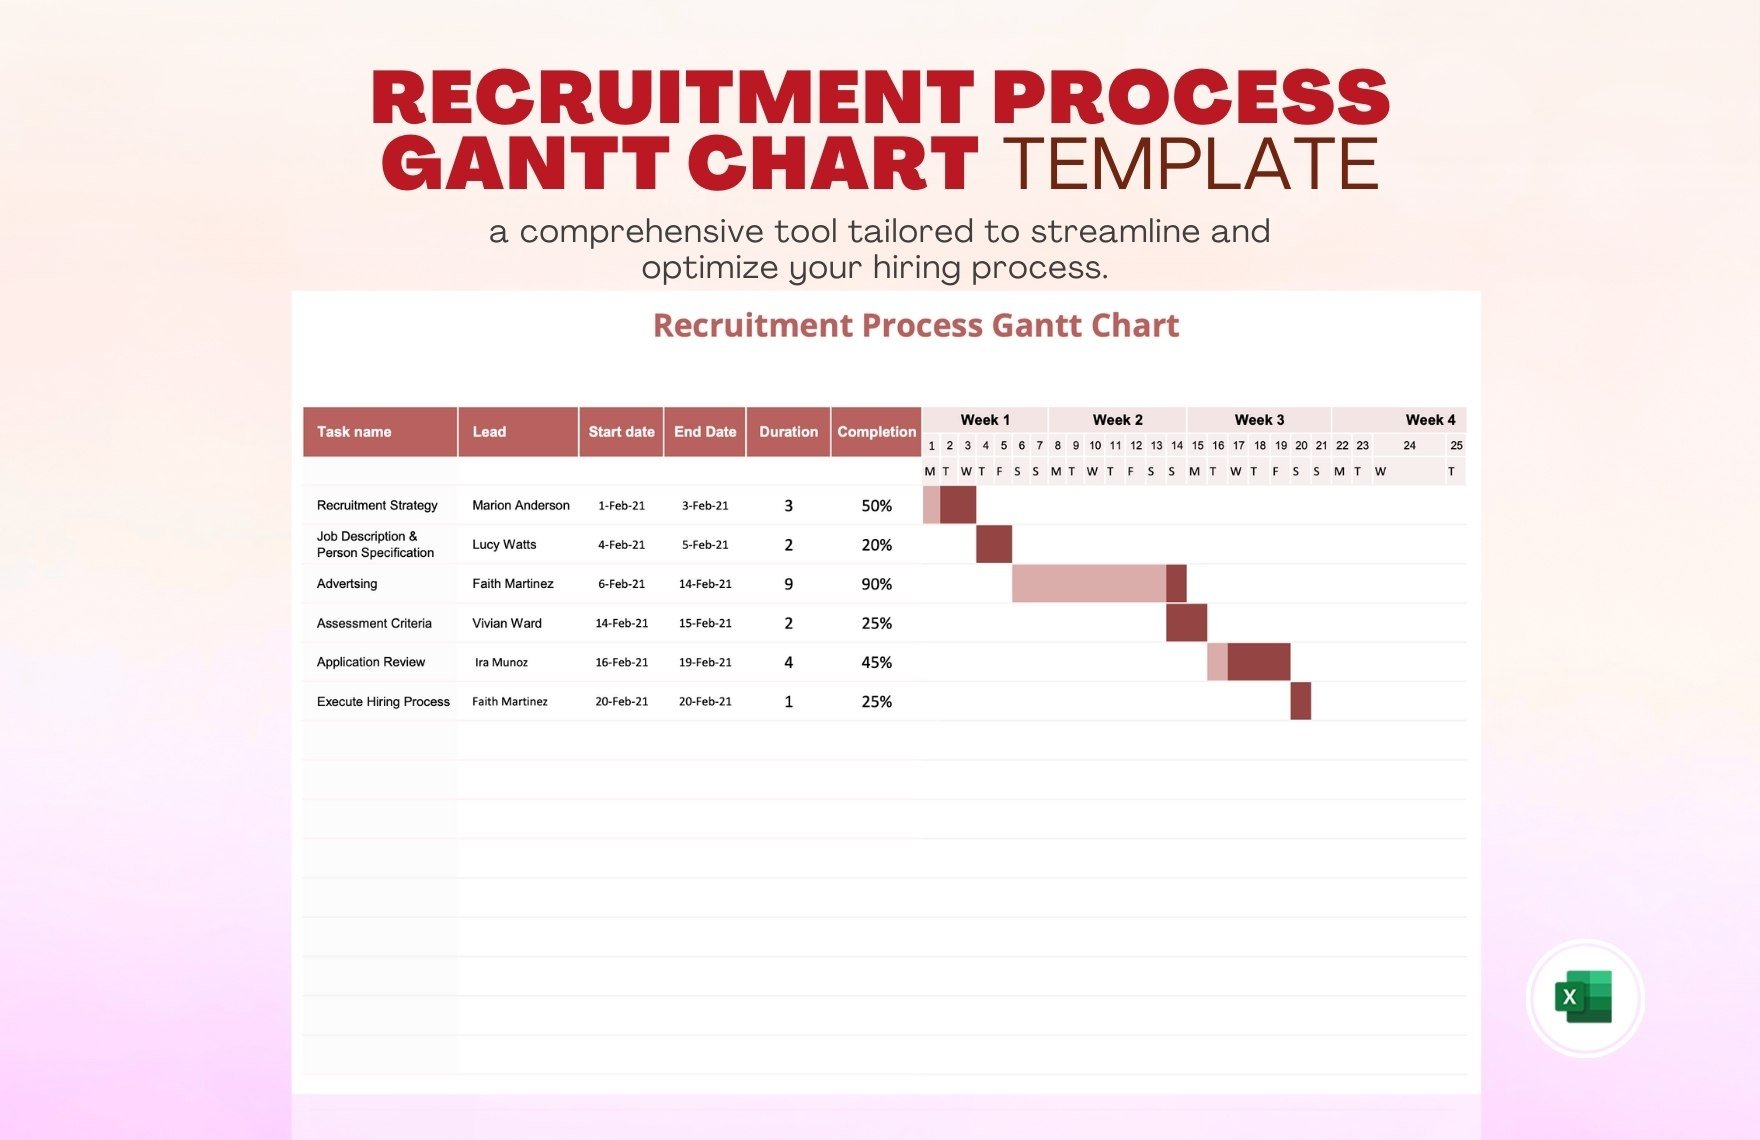
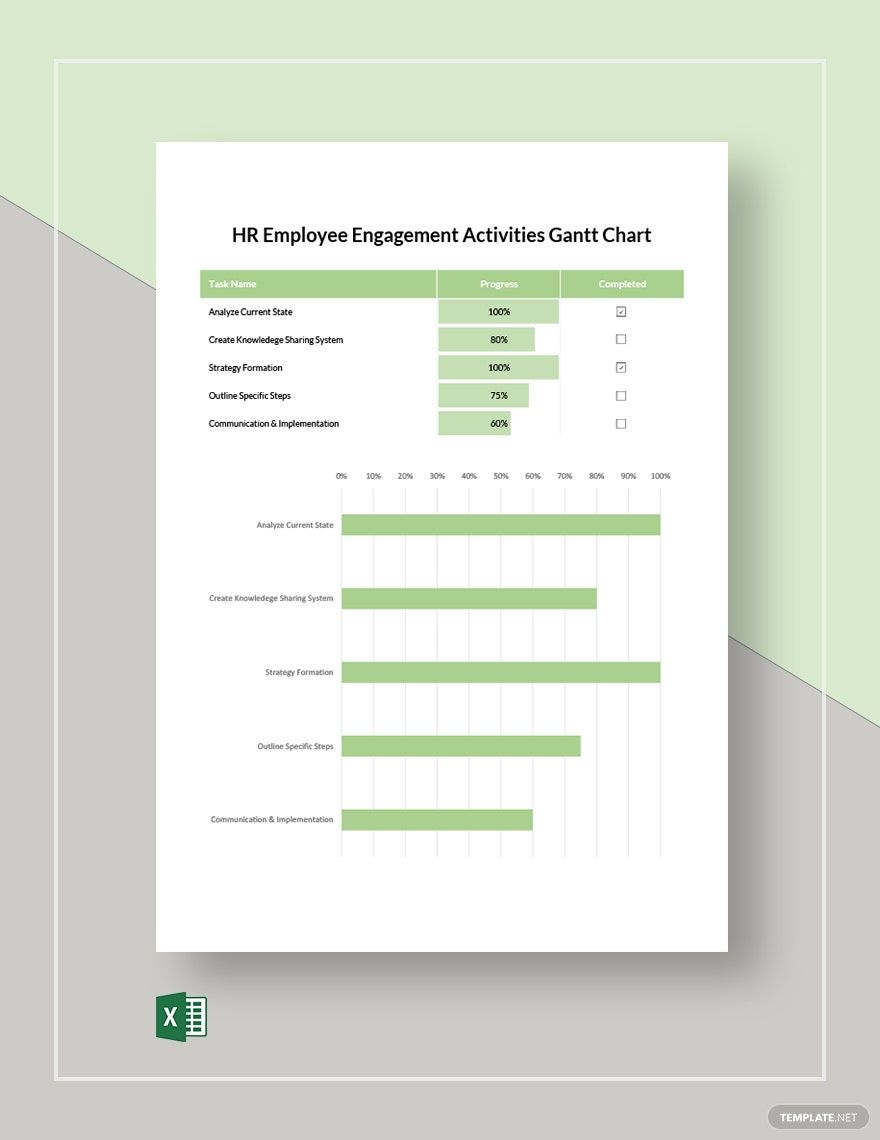
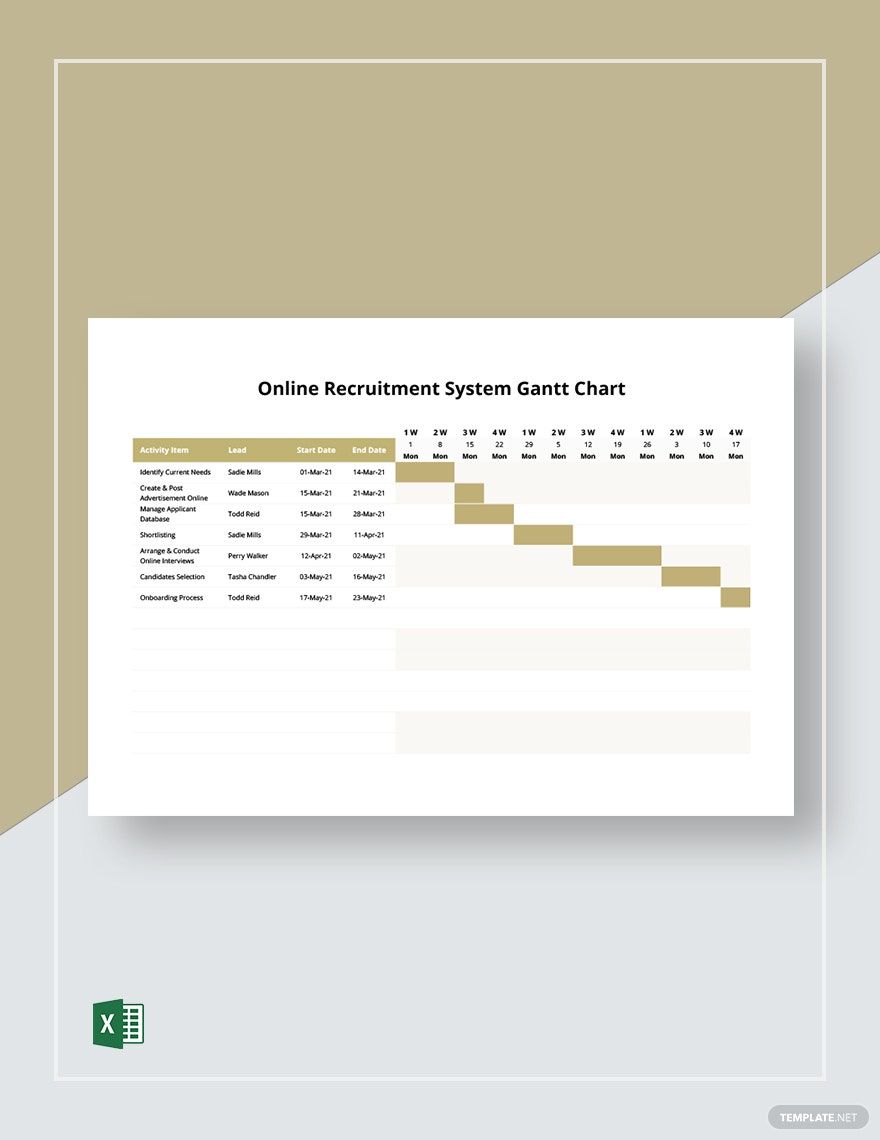
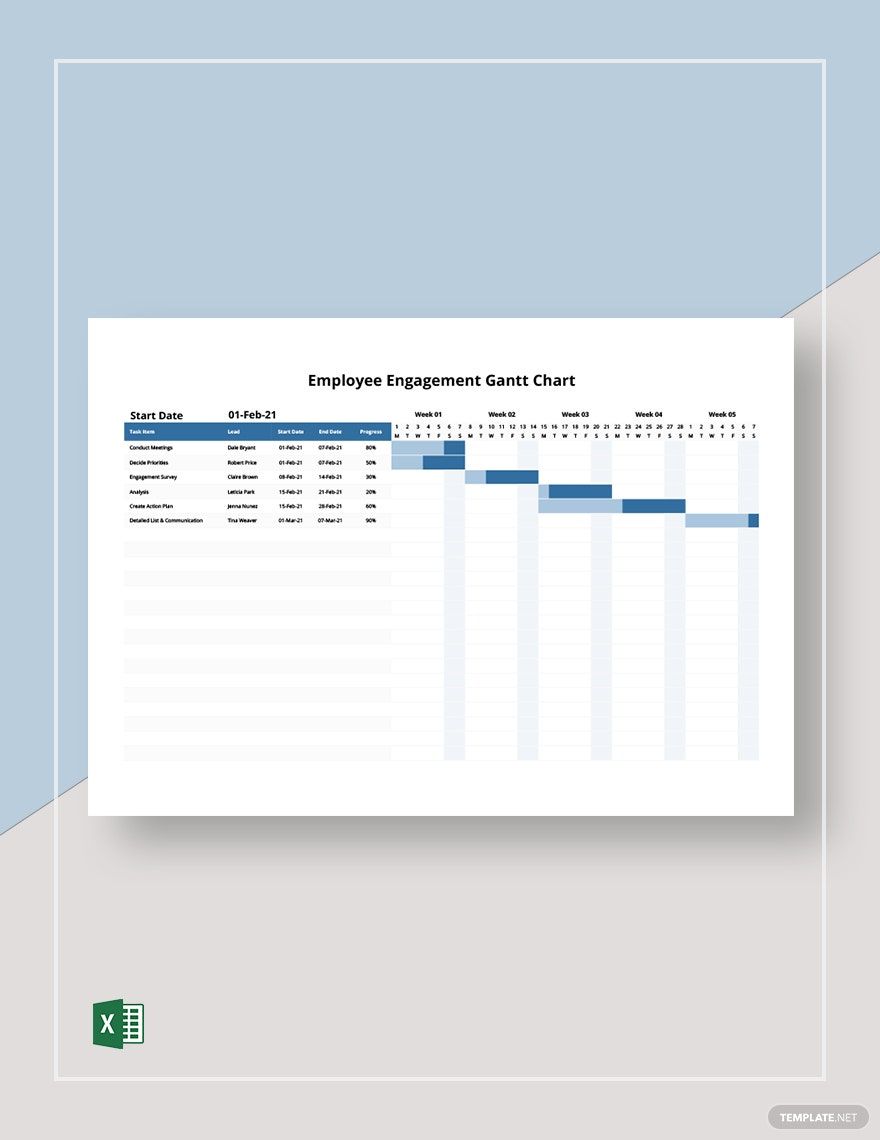
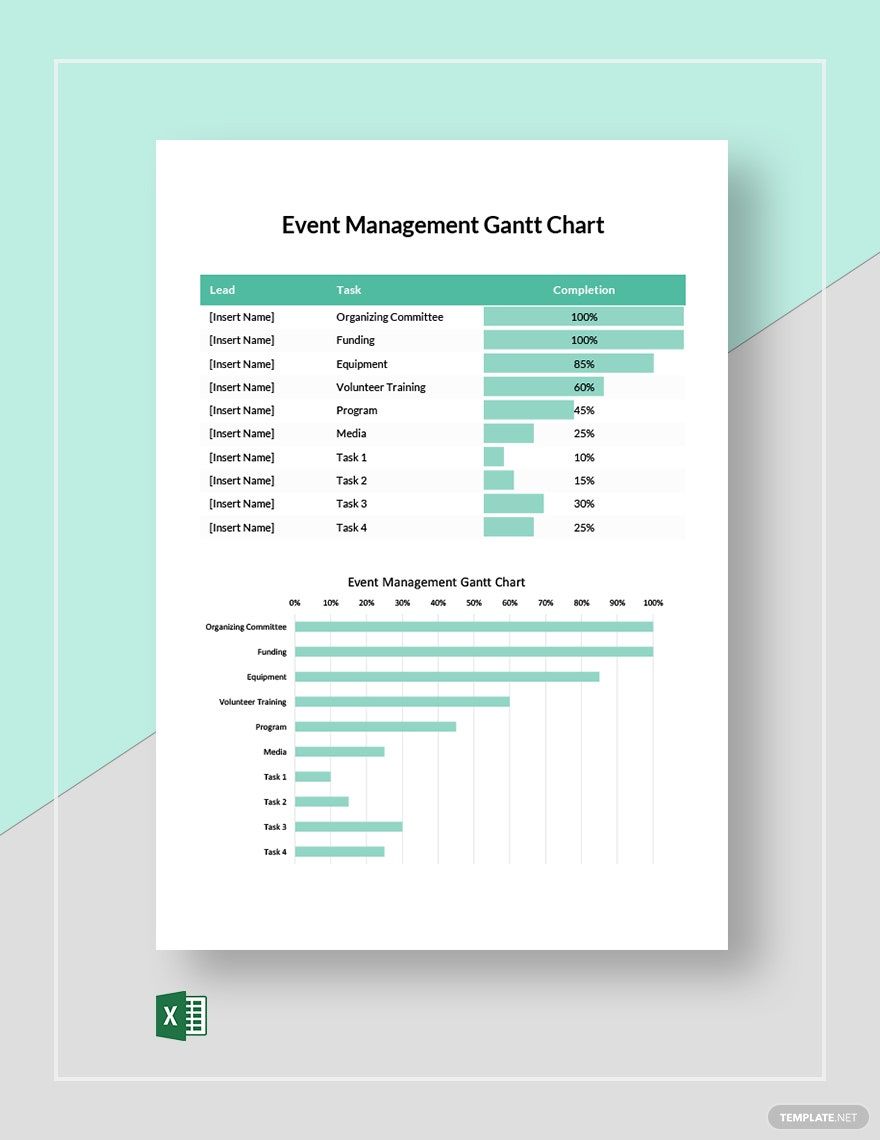
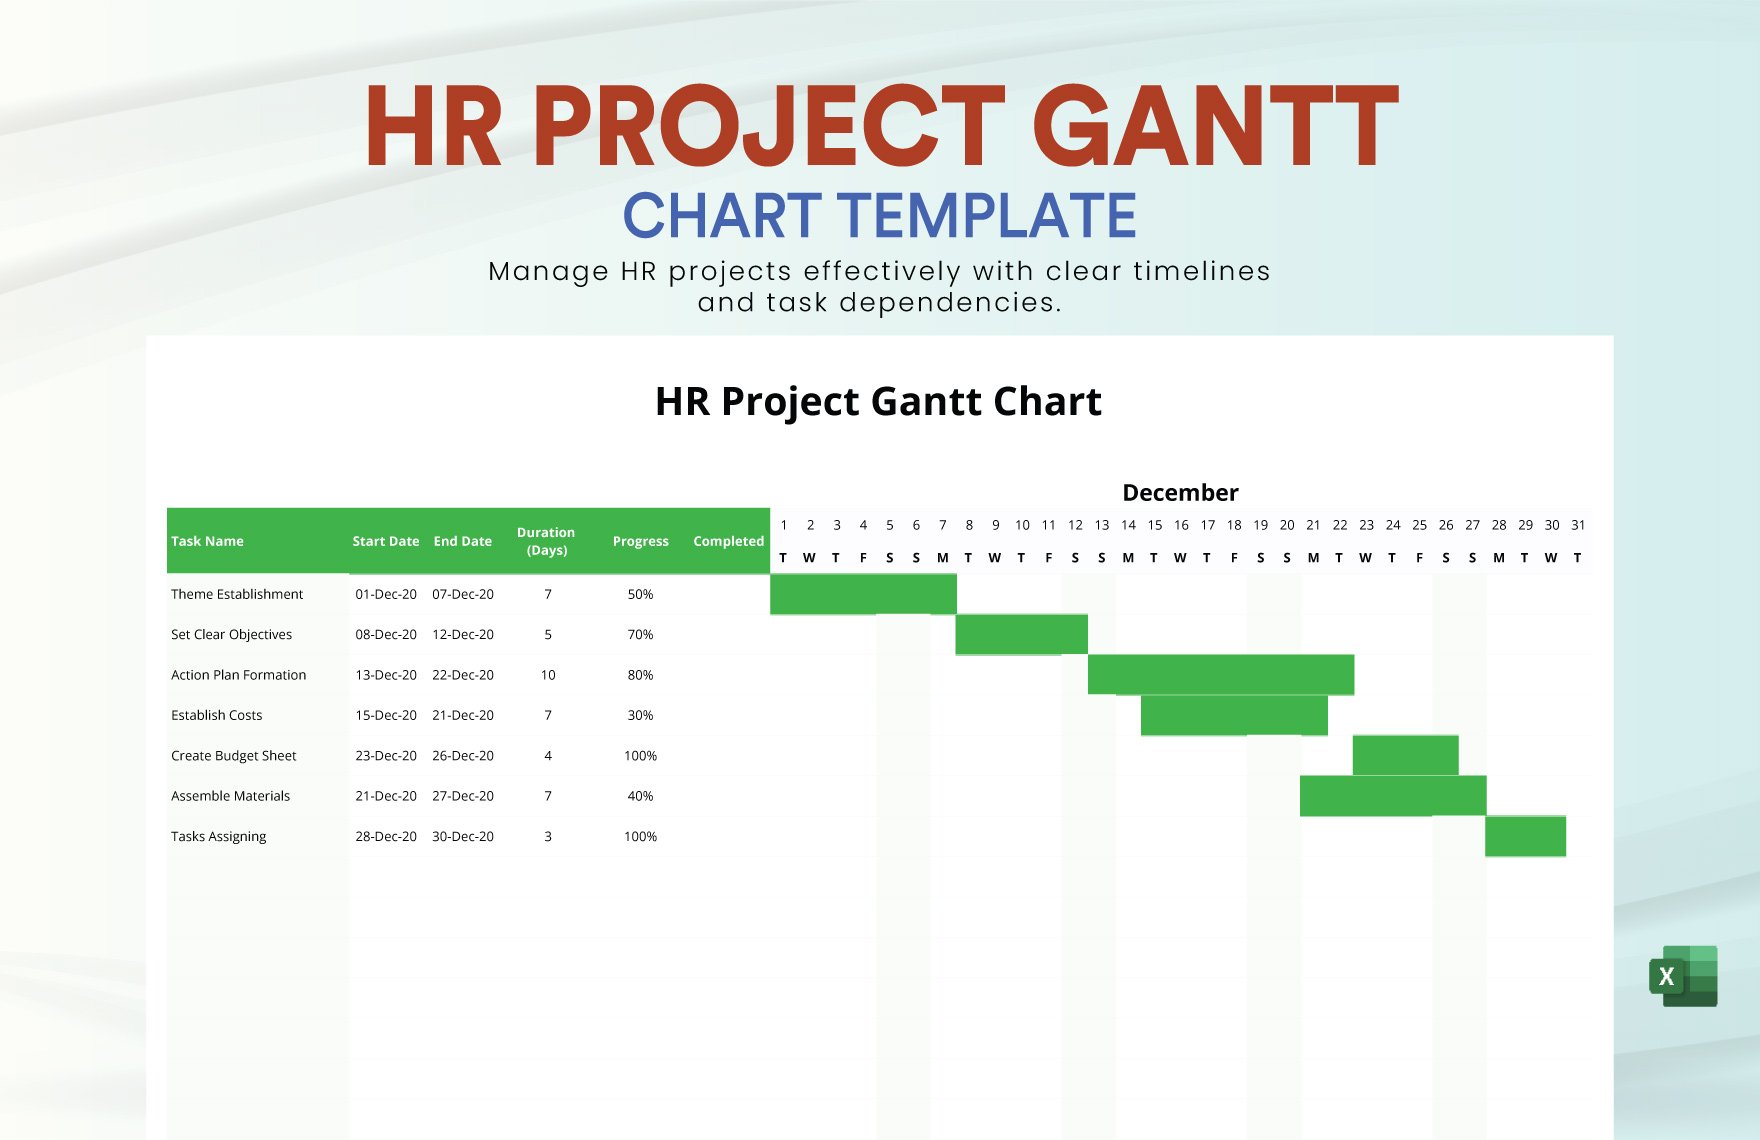
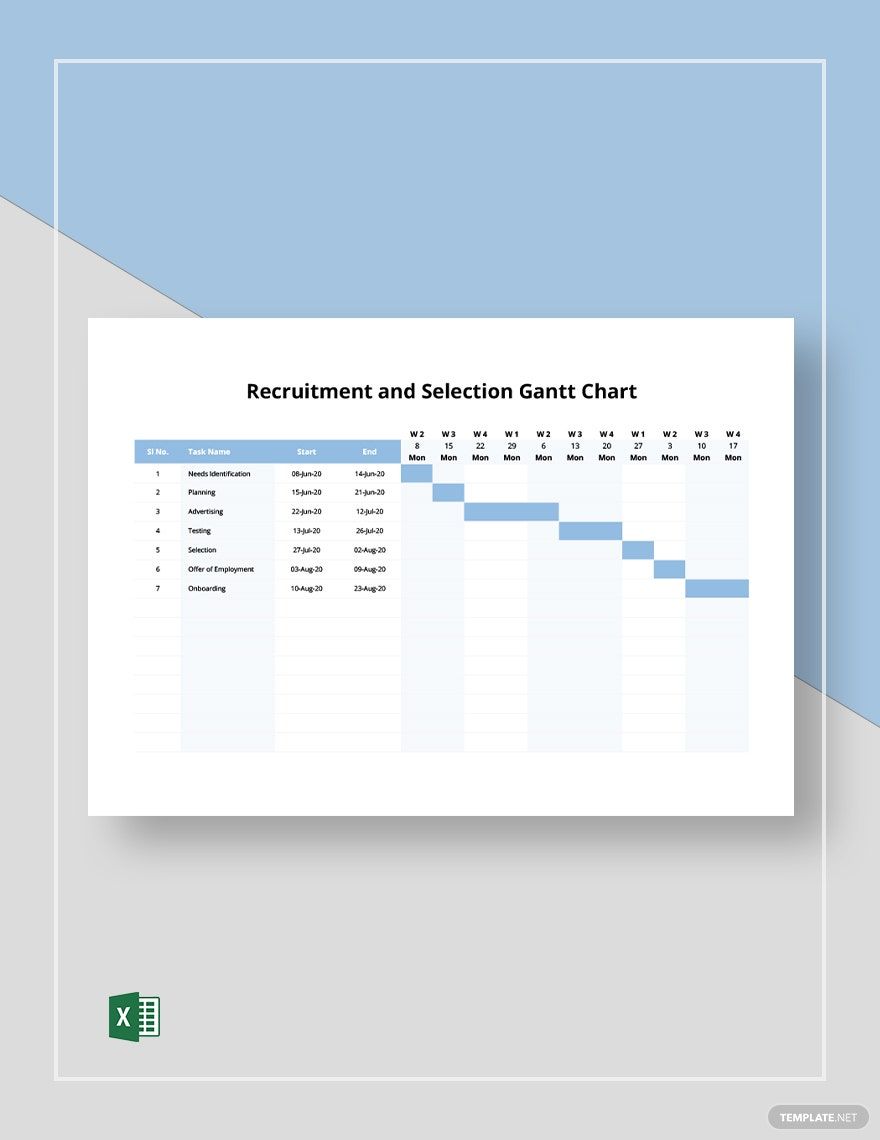
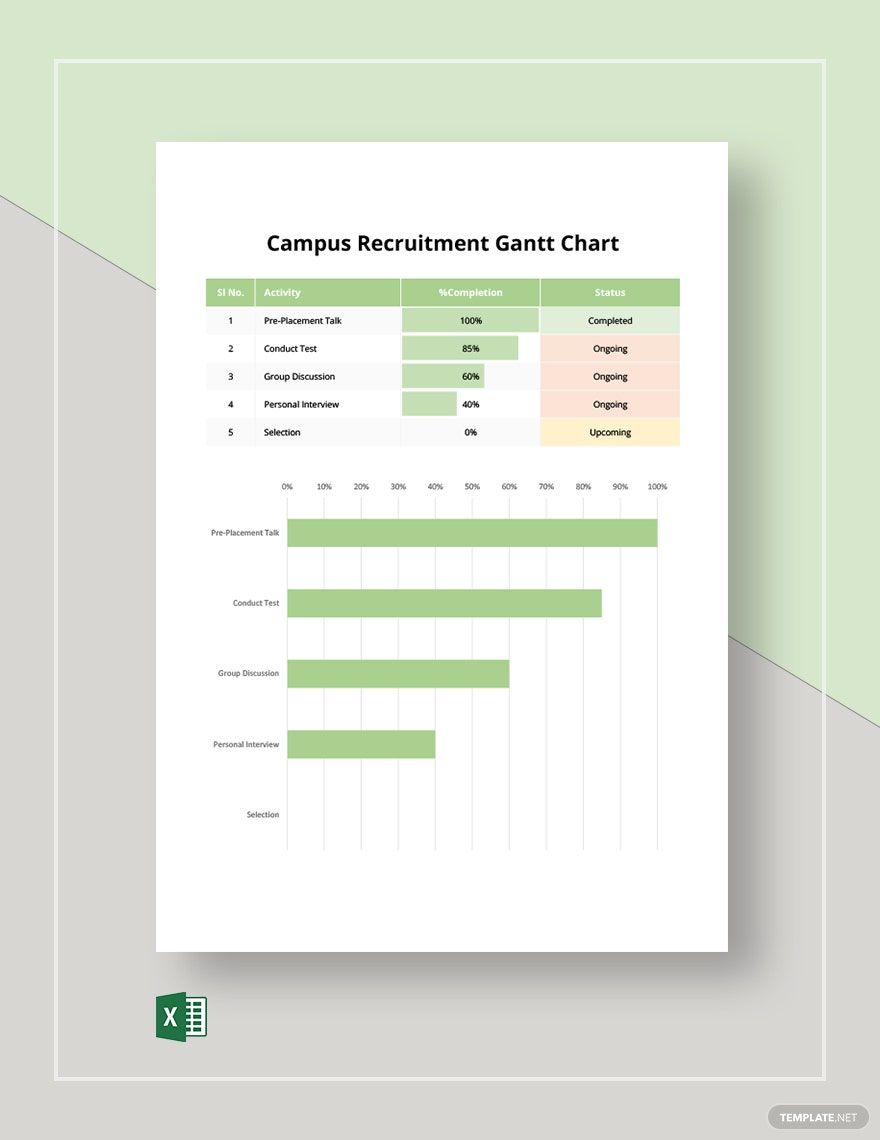
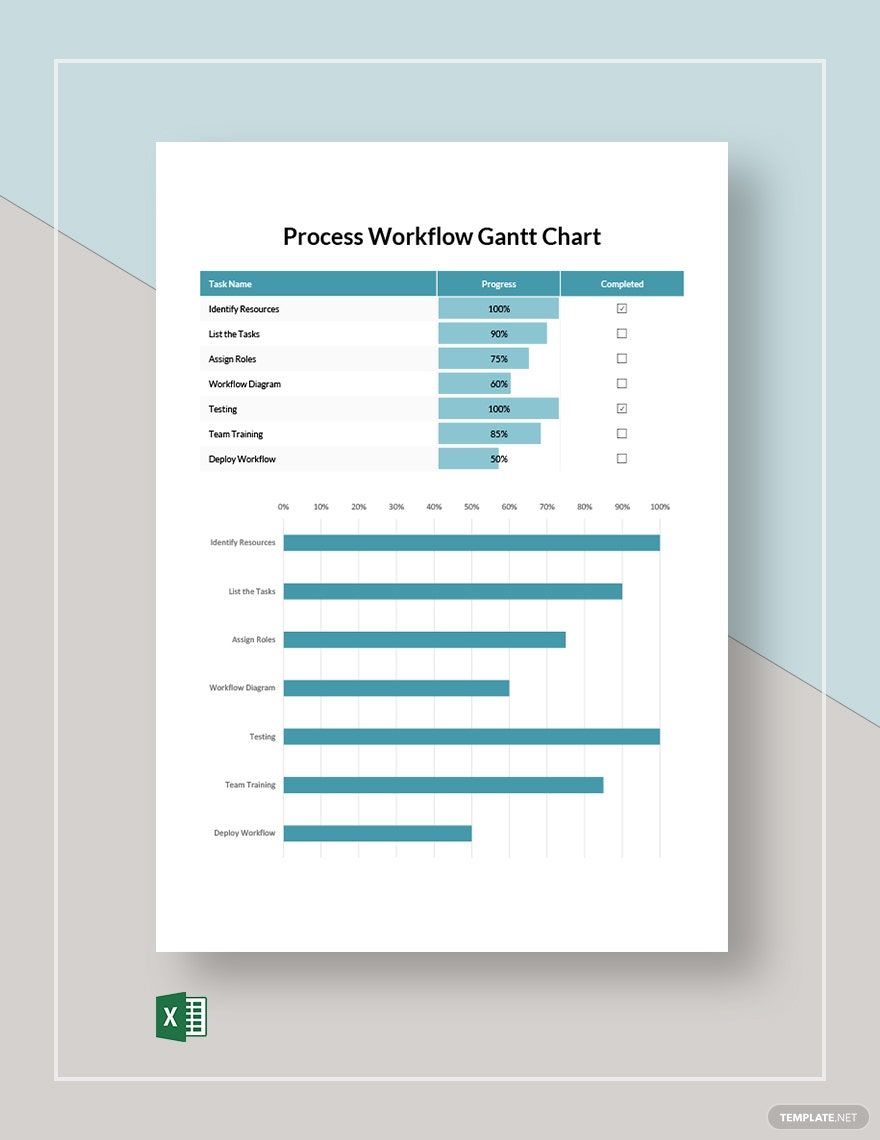
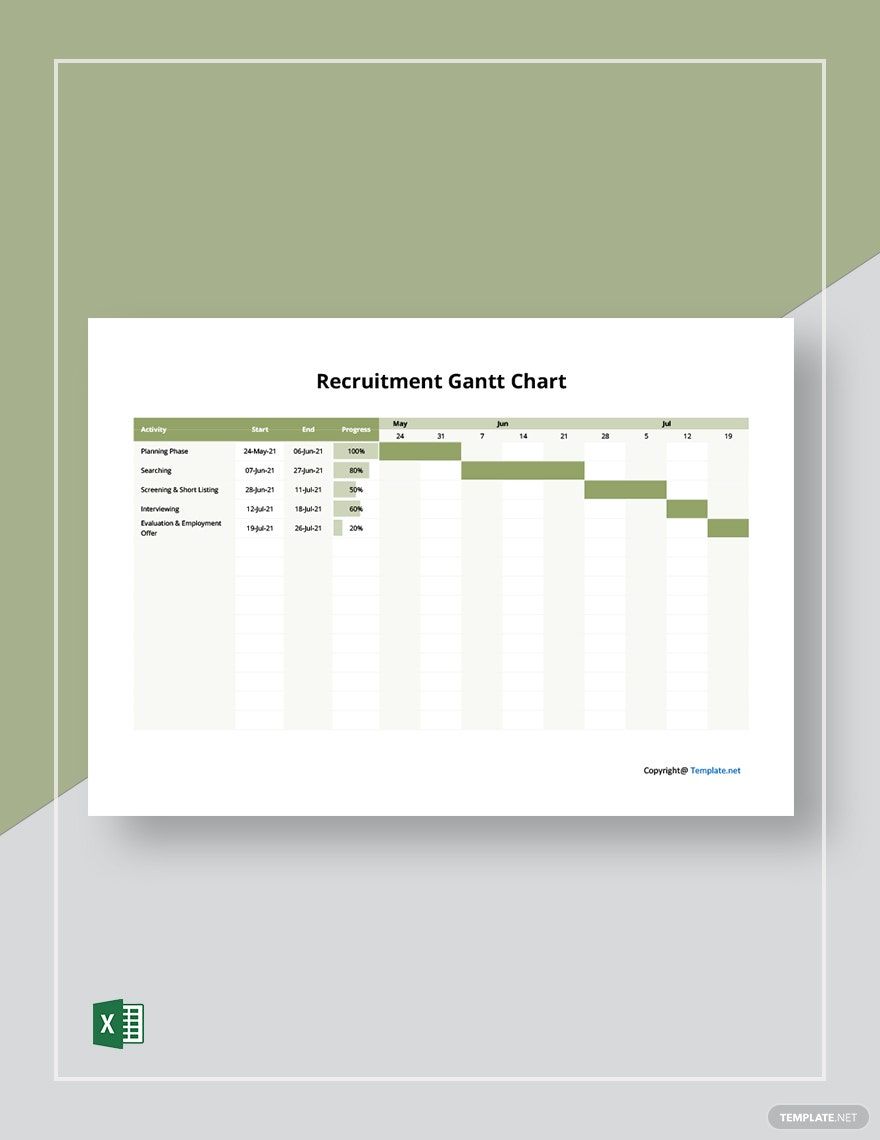
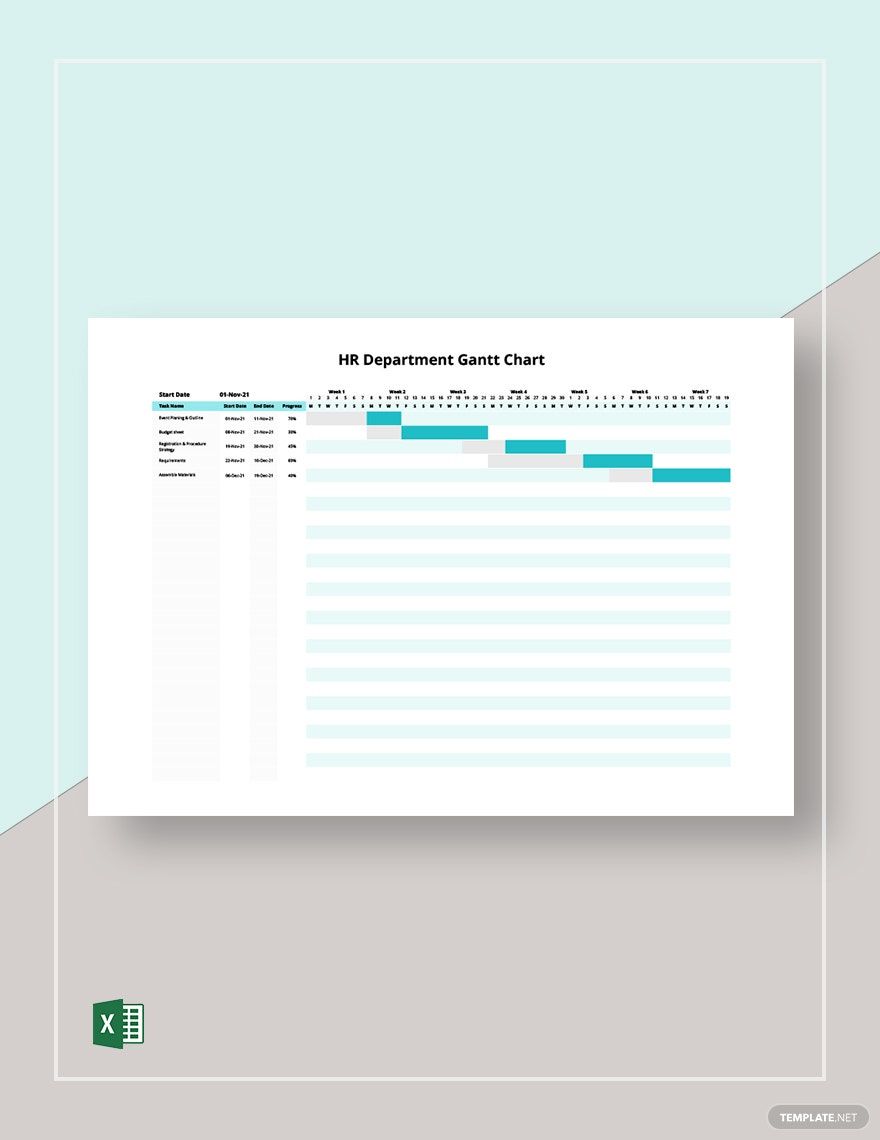
Does your business need to hire more staff workers? Do you plan on recruiting more members for your organization? A Gantt chart is an excellent tool for such an undertaking! Not only is a Gantt chart quick and easy to make, but its simplicity means anyone can use it with minimal explanation. Therefore, in order to help you set up your own diagram in a snap, we’re offering our professional Recruitment Gantt Chart Templates for you to download! With our easily editable content, you can create an effective chart using your desired processing software; you can even choose between A4 and US letter sizes. Don’t wait any longer and download now--handle data collection, appointment scheduling, and more with our 100% customizable samples!
How to Make a Recruitment Gantt Chart?
From timeline tracking to task scheduling, a Gantt timeline chart is an invaluable organizational tool when it comes to monitoring the progress of a recruitment project. As investopedia.com states it, a Gantt chart uses bars to observe the progress of each task’s completion within a project.
If you’re looking for some advice on how to design an effective workflow Gantt chart on your own, then feel free to read our comprehensive tips found below!
1. Put Together a Data Table
First off, you’ll need to start by making a data table--this will be one half of your recruitment and training Gantt chart. After opening a new document in your preferred application (like MS Excel, Google Sheets, and so on), insert a grid table that contains 3 columns; for the number of rows, it needs to match the number of tasks that your project has, plus an extra row for labeling.
2. Input Information Into Your Data Table
Now that you’ve set up a data table in your document, go ahead and label each column by using the top row--this is what the extra row is for. Name each column as Tasks, Task Starting Day, and Days to Complete. Next, add in the needed information about each task for your task Gantt chart, using the column labels as categories; for example, the name of each task goes under the Task column.
3. Insert Another Table
The next thing to do is insert another grid table to work on the 2nd half of your chart; position it either beside or underneath your data table. The number of rows should reflect how many tasks there are, while the number of columns mirrors the total number of days your team has to fulfill all of your recruitment tasks. Remember to add one extra row and one extra column, then use them to give each task and day (row and column) their appropriate labels.
4. Count the Number of Days
With both tables now ready, you can now use your schedule chart to manage and monitor how many days each task is taking to complete. Pick a color of your choice and use it to fill in the rows in your 2nd table, filling in each cell that represents a day within the allotted timeframe, creating a bar shape that expands to the right of the table.
Be sure to save the document in a convenient spot in your storage for easy access. Looking for simple chart designs to manage timelines, tasks, and more? Well, remember to have a gander at our Recruitment Gantt Chart Templates!
