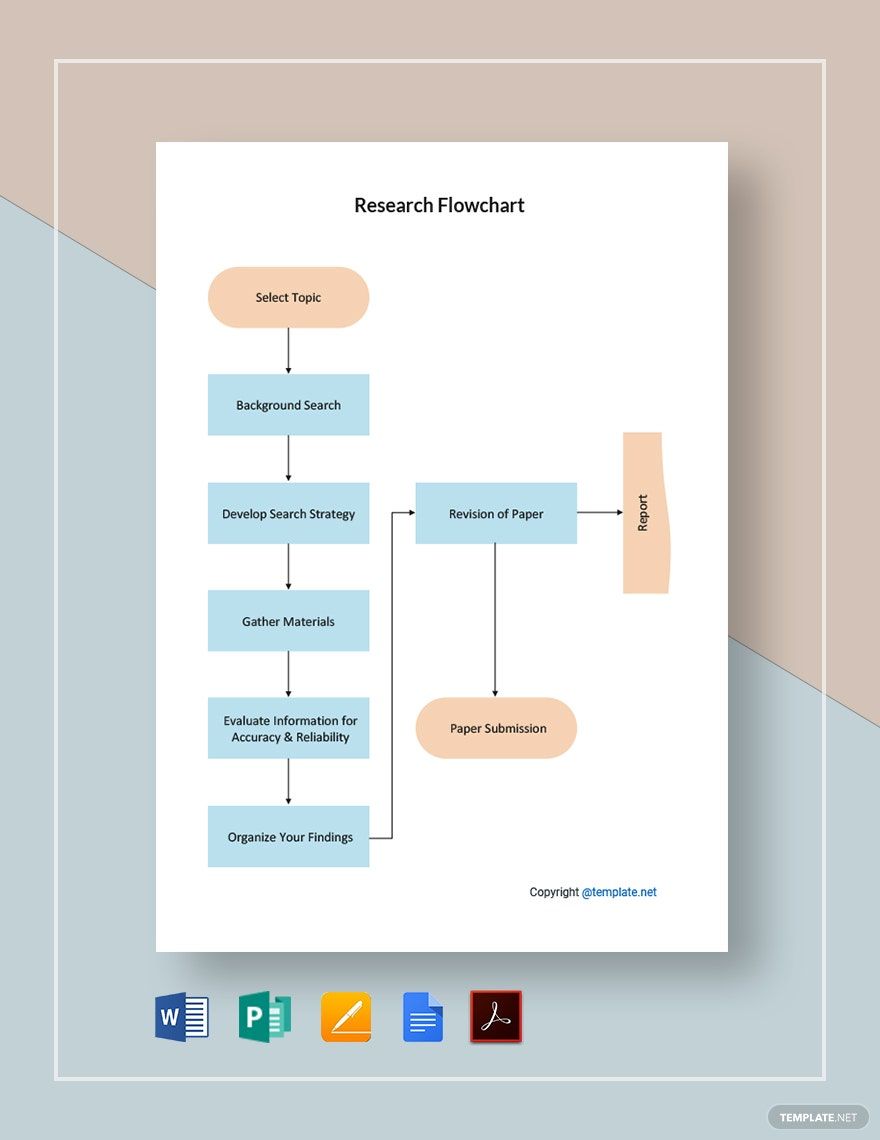
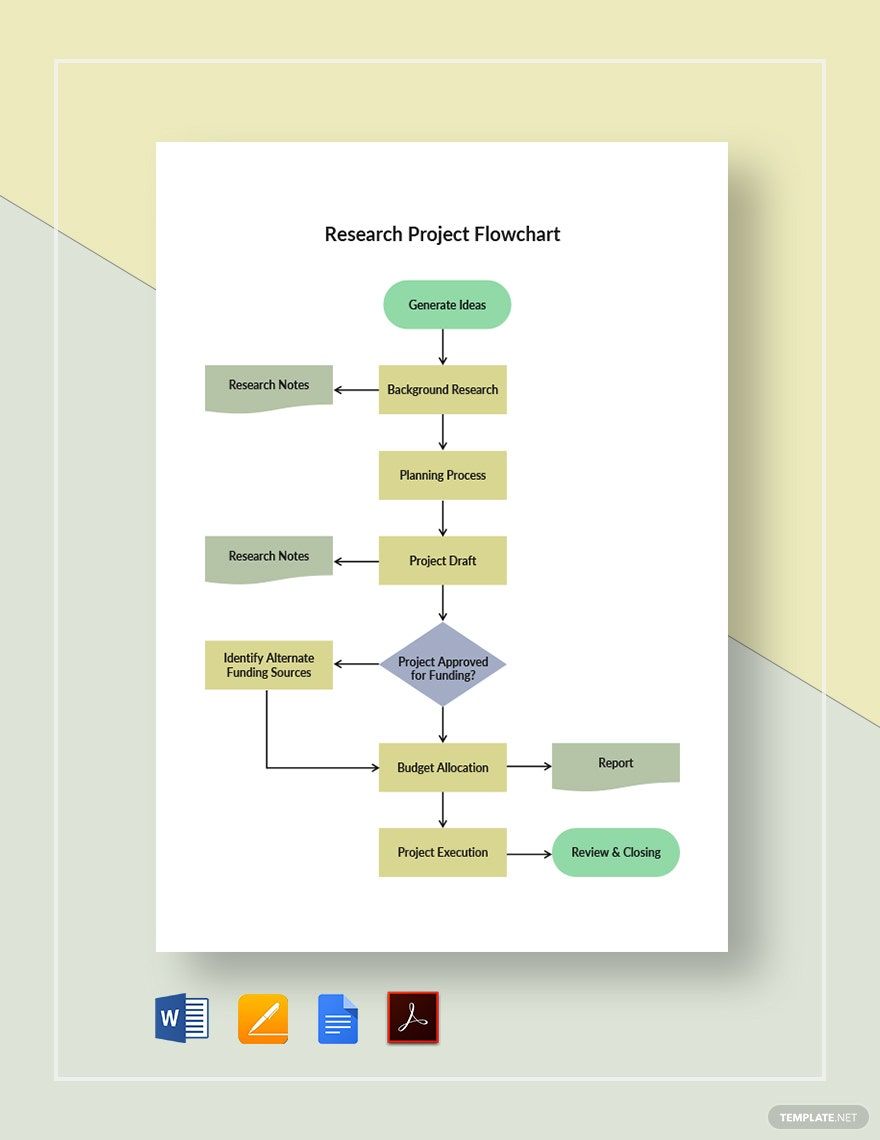
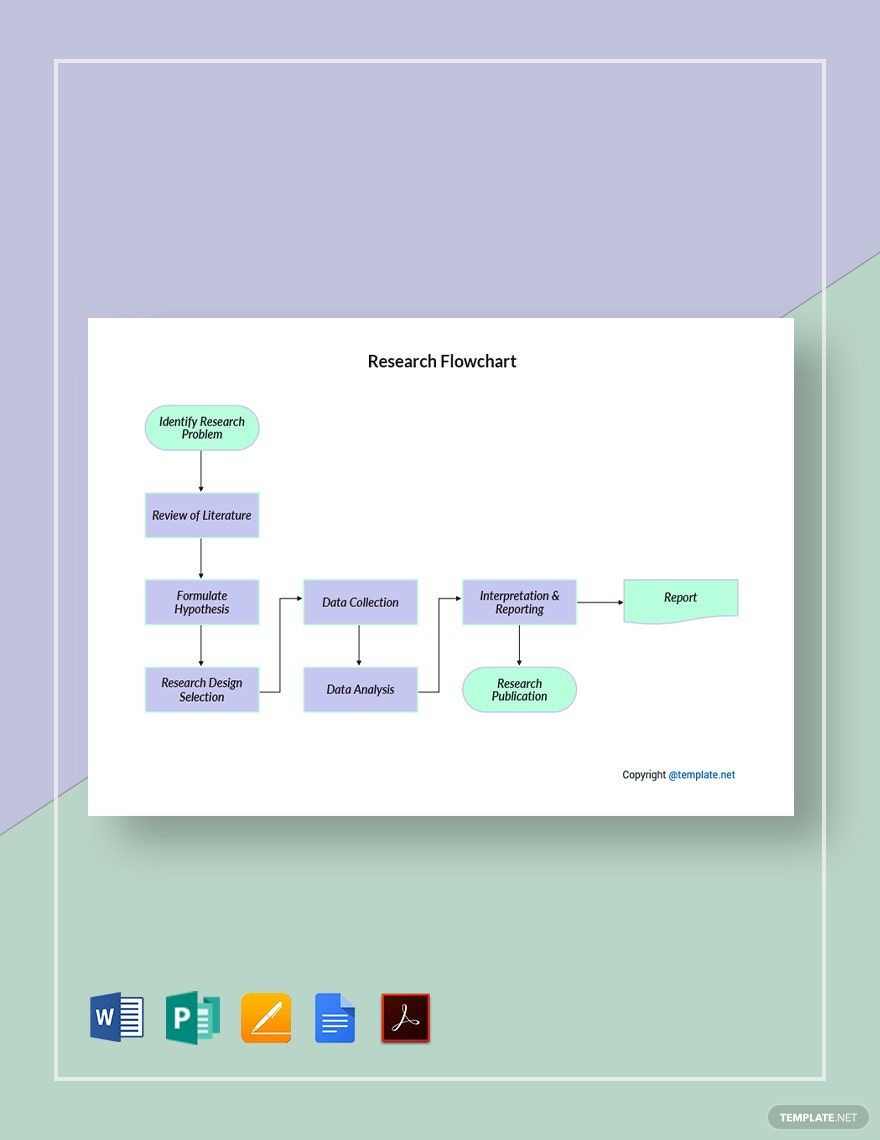
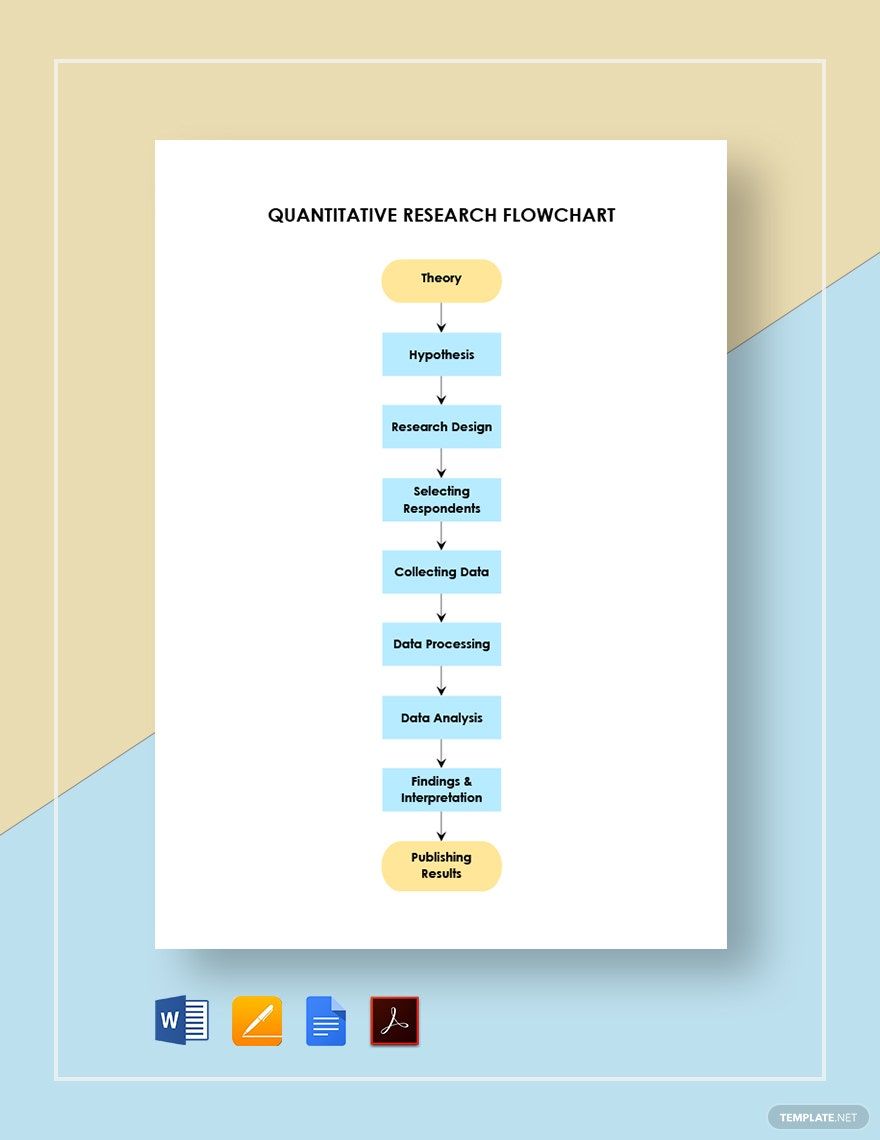
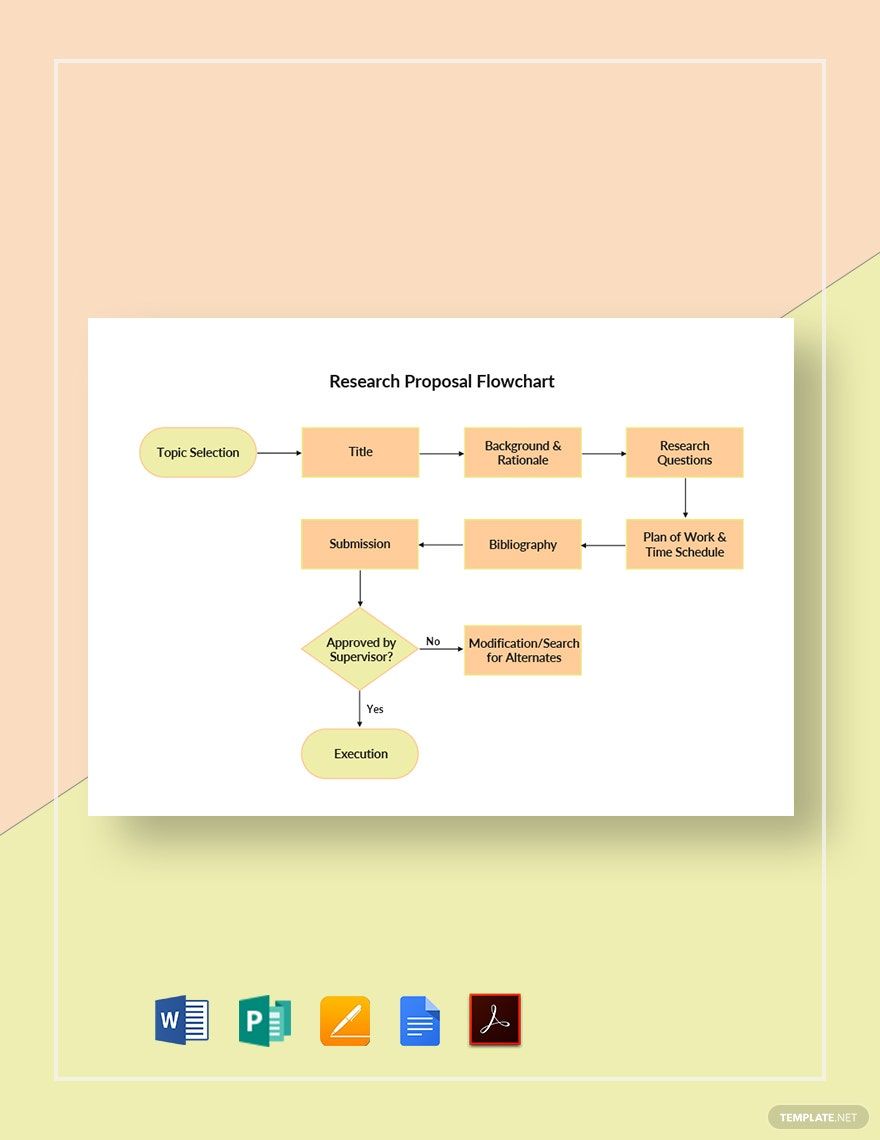
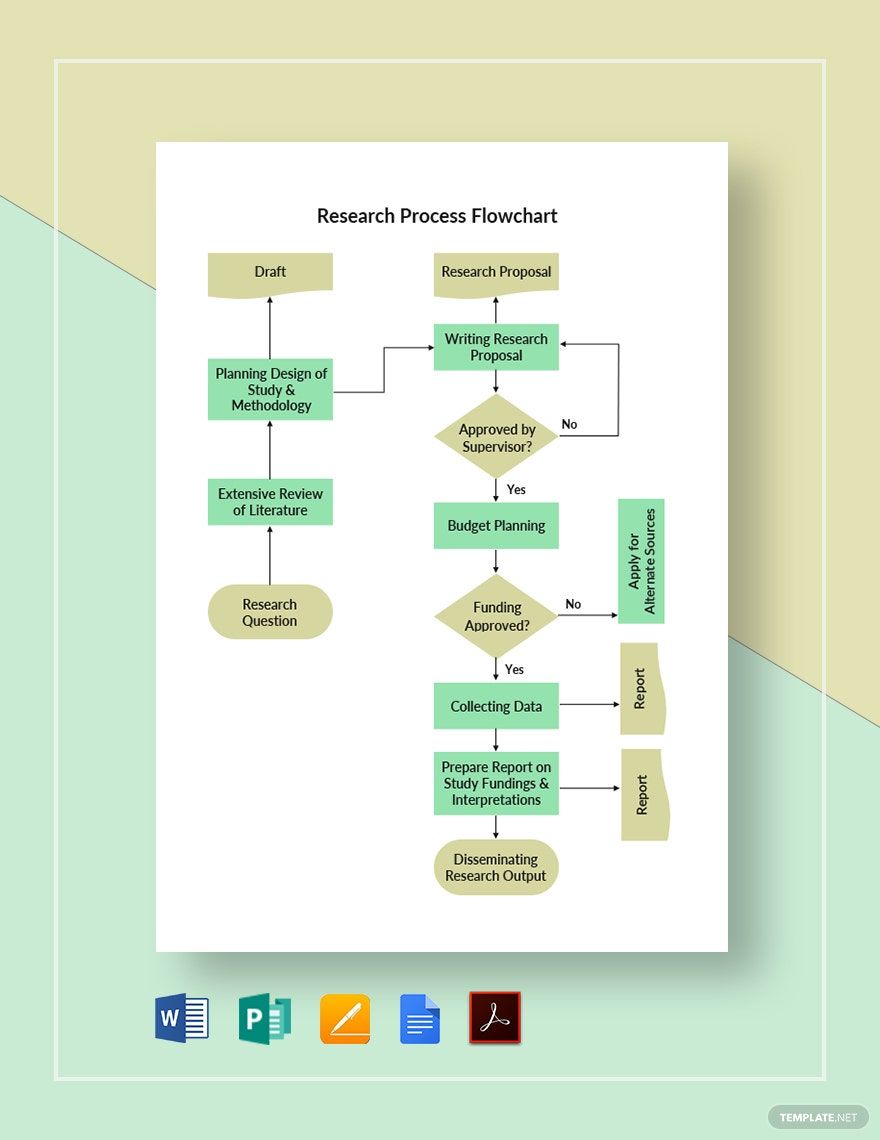
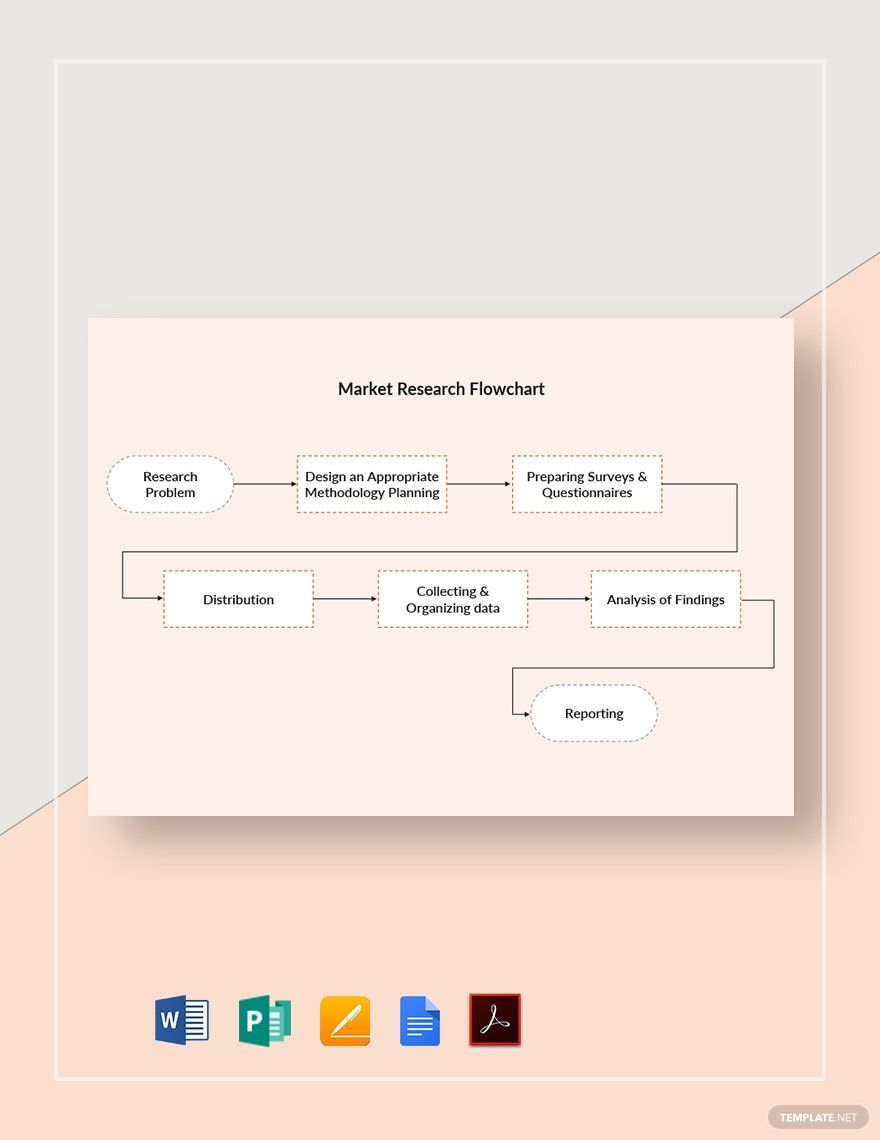
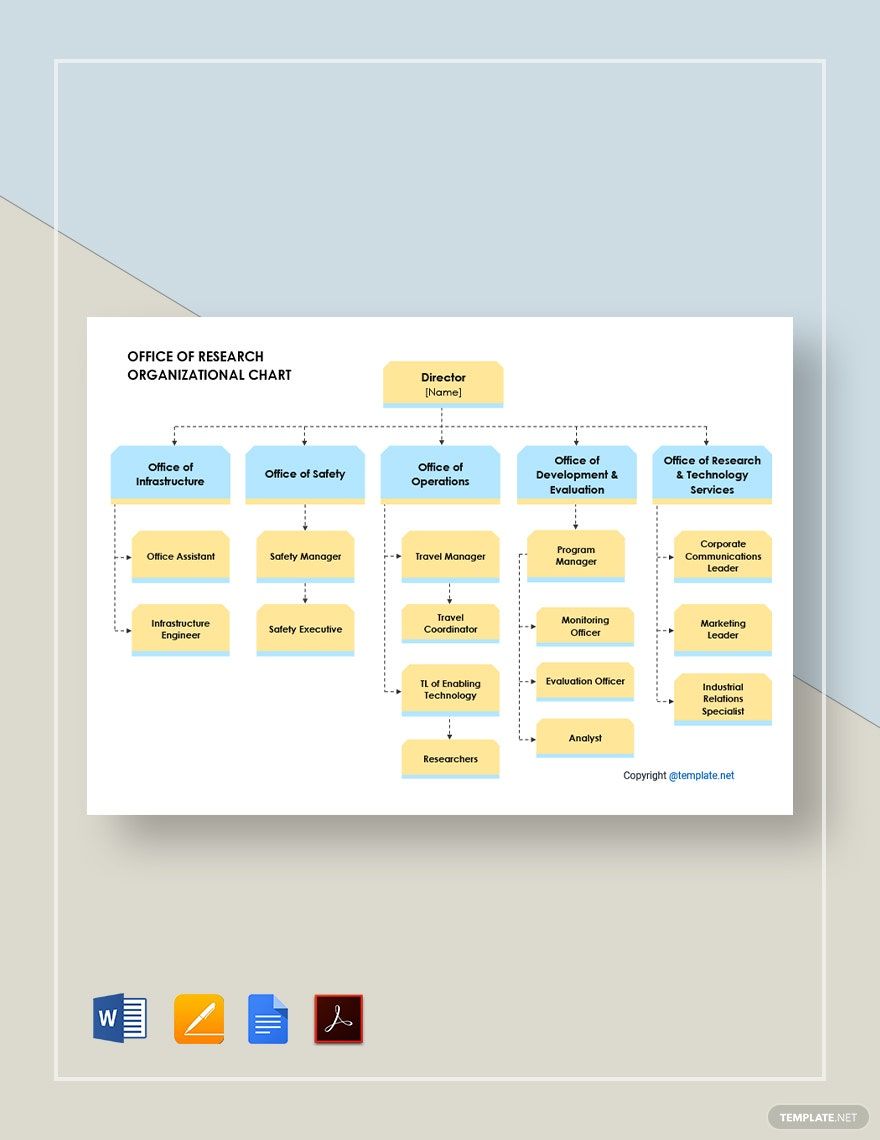
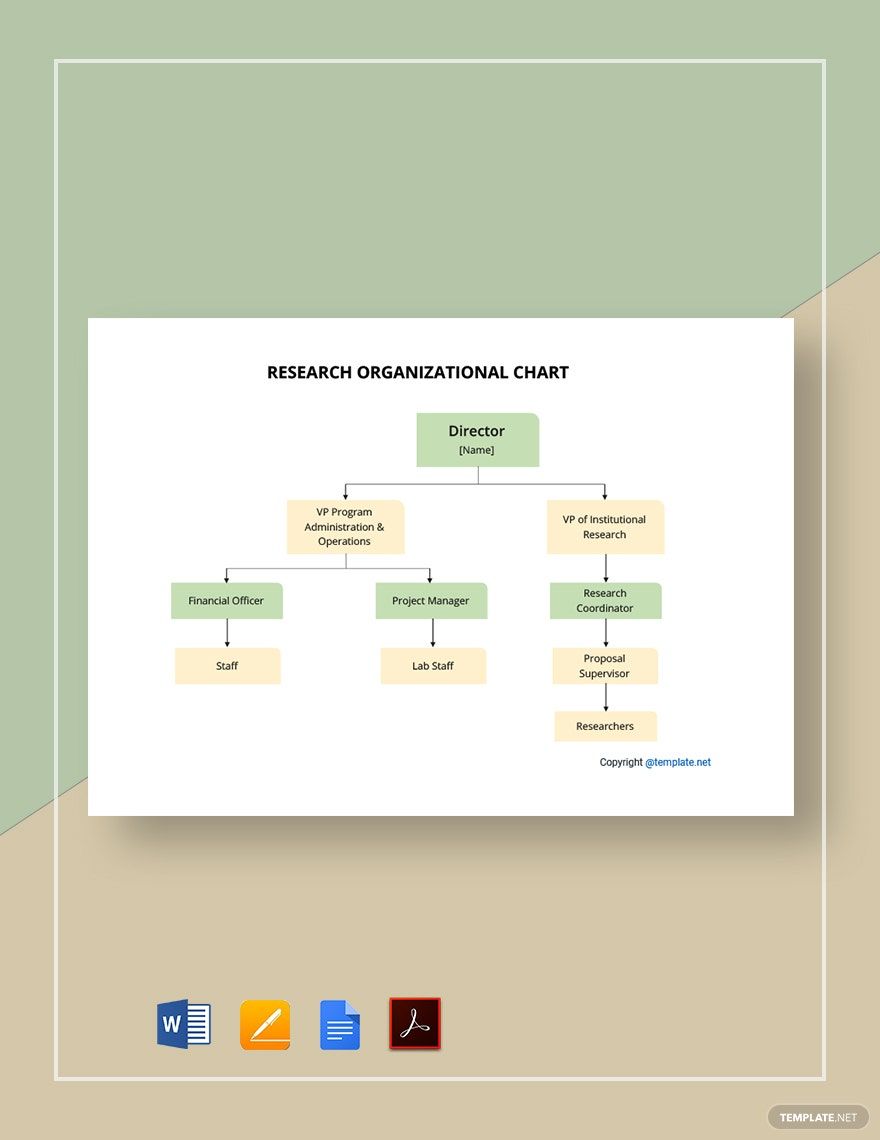
It’s always part of the human existence to have several questions in mind. Nurturing this curiosity would often lead to further investigation. The same goes for thesis studies and legal evaluations. Obtaining the right answers will require you to do researches. And to conduct the correct study, following a fully-established workflow structure is necessary. But don’t worry. Feel free to browse through our Ready-Made Research Flowchart Templates in Google Docs. You can print a copy of the template in A3, A4 and US Letter size. Now, acquire the right answer without a doubt. Supported with the appropriate data and resources, come up with a logical research paper. Download a template now!
How to Create a Research Flowchart in Google Docs
For every university, there is always a strict policy when it comes to the extraction of specific knowledge. Part of that is doing the process of research. From making a research proposal to deriving a coherent result from data collection, every detail must come together. According to the report released by Research America, a rising investment of $171 billion for medical research and development was recorded in 2016. This data explains that research is an inexpensive procedure. But even with the right amount of funds and still no further work process is done, this amount could easily fall to pieces.
So, how can you aid in this failure? Establish a plan. But pair it with appropriate actions. Do this by following the list of tips below on how you can create a Research Flowchart in Google Docs.
1. Establish a Goal to Achieve
Whether you are in the advertising or medical industry, research studies are always harder than you think it may be. It’s normal to get the frustrations. But that should never be considered at all. So, always start by establishing a goal. Here, you will need to create a list of your priorities. Upon doing so, indicate your weak points. It could either be in the introduction, methodology, or review of related literature. Knowing this helps you come up with the actions to do.
2. Come Up with the Tasks to Accomplish
Given that you already have objectives, determine how you will achieve these. With that, come up with a list of actions that correlate well with your goals. Then, draft all of them in the proper sequence. This provides you the benefit of keeping an eye on your target. Other than that, this provides you the convenience in mapping out the process to complete your chart.
3. Make It Clear with a Flowchart Template
It’s not always enough to depend on a draft. What’s necessary is to get everything in a more appropriate representation. To do this, give enough time to develop a workflow structure. Using Google Docs, you will have the freedom to create shapes or boxes. The directional flow depends on your layout. So, choose whether you want it horizontal or vertical. Either way, make sure that each shape is connected accordingly. From top to bottom, use line connectors. This allows the readers to know the flow. In each box, provide the label. Make sure to follow brevity and conciseness. Don’t settle on lengthy descriptions. Make it easier to use. This gets the job done instantly.
But will this take time? If this is time-consuming for you, have a look at pre-made layouts you can use. Our website helps you select the right structure for your diagram flow through our Research Flowchart Templates. Adjustments become less of a hassle.
4. Finalize, Review and Perform
Avoid doing tasks that are irrelevant and disarranged. Achieve this by reviewing the whole output. Check if a simple chart guarantees to do good in your case study. If not, then it’s necessary to review everything beforehand. Save a copy. Send them over to your team. Work on a research paper successfully!
