Get Access to World’s largest Template Library & Tools

How to Find R in Microsoft Excel

Microsoft Excel allows you to find the correlation coefficient, commonly represented as R, to analyze the strength and direction of relationships between variables. Understanding how to calculate R in Excel will significantly improve your data analysis capabilities and insights.
How to Find R in Microsoft Excel


Finding the correlation coefficient, R, in Microsoft Excel is crucial for analyzing relationships. Follow these steps to calculate R efficiently and accurately:

  • Step 1. Prepare Your Data

    Ensure that your data is organized in two columns, with each column representing one of the variables you want to analyze. Label the columns appropriately for clarity in your sheet.

  • Step 2. Select an Empty Cell

    Click on an empty cell where you want the result of the correlation coefficient to be displayed. This will be the cell where Excel calculates the value of R.

  • Step 3. Enter the CORREL Function

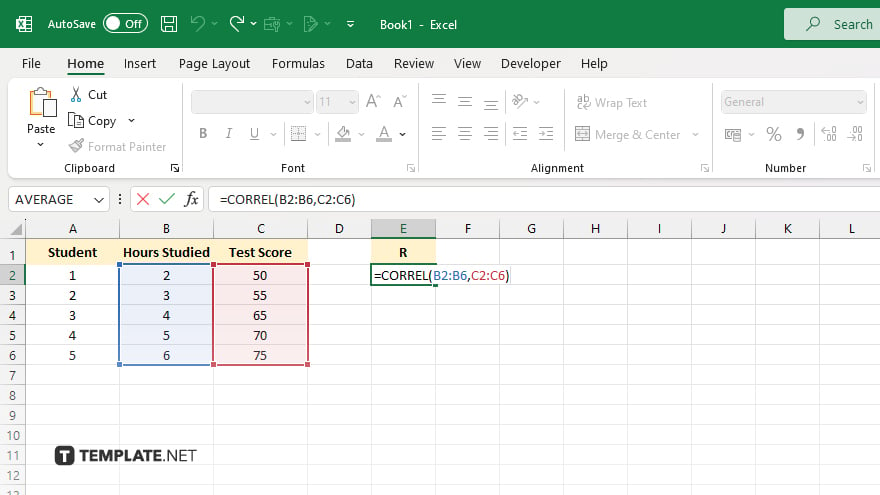
    step 3 enter the correl function

    Type the formula “=CORREL(array1, array2)” into the selected cell. Replace “array1” with the range of cells for the first variable and “array2” with the range of cells for the second variable. For example, apply “=CORREL(A1:A10, B1:B10).”

  • Step 4. Press ‘Enter’ to Calculate

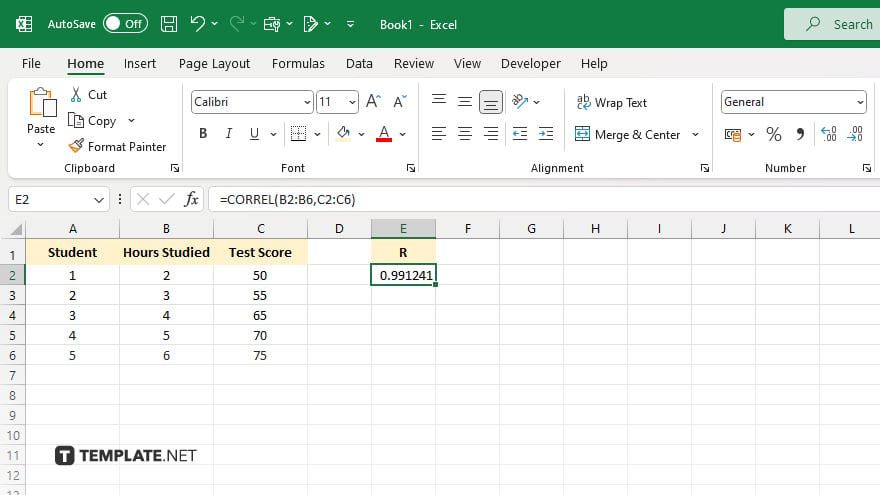
    step 4 press enter to calculate

    Press “Enter” to execute the formula in your worksheet. Excel will calculate the correlation coefficient, R, and display it in the selected cell.

  • Step 5. Interpret the Result

    Review the calculated value of R to understand the strength and direction of the relationship between the variables. A value close to 1 or -1 indicates a strong correlation, while a value near 0 suggests a weak or no correlation.

You may also find valuable insights in the following articles offering tips for Microsoft Excel:

note iconNote

Unlock Your Productivity with Over 100,000 Microsoft Excel Templates! Exclusively Available at Template.net – Download Now and Transform Your Data Handling Experience!

FAQs

How do I find the correlation coefficient (R) in Excel?

Use the CORREL function with the ranges of your two variables, like “=CORREL(A1:A10, B1:B10).”

What does the correlation coefficient (R) indicate?

R indicates the strength and direction of the relationship between two variables, with values close to 1 or -1 signifying a strong correlation.

Can I find R for non-numeric data in Excel?

No, the CORREL function requires numeric data to calculate the correlation coefficient.

Is there a way to visually represent the correlation in Excel?

Yes, you can create a scatter plot to visually represent the relationship between the two variables.

Can I use the CORREL function for more than two variables?

No, the CORREL function is designed for analyzing the relationship between two variables at a time.

More in Excel

How to Freeze a Line in Microsoft ExcelHow to Create If Then in Microsoft Excel
How to Add Text in Microsoft ExcelHow to Return to Normal View in Microsoft Excel
How to Add Secondary X-Axis in Microsoft ExcelHow to Export Google Calendar to Microsoft Excel
How to Calculate R Squared in Microsoft ExcelHow to Select 2 Columns in Microsoft Excel
How to Go to the Next Line in Microsoft Excel CellHow to Insert a Blank Row in Microsoft Excel
How to Format a Microsoft Excel SpreadsheetHow to Do a Multiplication Formula in Microsoft Excel
How to Email an Excel DocumentHow to See Edit History in Microsoft Excel
How to Color Rows in Microsoft ExcelHow to Average Time in Microsoft Excel
How to Add a Header and Footer in Microsoft ExcelHow to Create a Monthly Calendar in Microsoft Excel
How to Lock an Excel Workbook from EditingHow to Custom Sort in Microsoft Excel
How to Do a Waterfall Chart in Microsoft ExcelHow to Remove Line Breaks in Microsoft Excel
How to Unlock Arrow Keys in Microsoft ExcelHow to Create a Monthly Budget in Microsoft Excel
How to Find the Probability in Microsoft ExcelHow to Get Solver in Microsoft Excel
How to Edit a Cell in Microsoft ExcelHow to Pin Columns in Microsoft Excel
How to Remove Scientific Notation in Microsoft ExcelHow to Turn Off Compatibility Mode in Microsoft Excel
How to Edit an Excel SpreadsheetHow to Change Formulas to Values in Microsoft Excel
How to Create a Mailing List in Microsoft ExcelHow to Write Formulas in Microsoft Excel
How to Link a PDF in Microsoft ExcelHow to Add a Comma in Microsoft Excel
How to Create a Project Timeline in Microsoft ExcelHow to Sum Filtered Cells in Microsoft Excel
How to Do a Sum in Microsoft ExcelHow to Combine Data in Two Columns in Microsoft Excel
How to Download a Microsoft Excel SpreadsheetHow to Create Sequential Numbers in Microsoft Excel
How to Edit Named Ranges in Microsoft ExcelHow to Rearrange Rows in Microsoft Excel
How to Make a Graph Using Microsoft ExcelHow to Add Weeks to a Date in Microsoft Excel
How to Create a Line Chart in Microsoft ExcelHow to Add a Regression Line in Microsoft Excel
How to Split Rows in Microsoft ExcelHow to Delete Multiple Tabs in Microsoft Excel
How to Create a Bullet Point in Microsoft ExcelHow to Separate Words in Microsoft Excel
How to Delete a Graph in Microsoft ExcelHow to Sort Cells in Microsoft Excel
How to Merge Duplicates in Microsoft ExcelHow to Calculate Interest in Microsoft Excel
How to Find the Percentage of Two Numbers in ExcelHow to Rename Legends in Microsoft Excel
How to Merge 3 Columns in Microsoft ExcelHow to Combine Two Tables in Microsoft Excel
How to Insert Images in an Excel CellHow to Find Hidden Columns in Microsoft Excel
How to Find Percentiles in Microsoft ExcelHow To Make an Excel Spreadsheet
How to Force Quit Microsoft Excel on WindowsHow to Freeze the First Row and Column in Microsoft Excel
How to Clear a Clipboard in Microsoft ExcelHow to Set the Row Height in Microsoft Excel
How to Delete a Formula in Microsoft ExcelHow To Restore a Previous Version of Excel
How To Find Duplicate Cells in Microsoft ExcelHow To Pivot Tables in Microsoft Excel
How to Do Subtotals in Microsoft ExcelHow to Insert an Object in Microsoft Excel
How to Copy Rows in Microsoft ExcelHow to Get a Sum in Microsoft Excel
How to Put Exponents in Microsoft ExcelHow to Split Information in a Microsoft Excel Cell
How to Duplicate a Tab in Microsoft ExcelHow to Calculate R2 in Microsoft Excel
How to Consolidate Duplicates in Microsoft ExcelHow to Create Collapsible Rows in Microsoft Excel
How to Calculate the Coefficient of Variation in Microsoft ExcelHow to Insert a Microsoft Excel File in Word
How to Save a Microsoft Excel Sheet as PDFHow to Create a Box and Whisker Plot in Microsoft Excel
How to Disable Scroll Lock in Microsoft ExcelHow to Insert a Symbol in Microsoft Excel
How to Remove Minus Sign in Microsoft ExcelHow to Insert an Email into Microsoft Excel
How to Round in Microsoft Excel FormulaHow to Exit Header and Footer in Microsoft Excel
How to Add the Add-Ins in Microsoft ExcelHow to Find Blank Cells in Microsoft Excel
How to Shift Rows Up in Microsoft ExcelHow to Select a Range of Cells in Microsoft Excel
How to Get Solver on Microsoft ExcelHow to Create a Calculated Field in Microsoft Excel
How to Make a Paragraph in Microsoft ExcelHow to Create Mail Merge from Microsoft Excel
bottom banner