Get Access to World’s largest Template Library & Tools

How to Make Graphs in Microsoft Excel


Microsoft Excel is an essential tool for creating graphs, allowing you to visually represent and analyze your data with ease. This tutorial provides the steps for crafting various types of graphs in spreadsheets so you can convert raw data into meaningful charts.
How to Make Graphs in Microsoft Excel


  • Step 1. Prep Your Data

    step
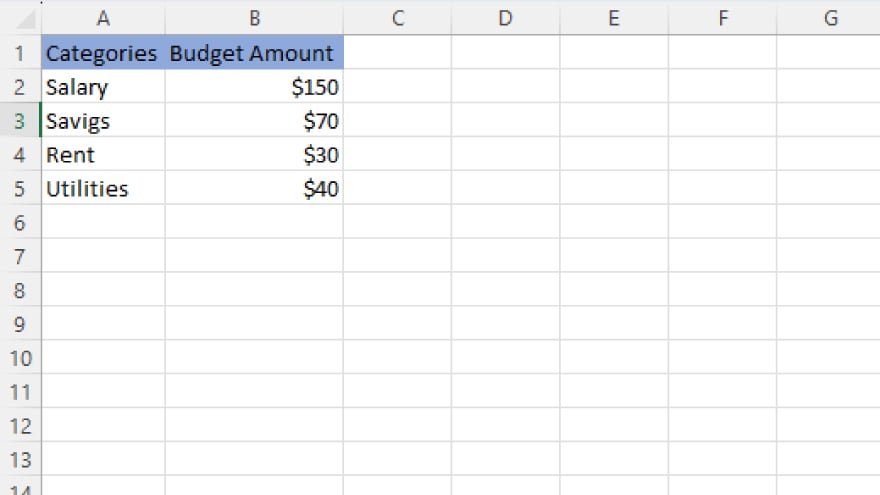
    The first step in crafting a graph in Microsoft Excel is preparing your data. This crucial process involves entering your information into the spreadsheet so that it’s understandable and usable for graph creation. The organization of your data depends on the type of graph you’re aiming to create. Generally, data should be entered in columns or rows, each representing a different data series. These series then translate into varying lines, bars, or sections on the graph. Typically, the initial row or column is reserved for labeling your data series.

  • Step 2. Format the Data

    step

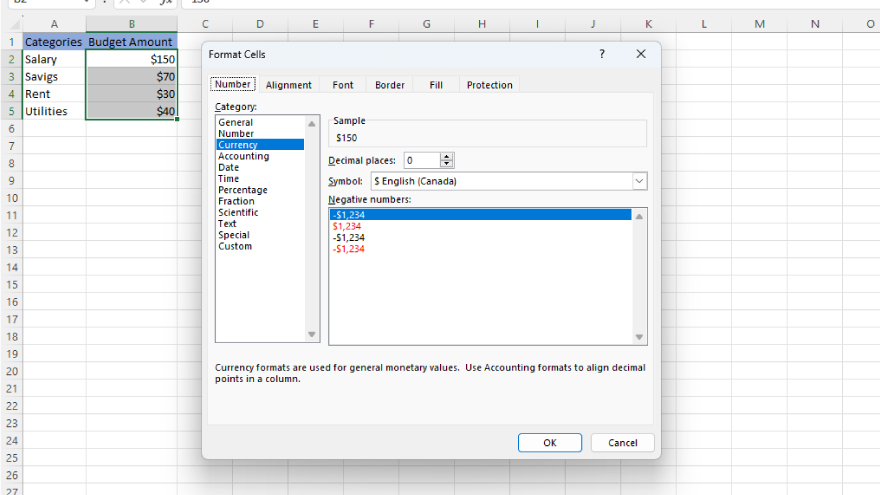
    After inputting your data, formatting comes next. This step might include modifying the number format, fine-tuning decimal places, or applying specific styles or colors to cells. Proper formatting enhances the readability and comprehension of your data and influences its representation on the graph. It’s also vital to check for errors or inconsistencies in your data before proceeding to graph creation. Mistakes like missing values, incorrect entries, or improperly formatted data can compromise the accuracy and reliability of your graph.

  • Step 3. Create the Graph

    step

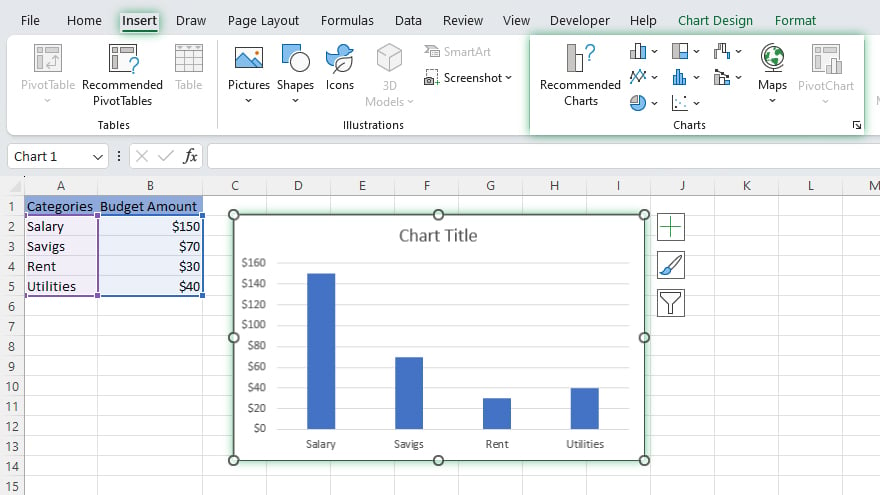
    With your data prepared and formatted, you’re already a step closer to finishing how to graph in Microsoft Excel. Begin by selecting the data to be included in the graph, then decide on the graph type and customize its appearance. To select data in Excel, click and drag your mouse over the cells with the relevant data. Next, navigate to the “Insert” tab on the Excel ribbon and choose your desired graph type from the “Charts” group.

  • Step 4. Customize Your Graph

    After creating the graph, you can personalize its look to enhance its visual appeal and clarity. Use the “Chart Tools” tabs on the Excel ribbon to make these adjustments. The customization options are extensive, from changing color schemes and adjusting axis scales to adding titles, labels, trendlines, error bars, and more.

You may also find valuable insights in the following articles offering tips for Microsoft Excel:

Step 5. Interpret Your Graph

Creating and customizing your graph leads to the vital stage of interpretation. Analyze your graph to decipher the story it tells about your data. Interpretation varies based on graph type and data nature. It might involve spotting trends, comparing data series, making predictions, or identifying outliers and anomalies that could signify errors or significant insights.

Step 6. Share the Graph

Finally, sharing your graph is often a key part of the data analysis process. Excel facilitates easy sharing through exporting graphs as images, embedding them in documents, or printing. Sharing the entire workbook is also an option, enabling others to interact with your data and graphs. Sharing is crucial, especially in contexts like presentations, reports, and collaborative projects, as it allows others to view and understand your findings.

note iconNote

Unlock Your Productivity with Over 100,000 Microsoft Excel Templates! Exclusively Available at Template.net – Download Now and Transform Your Data Handling Experience!

FAQs

What are graphs in Excel?

Graphs in Excel are visual representations of data, making it easier to understand and analyze numerical information.

How do I select the right type of graph for my data in Excel?

Choose a graph type in Excel based on your data’s nature and the information you want to convey, such as line graphs for trends or pie charts for proportions.

Can I customize the colors and style of my Excel graph?

Yes, Excel allows extensive customization of graphs, including colors, styles, and layouts, through the ‘Chart Tools’ feature.

How can I add labels and titles to my Excel graph?

Use the ‘Chart Elements’ button in Excel to easily add and customize titles, labels, and legends to your graph.

Is it possible to update a graph automatically when new data is added in Excel?

Yes, graphs in Excel automatically update when new data is added to the connected range or table.

More in Excel

How to Freeze a Line in Microsoft ExcelHow to Create If Then in Microsoft Excel
How to Add Text in Microsoft ExcelHow to Return to Normal View in Microsoft Excel
How to Add Secondary X-Axis in Microsoft ExcelHow to Export Google Calendar to Microsoft Excel
How to Calculate R Squared in Microsoft ExcelHow to Select 2 Columns in Microsoft Excel
How to Go to the Next Line in Microsoft Excel CellHow to Insert a Blank Row in Microsoft Excel
How to Format a Microsoft Excel SpreadsheetHow to Do a Multiplication Formula in Microsoft Excel
How to Email an Excel DocumentHow to See Edit History in Microsoft Excel
How to Color Rows in Microsoft ExcelHow to Average Time in Microsoft Excel
How to Add a Header and Footer in Microsoft ExcelHow to Create a Monthly Calendar in Microsoft Excel
How to Lock an Excel Workbook from EditingHow to Custom Sort in Microsoft Excel
How to Do a Waterfall Chart in Microsoft ExcelHow to Remove Line Breaks in Microsoft Excel
How to Unlock Arrow Keys in Microsoft ExcelHow to Create a Monthly Budget in Microsoft Excel
How to Find the Probability in Microsoft ExcelHow to Get Solver in Microsoft Excel
How to Edit a Cell in Microsoft ExcelHow to Pin Columns in Microsoft Excel
How to Remove Scientific Notation in Microsoft ExcelHow to Turn Off Compatibility Mode in Microsoft Excel
How to Edit an Excel SpreadsheetHow to Change Formulas to Values in Microsoft Excel
How to Create a Mailing List in Microsoft ExcelHow to Write Formulas in Microsoft Excel
How to Link a PDF in Microsoft ExcelHow to Add a Comma in Microsoft Excel
How to Create a Project Timeline in Microsoft ExcelHow to Sum Filtered Cells in Microsoft Excel
How to Do a Sum in Microsoft ExcelHow to Combine Data in Two Columns in Microsoft Excel
How to Download a Microsoft Excel SpreadsheetHow to Create Sequential Numbers in Microsoft Excel
How to Edit Named Ranges in Microsoft ExcelHow to Rearrange Rows in Microsoft Excel
How to Make a Graph Using Microsoft ExcelHow to Add Weeks to a Date in Microsoft Excel
How to Create a Line Chart in Microsoft ExcelHow to Add a Regression Line in Microsoft Excel
How to Split Rows in Microsoft ExcelHow to Delete Multiple Tabs in Microsoft Excel
How to Create a Bullet Point in Microsoft ExcelHow to Separate Words in Microsoft Excel
How to Delete a Graph in Microsoft ExcelHow to Sort Cells in Microsoft Excel
How to Merge Duplicates in Microsoft ExcelHow to Calculate Interest in Microsoft Excel
How to Find the Percentage of Two Numbers in ExcelHow to Rename Legends in Microsoft Excel
How to Merge 3 Columns in Microsoft ExcelHow to Combine Two Tables in Microsoft Excel
How to Insert Images in an Excel CellHow to Find Hidden Columns in Microsoft Excel
How to Find Percentiles in Microsoft ExcelHow To Make an Excel Spreadsheet
How to Force Quit Microsoft Excel on WindowsHow to Freeze the First Row and Column in Microsoft Excel
How to Clear a Clipboard in Microsoft ExcelHow to Set the Row Height in Microsoft Excel
How to Delete a Formula in Microsoft ExcelHow To Restore a Previous Version of Excel
How To Find Duplicate Cells in Microsoft ExcelHow To Pivot Tables in Microsoft Excel
How to Do Subtotals in Microsoft ExcelHow to Insert an Object in Microsoft Excel
How to Copy Rows in Microsoft ExcelHow to Get a Sum in Microsoft Excel
How to Put Exponents in Microsoft ExcelHow to Split Information in a Microsoft Excel Cell
How to Duplicate a Tab in Microsoft ExcelHow to Calculate R2 in Microsoft Excel
How to Consolidate Duplicates in Microsoft ExcelHow to Create Collapsible Rows in Microsoft Excel
How to Calculate the Coefficient of Variation in Microsoft ExcelHow to Insert a Microsoft Excel File in Word
How to Save a Microsoft Excel Sheet as PDFHow to Create a Box and Whisker Plot in Microsoft Excel
How to Disable Scroll Lock in Microsoft ExcelHow to Insert a Symbol in Microsoft Excel
How to Remove Minus Sign in Microsoft ExcelHow to Insert an Email into Microsoft Excel
How to Round in Microsoft Excel FormulaHow to Exit Header and Footer in Microsoft Excel
How to Add the Add-Ins in Microsoft ExcelHow to Find Blank Cells in Microsoft Excel
How to Shift Rows Up in Microsoft ExcelHow to Select a Range of Cells in Microsoft Excel
How to Get Solver on Microsoft ExcelHow to Create a Calculated Field in Microsoft Excel
How to Make a Paragraph in Microsoft ExcelHow to Create Mail Merge from Microsoft Excel
bottom banner