


How to Remove Underline in Google Sheets
Google Sheets not only excels in data management but also offers flexible text formatting options, including the removal of underlines. Ideal…
Feb 12, 2024


Jan 22, 2024
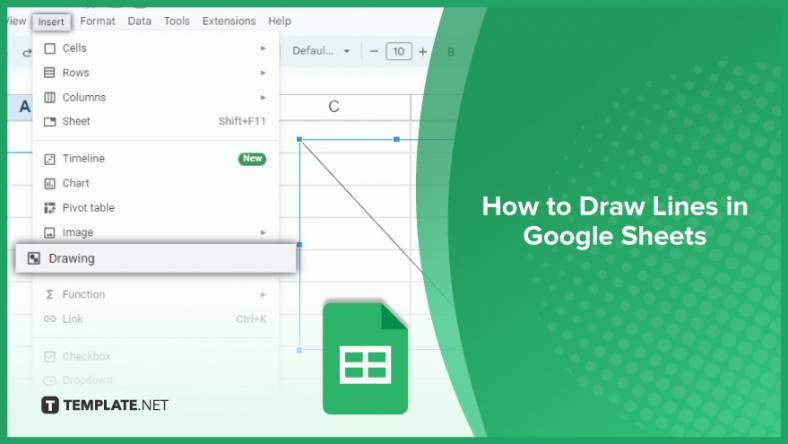
Google Sheets is a versatile spreadsheet application that allows for a variety of formatting options, including the addition of lines. This article provides a step-by-step guide on how to draw lines in Google Sheets, enhancing your data organization and visual appeal. You’ll learn various techniques to effectively use lines for separating data, drawing attention, or improving readability.

Understanding Google Sheets, a web-based spreadsheet tool is crucial for maximizing its features, which rival those of traditional programs like Microsoft Excel. It’s designed to cater to beginners and advanced users, offering a range of functions from complex calculations to data visualization. In this context, we’ll explore how to draw lines in Google Sheets, a simple technique that can greatly enhance your spreadsheet’s functionality and aesthetic appeal.
The easiest approach to add lines in Google Sheets is by inserting borders. This technique is perfect for delineating or emphasizing specific cells, rows, or columns. To implement this, select your desired cells, click on the ‘Borders’ icon in the toolbar, and choose your preferred border style.

For more creative control, the Draw Line tool in Google Sheets allows you to add lines anywhere on your worksheet. Access this feature by going to the ‘Insert’ menu, selecting ‘Drawing,’ and then opting for ‘Line.’ This tool gives you the flexibility to place and customize the line’s color, width, and style to suit your sheet’s design.

For those who need to represent data trends visually, the Sparkline function is an advanced technique to add lines in Google Sheets. It creates miniature charts or graphs within a cell. To use this, enter a formula in a cell that includes the data range you want to represent and any specific parameters for the line’s look. Google Sheets will then automatically generate a line chart within that cell, providing a quick visual representation of your data.
You might also gain useful advice from these articles that offer tips for Google Sheets:
Use the ‘Borders’ tool in the toolbar to add lines by selecting border style after choosing your cells.
Yes, use the ‘Draw Line’ tool found under the ‘Insert’ menu, then select ‘Drawing’ and ‘Line.’
Absolutely, with the ‘Draw Line’ tool, you can change the line’s color, thickness, and style.
Employ the ‘Sparkline’ function, inputting a formula in a cell to generate a mini chart or graph.
Yes, by selecting both rows and columns and then applying your desired border style.
Google Sheets not only excels in data management but also offers flexible text formatting options, including the removal of underlines. Ideal…
Google Sheets offers a wide range of features that can help you organize, analyze, and manipulate data effectively. One…
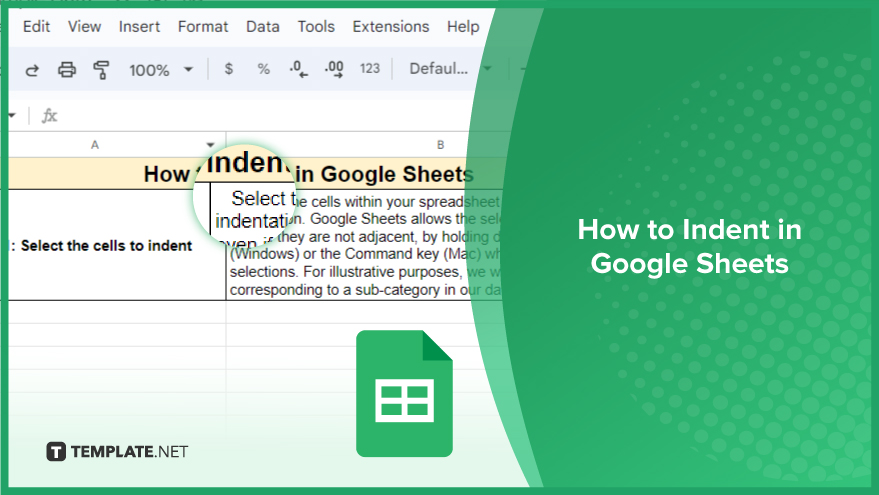
Indentation in Google Sheets is a handy feature that can significantly enhance the readability and organization of your…
Google Sheets is a vital component of the Google Workspace suite that empowers users with diverse functionalities for efficient data…
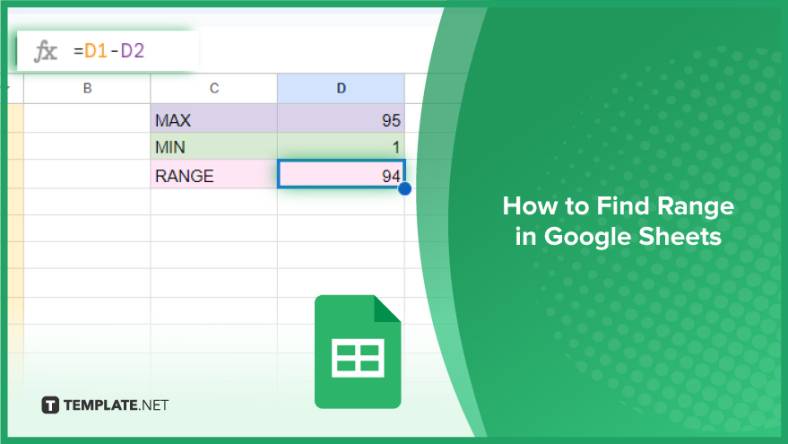
Google Sheets simplifies the process of statistical analysis, particularly in calculating the range of a data set. This guide will walk…
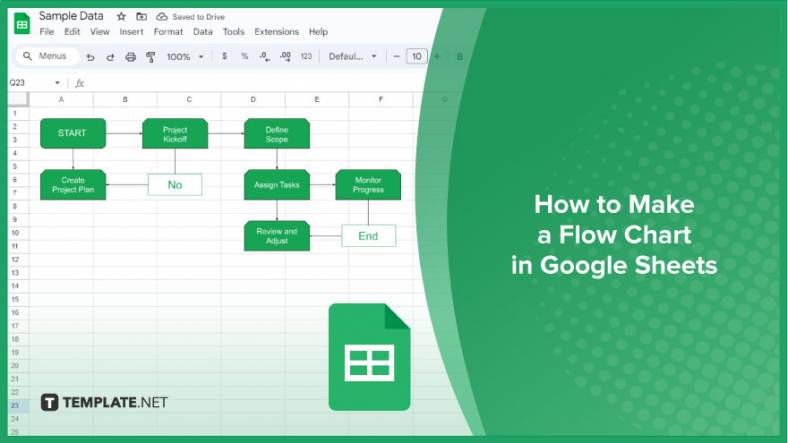
Google Sheets is a popular spreadsheet application that offers a variety of features that can be used to create flow…
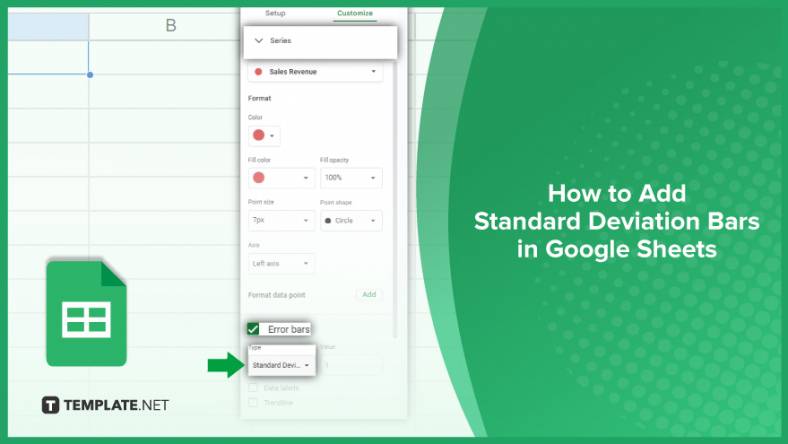
Standard deviation, a key statistical measure for gauging data variability, plays a crucial role in fields like finance, science, and…
Google Sheets is a versatile spreadsheet application that allows for a variety of formatting options, including the addition of lines. This…

Personal loan trackers are one of the ways people can manage the finances of their property and gain financial power…