


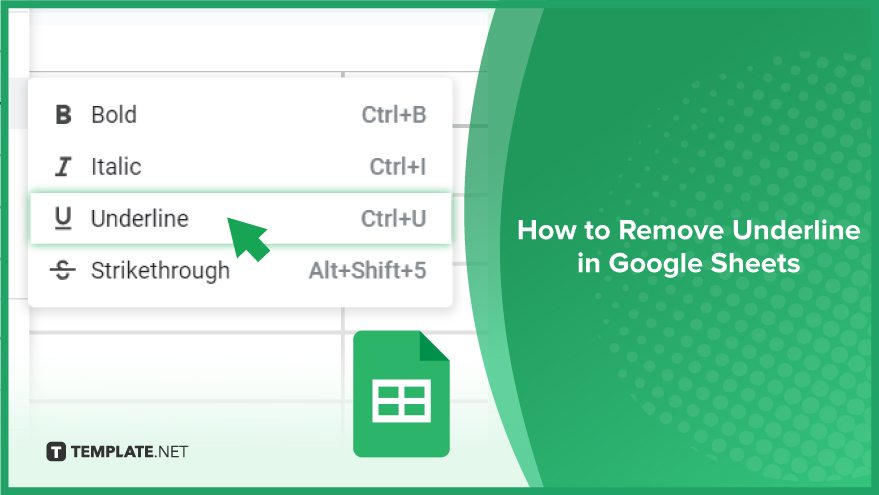
How to Remove Underline in Google Sheets
Google Sheets not only excels in data management but also offers flexible text formatting options, including the removal of underlines. Ideal…
Feb 12, 2024


Feb 02, 2024
Google Sheets simplifies the process of statistical analysis, particularly in calculating the range of a data set. This guide will walk you through the straightforward steps to determine the range, a key measure in understanding data variability.

Calculating the range of a dataset in Google Sheets is a fundamental skill for anyone working with numbers, whether in a professional setting, academic research, or personal projects. The range, which is the difference between the maximum and minimum values in your data, can provide valuable insights into the spread and variability of your dataset.

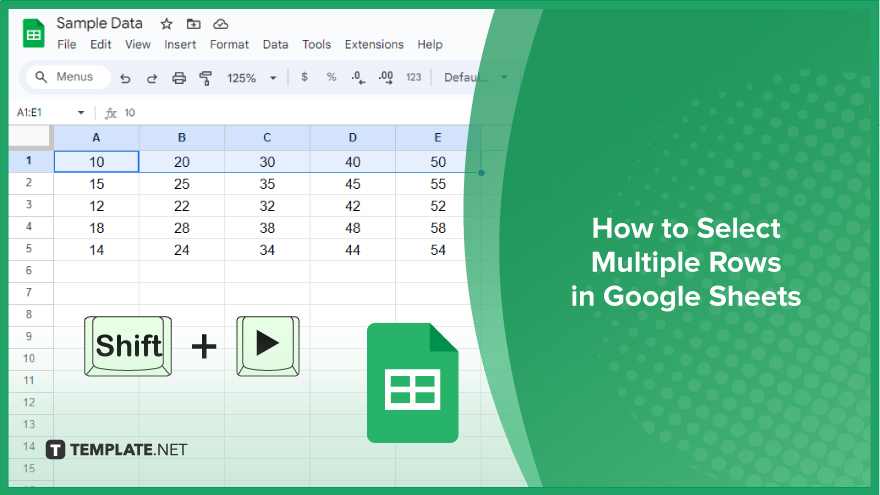
Firstly, pinpoint the dataset you want to analyze. This could be a series of numbers in a row, a column, or a specific block within your Google Sheets document. For instance, if you have a column of ages in column A, that becomes your dataset for this exercise.

The second step involves finding the highest value in your dataset using the MAX function. Simply type “=MAX(” in a cell, followed by your data range, and close with a parenthesis. For example, for a dataset in column A, enter “=MAX(A:A).” Hitting Enter will prompt Google Sheets to calculate and display the maximum value of your dataset in the selected cell.

After determining the maximum value, the next step is to find the lowest value in your dataset with the MIN function. The procedure for the MIN function mirrors that of MAX. Enter “=MIN(” followed by your dataset range and a closing parenthesis. For instance, type “=MIN(A:A)” for a dataset in column A. Pressing Enter will calculate and show the minimum value in your dataset.

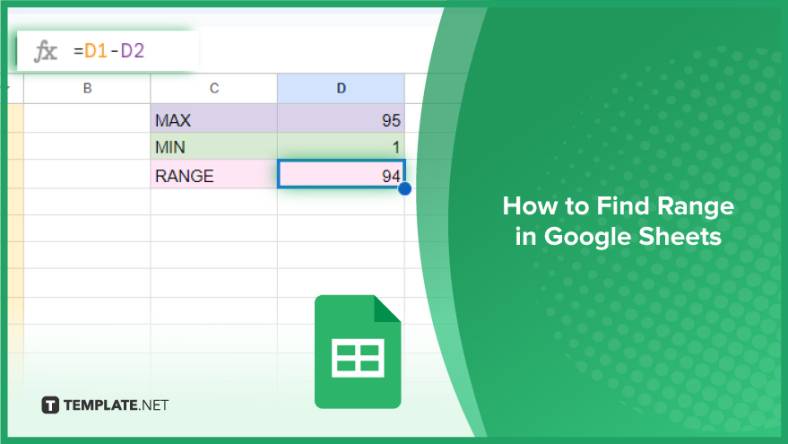
The final step to ascertain the range is to subtract the minimum value from the maximum value. Perform this subtraction directly in Google Sheets. For example, if the maximum value is in cell D1 and the minimum value is in cell D2, enter “=D1-d2” in a new cell. When you press Enter, Google Sheets will compute the subtraction and display the range in the cell with the formula. Now you have a digital calculator that provides the range of your dataset, effectively showing the spread between the highest and lowest values.
You might also gain useful advice from these articles that offer tips for Google Sheets:
Select the row, column, or block of numbers in your spreadsheet that constitutes your dataset.
Use the MAX function by typing “=MAX(range),” where “range” is your dataset’s cell range.
Apply the MIN function by entering “=MIN(range),” replacing “range” with the cells containing your data.
Subtract the minimum value from the maximum value using a formula like “=MAX(range)-MIN(range).”
Yes, use the MAX and MIN functions with a combination of cell references separated by commas.
Google Sheets not only excels in data management but also offers flexible text formatting options, including the removal of underlines. Ideal…
Google Sheets offers a wide range of features that can help you organize, analyze, and manipulate data effectively. One…
Indentation in Google Sheets is a handy feature that can significantly enhance the readability and organization of your…
Google Sheets is a vital component of the Google Workspace suite that empowers users with diverse functionalities for efficient data…
Google Sheets simplifies the process of statistical analysis, particularly in calculating the range of a data set. This guide will walk…
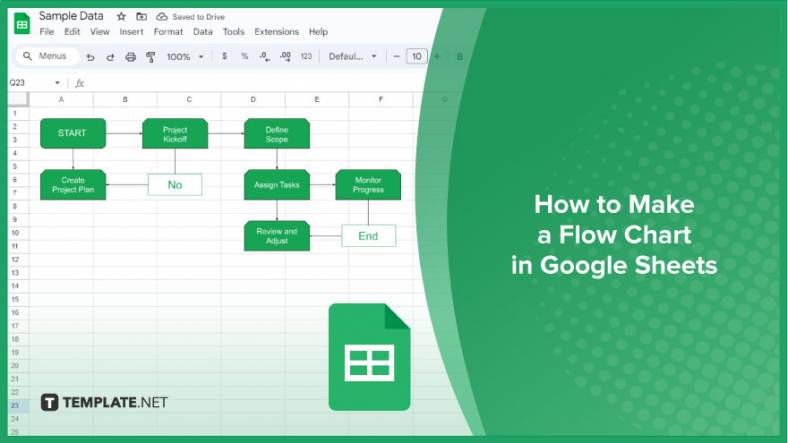
Google Sheets is a popular spreadsheet application that offers a variety of features that can be used to create flow…
Standard deviation, a key statistical measure for gauging data variability, plays a crucial role in fields like finance, science, and…

Google Sheets is a versatile spreadsheet application that allows for a variety of formatting options, including the addition of lines. This…

Personal loan trackers are one of the ways people can manage the finances of their property and gain financial power…