Table of Contents
- Chart Ideas and Examples
- Clothing Chart Ideas and Examples
- Table Chart Ideas and Examples
- Line Chart Ideas and Examples
- BMI Chart Ideas and Examples
- Blood Type Chart Ideas and Examples
- Height Chart Ideas and Examples
- Qualitative Research Chart Ideas and Examples
- Multiplication Chart Ideas and Examples
- Social Chart Ideas and Examples
- FAQs
Chart Ideas
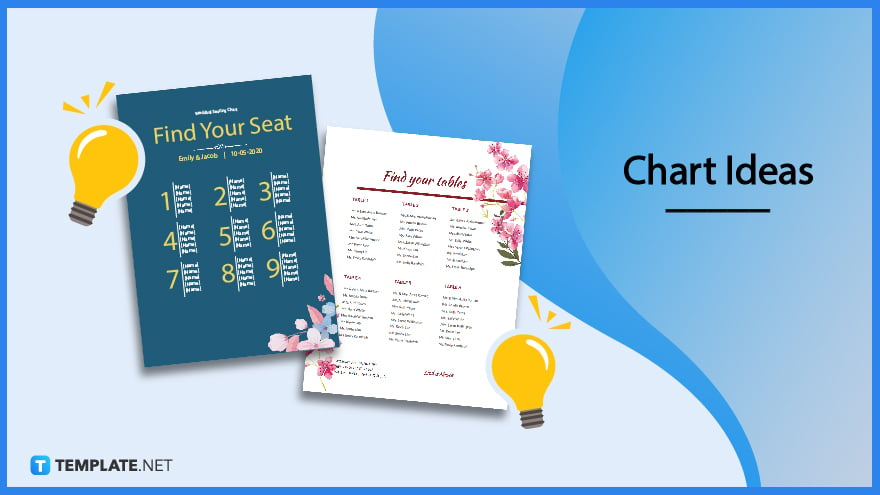
Chart ideas, considering your purpose for generating them and plenty of other factors, can be broad, complex, or even hard to come up with and express. If you are currently facing a block in your creative process, the following chart ideas will make the possibility of finding the best chart more of a reality than fiction.
Download the Free Chart Ideas Article in PDF!
File Format:
Chart Ideas and Examples
You should customize and personalize multiple elements and parts in your chart to ensure it aligns with your strategic goals. Save your funds and energy by looking into these chart ideas. It will help give you direction on how you should approach your chart-making process:
Clothing Chart Ideas and Examples
To ensure your customers get the clothing product that best suits them, it is always better to educate with style. That said, display the information and references they need regarding their body sizes using a chart. Study these clothing chart ideas and examples and use them as a guide when creating yours.
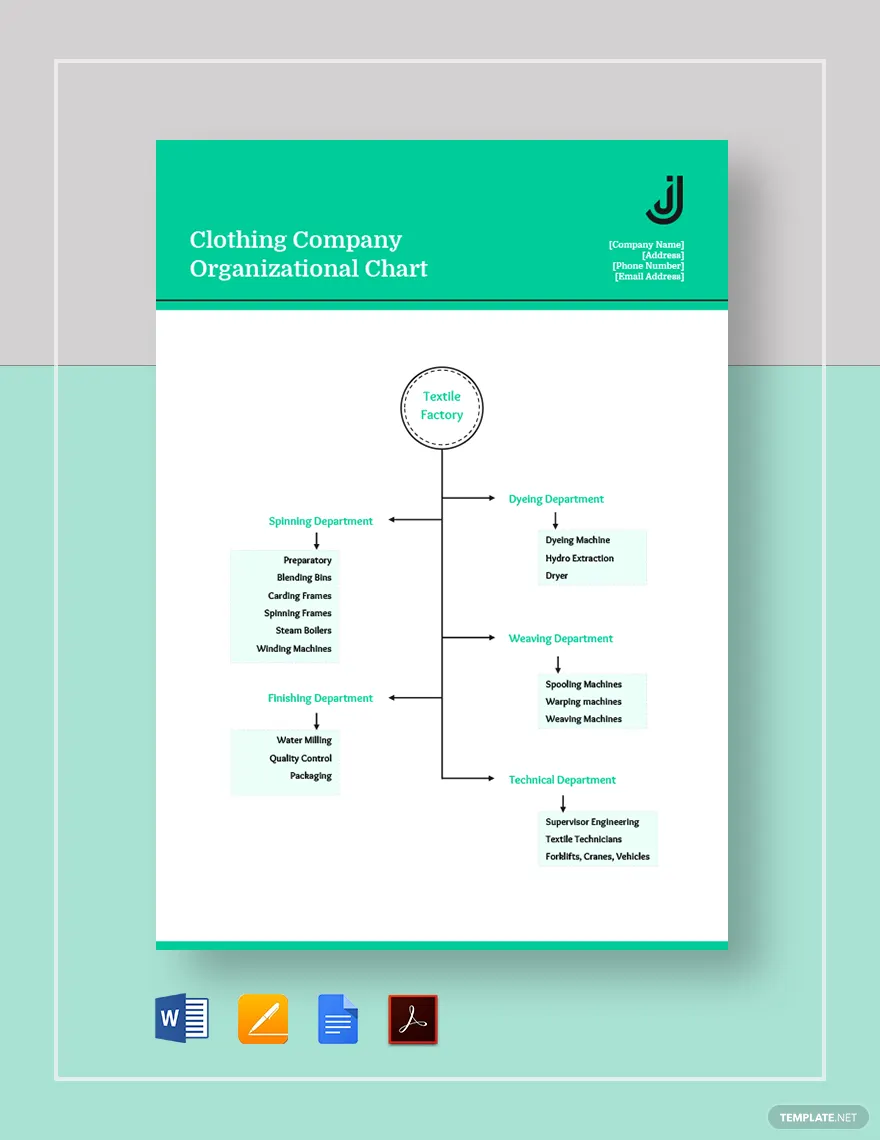
Table Chart Ideas and Examples
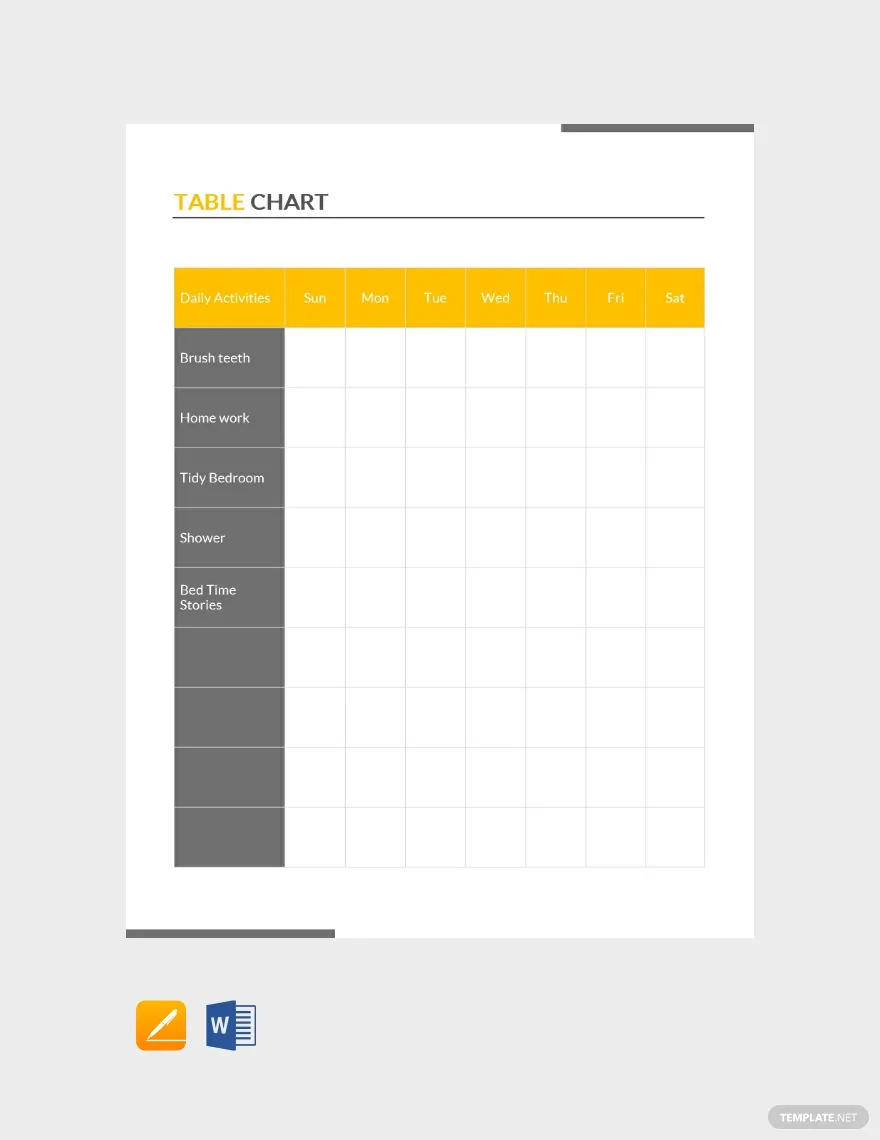
Table charts are crucial for a research agency and an extensive list of other industries such as architecture, business, and software. It is a tool for illustrating and organizing gathered data. Wherever you belong, pick your table chart ideas here.
Line Chart Ideas and Examples
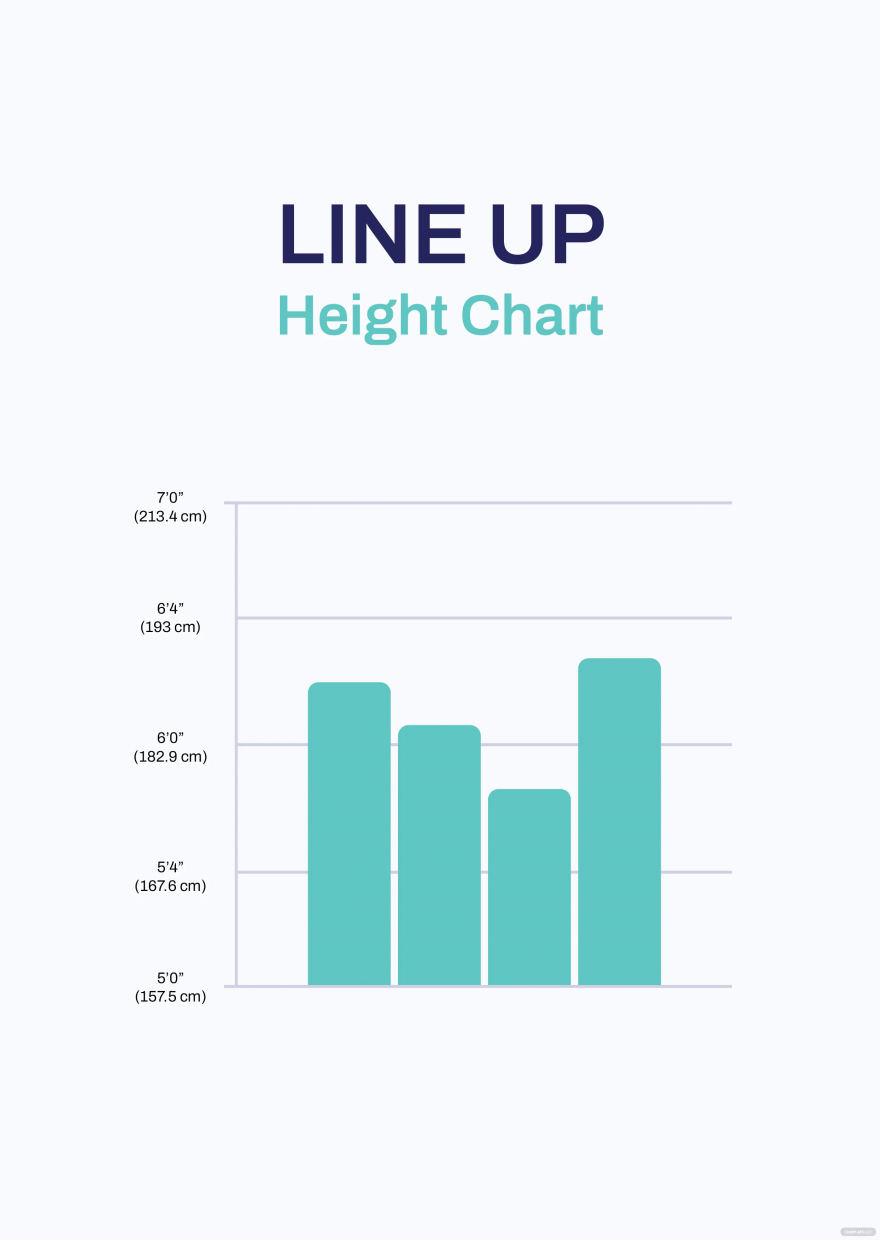
Line charts present the growth of your data over time. Ensure the data remains clear and digestible for the receiver of the information as your line rises and falls when you map the flow of changes. Present your data using these line chart ideas to convey facts and deliver your message seamlessly.
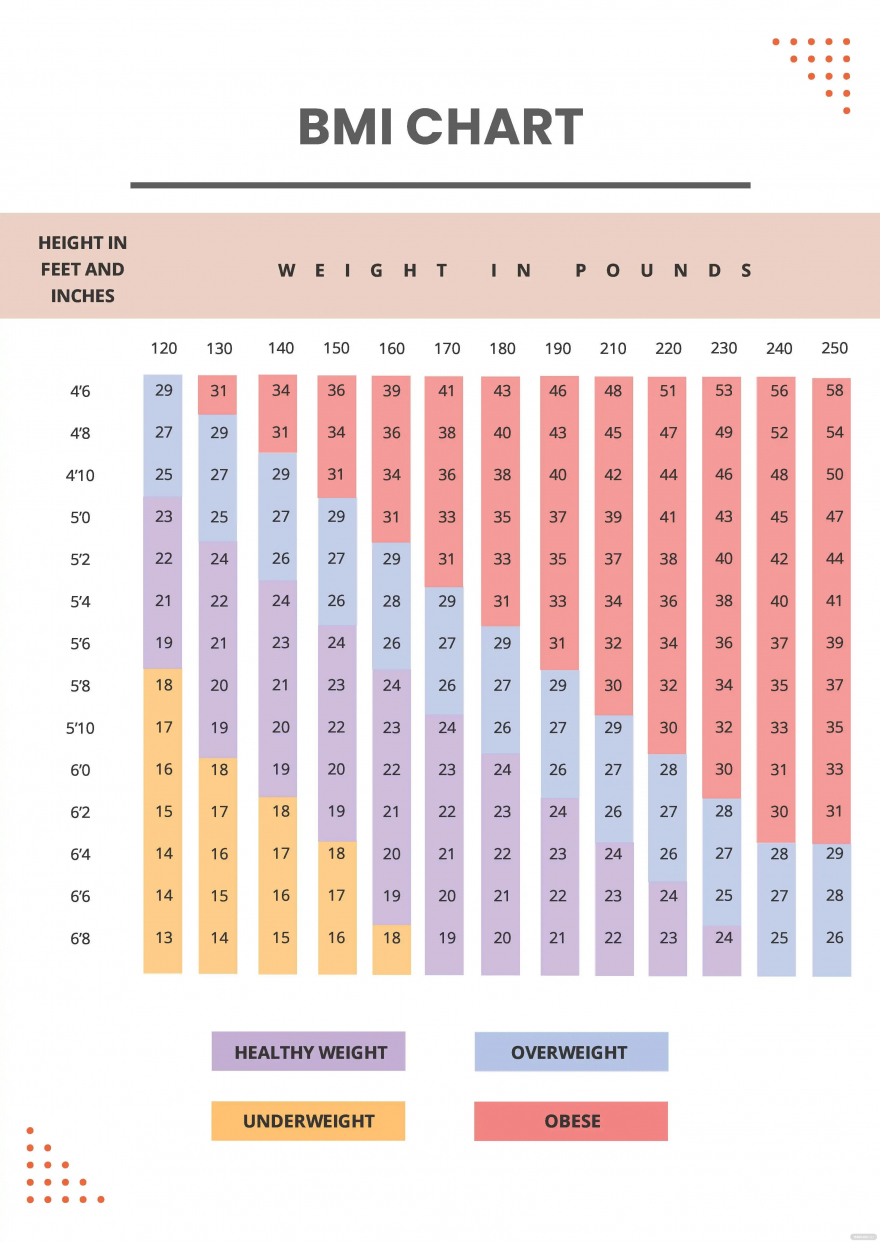
BMI Chart Ideas and Examples
When you want to calculate a person’s BMI to determine the direct measures of their body fat, you can use the formula. Although, with the presence of BMI charts, there is a quicker and more convenient way to do it. In this chart, you can map your weight and height and identify whether the color used represents underweight, healthy, overweight, obese, or extremely obese.
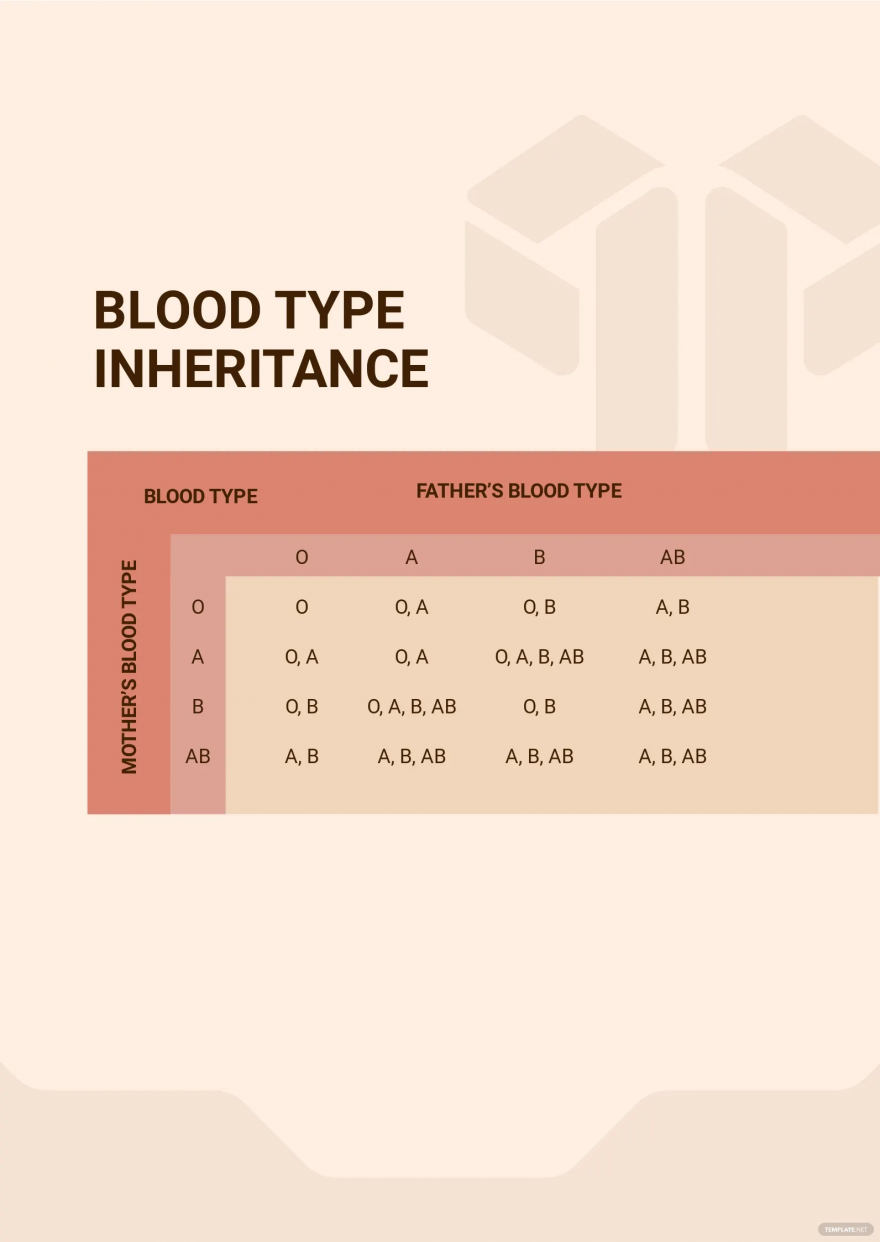
Blood Type Chart Ideas and Examples
Knowing one’s blood type is really essential in the health industry. Considering how charts help with providing information, a blood type chart could help you with the process. Also, it helps distribute information to people wanting to know their blood type and other relevant data.
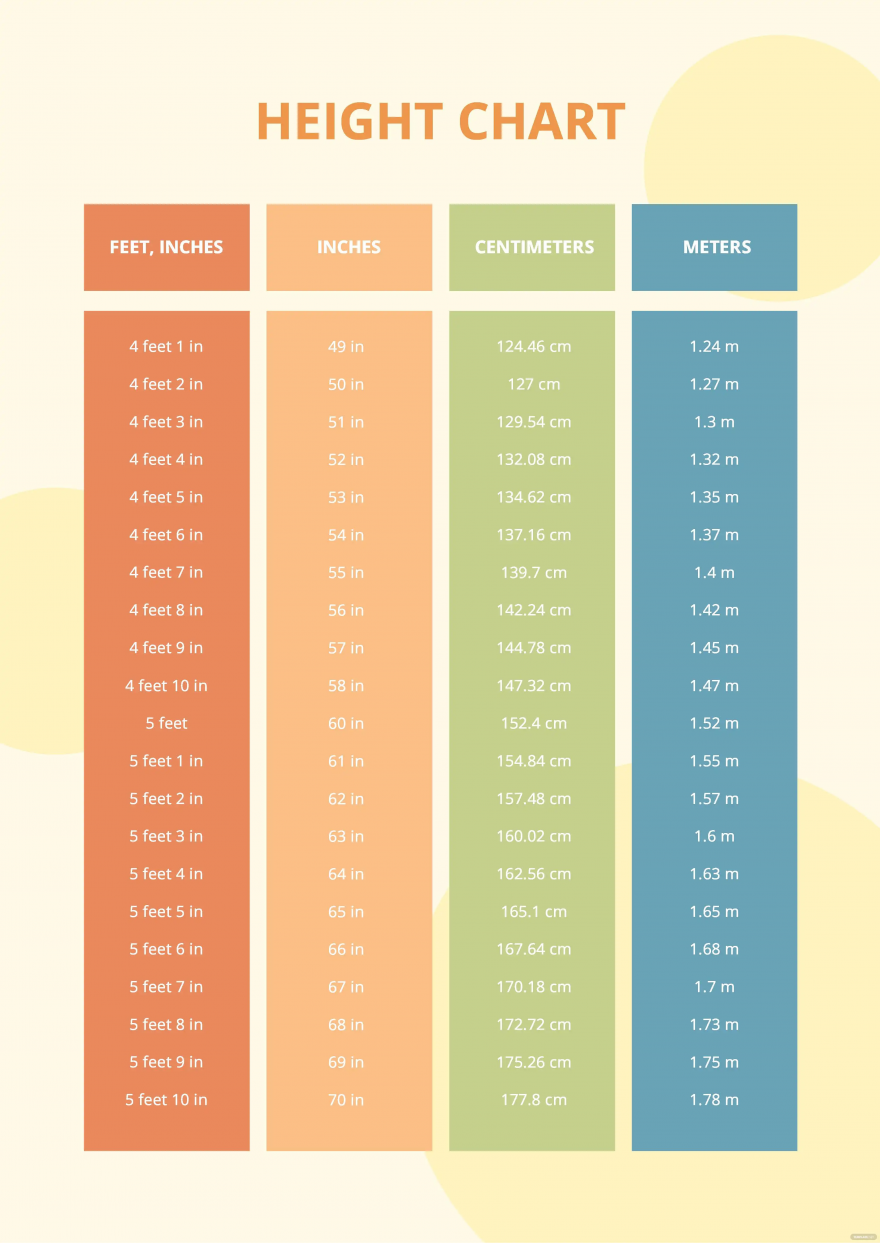
Height Chart Ideas and Examples
For individuals, especially kids having their growth spurt, it is essential to track growth over time. Having a height chart would help you determine and document height. You can generate it for comparison and illustrating information regarding ideal height for specific age groups and varying gender.
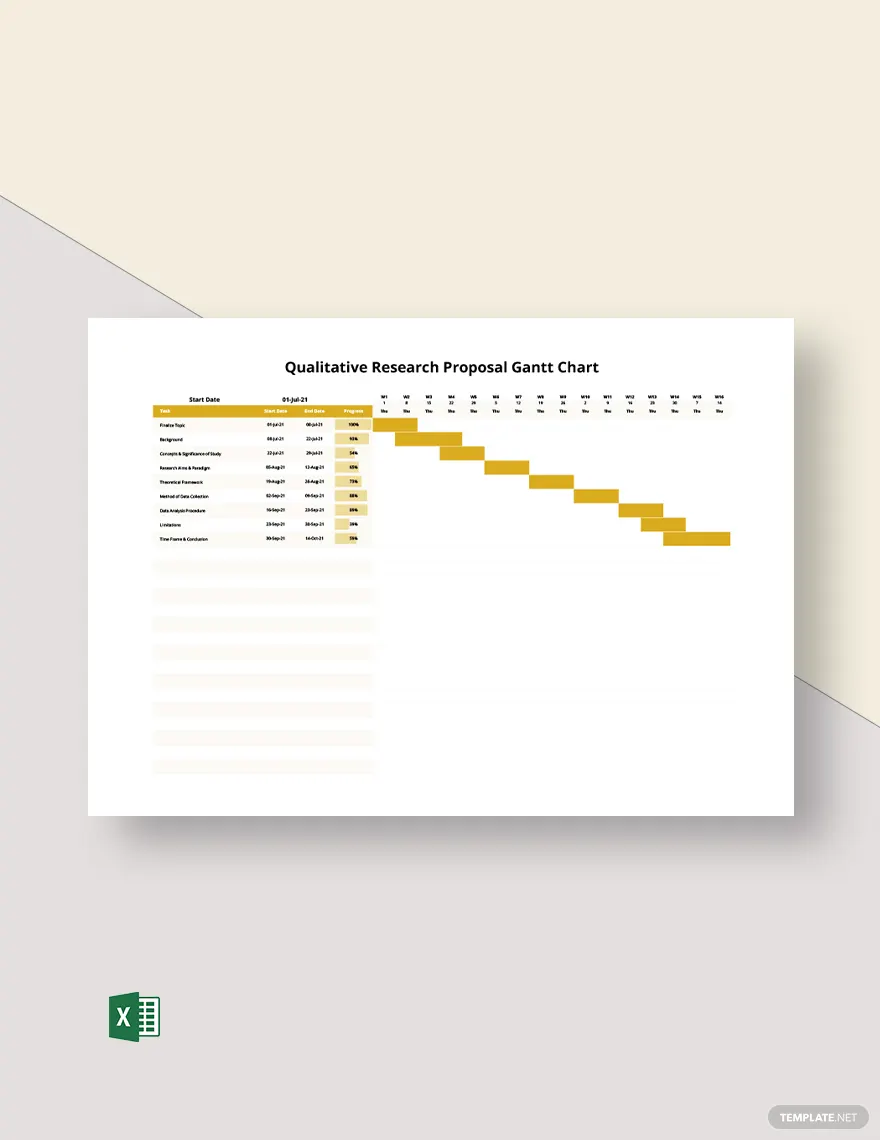
Qualitative Research Chart Ideas and Examples
Presenting your data on your qualitative research can get tricky. Luckily, you can use charts to make them easier to understand for the audience and ensure they are organized. With a qualitative research chart, researchers can also communicate and analyze data with better insights.
Multiplication Chart Ideas and Examples
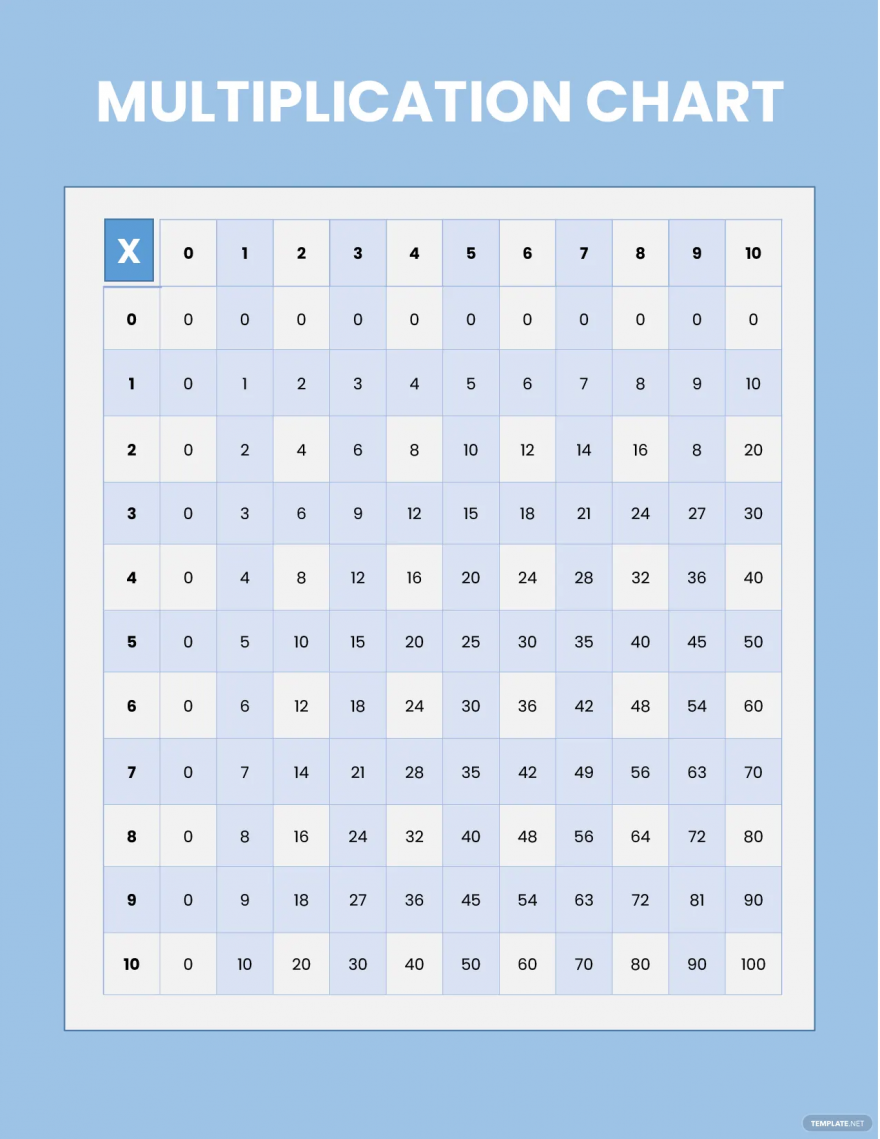
At some point, kids are required to memorize the multiplication table as it is one of the basics in Mathematics. Teachers could help out and guide students along this process with a multiplication chart. You can often find this chart glued on walls of classrooms and printed out in learning materials.
Social Chart Ideas and Examples
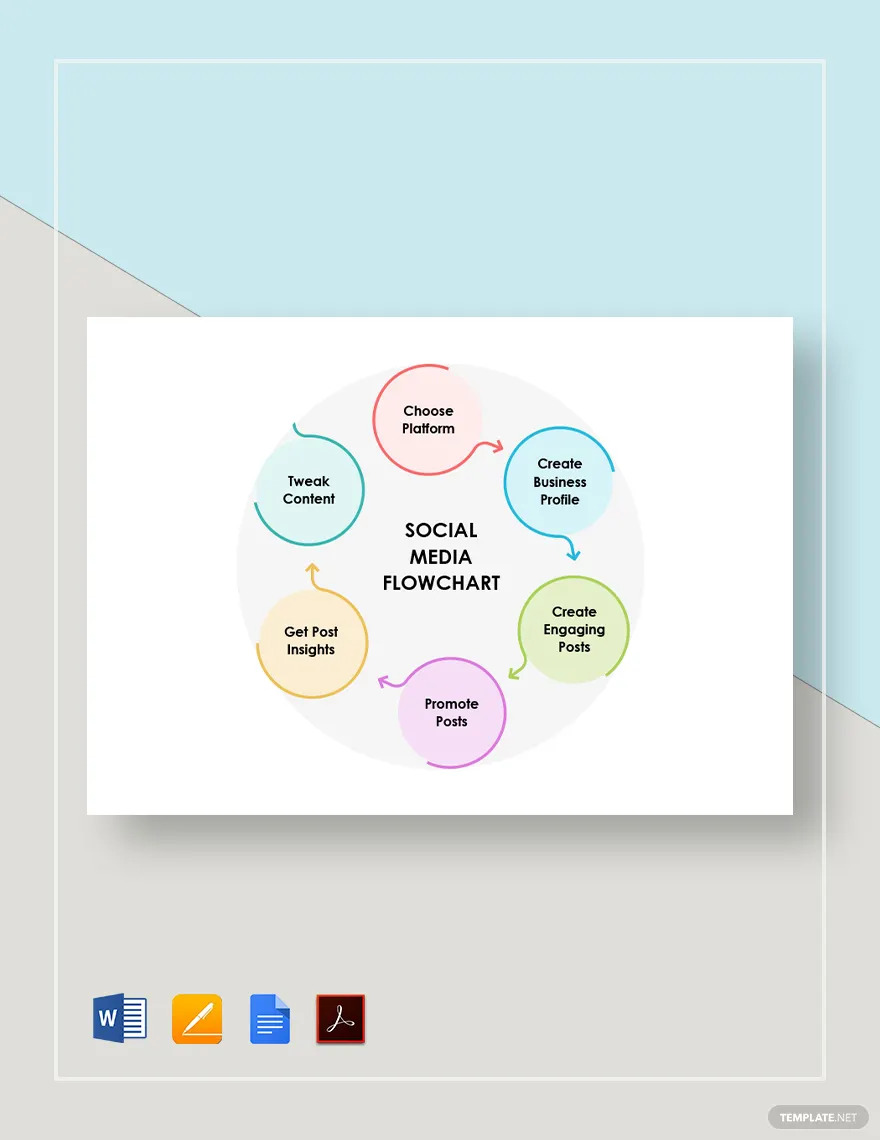
With the variety of purposes for creating charts, you can also use them to address and improve awareness on social topics and build your social network. Also, social charts that fits your context and message effectively provide information regarding network and community topics to your targeted public audience. Improve the distribution and circulation of essential information across varying channels through these compelling social chart ideas and examples.
FAQs
Can I change the chart colors?
Whether you are using Google Docs, Microsoft Word, or other platforms, you can customize the colors of the chart area and its background.
What are the limitations of a chart?
Although charts are helpful with representing complex data visually, you cannot entirely rely on them without delving deeper into the information when making decisions.
What are 3 tips for using graphs and charts?
When creating graphs and charts, you should remember to set your goals and know your purpose beforehand, organize your data before generating the chart, and use the appropriate digital tool or platform on the web.
What does a seating chart look like?
A seating chart can be a sketch or illustration created based on the interior space and the site’s floor plan that details where individuals and invited guests can sit.
What should a good chart include?
A good chart should have clarity with its context and details, a well-thought-out design that fits your audience, emphasis on crucial and central information, and notes regarding the chart limitations.
What happens to the chart as you update its data table?
The data you added to the table will reflect in your chart in real-time.
What is the key on a chart called?
The key section on a chart, also known as the legend, explains the symbols, numbers, and variables used to ensure that the viewers can understand the chart.
What is a combo chart?
A combo chart is a combination of two varying chart types that aim to display the differences and connections of different data sets, ideally column and line charts.
Where are waterfall charts used?
Organizations and businesses use waterfall charts to give more context regarding the cumulative effect of intermediate values on the initial value.
Which chart type provides the best visual display?
When talking about charts that grant the best visual display, bar graphs and pie graphs occupy the top ranks of the list.


