![How To Make/Create an Invitation in Google Docs [Templates + Examples]](https://images.template.net/wp-content/uploads/2023/07/How-To-Make_Create-an-Invitation-in-Google-Docs-Templates-Examples-788x443.png)
How To Make/Create an Invitation in Google Docs [Templates + Examples]
To formally invite someone or a group of people to an event or activity, you will need to send out…
Aug 26, 2024
Infographics have various sizes and forms available out there, and each of them has its own use and purpose, so it’s very crucial that you know and clearly understand what are the appropriate sizes and dimensions you will use in your infographic material. Whether you are working on a certain global marketing statistics presentation or a modern architecture housing project, a well-structured infographic templates will surely help you to be efficient in your work.
It is essential that you carefully plan the right aspect ratio and size of your infographic so that you can fully present the data, facts, figures, trends, and statistics to your target audience effectively. In this section, we provide you with the standard sizes of infographics for optimal visualization:
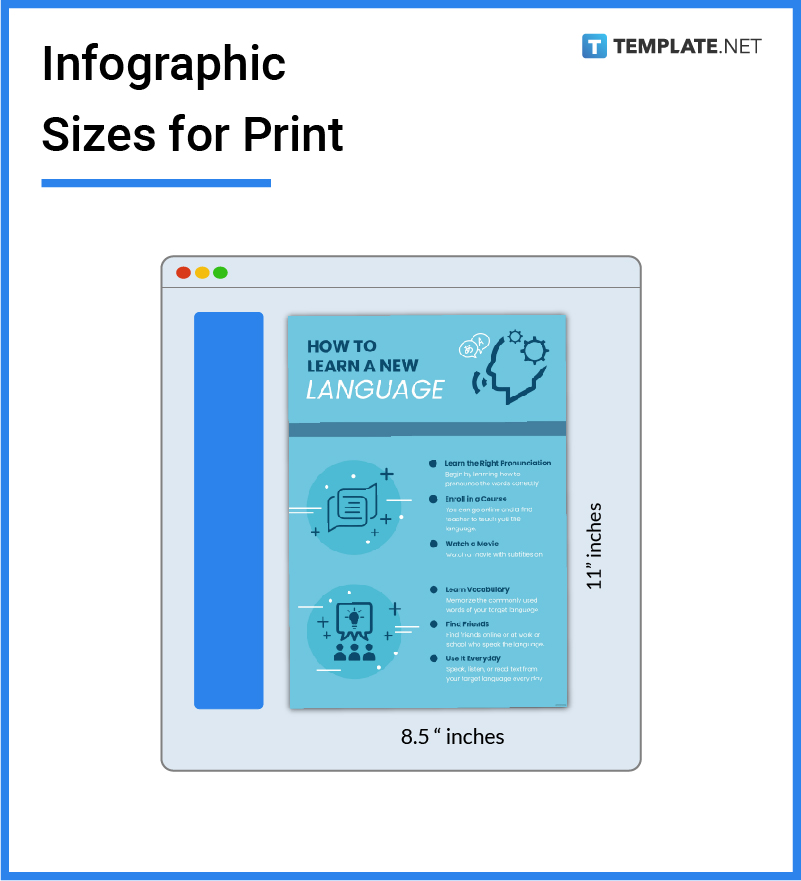
An A4 infographic has some measurements of 8.3 × 11.7 inches, 21.08 × 29.71 cm, or 210.82 × 297.18 mm. It is the commonly used standard size for printed infographics.
Letter size is one of the major standard sizes for printout infographics. It has a measurement of 8.5 × 11 inches, 21.59 × 27.94 cm, or 215.9 × 279.4 mm.
Generally used for legal and law-related documents, a legal infographic document has a size of 8.8 × 14 inches, 22.35 × 35.56 cm, or 223.52 × 355.6 mm.
Smartphones typically have a 4-inch screen or larger display area, your infographic must not exceed 288 pixels in width. For tablets, your infographic must have a standard size of 600 × 640 pixels.
The most common infographic size for horizontal presentations is 1200 pixels × 900 pixels. While all vertical infographic presentations are between 600 and 1100 pixels wide as the shorter infographic height goes up to about 2000 pixels and the longer ones can go up to 5000 pixels.
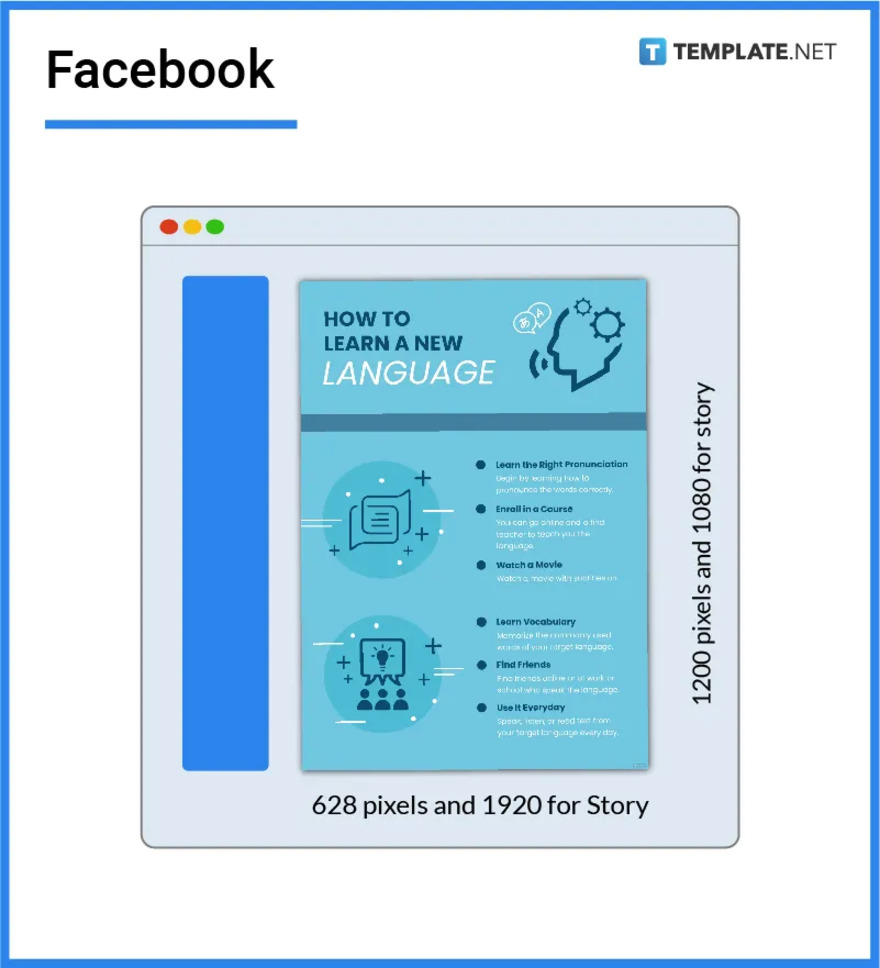
If you need to make an infographic post for your Facebook page, the recommended size is 1200 × 628 pixels. For an infographic on the story, the best size setting is 1080 × 1920 pixels with an aspect ratio of 1:91:1.
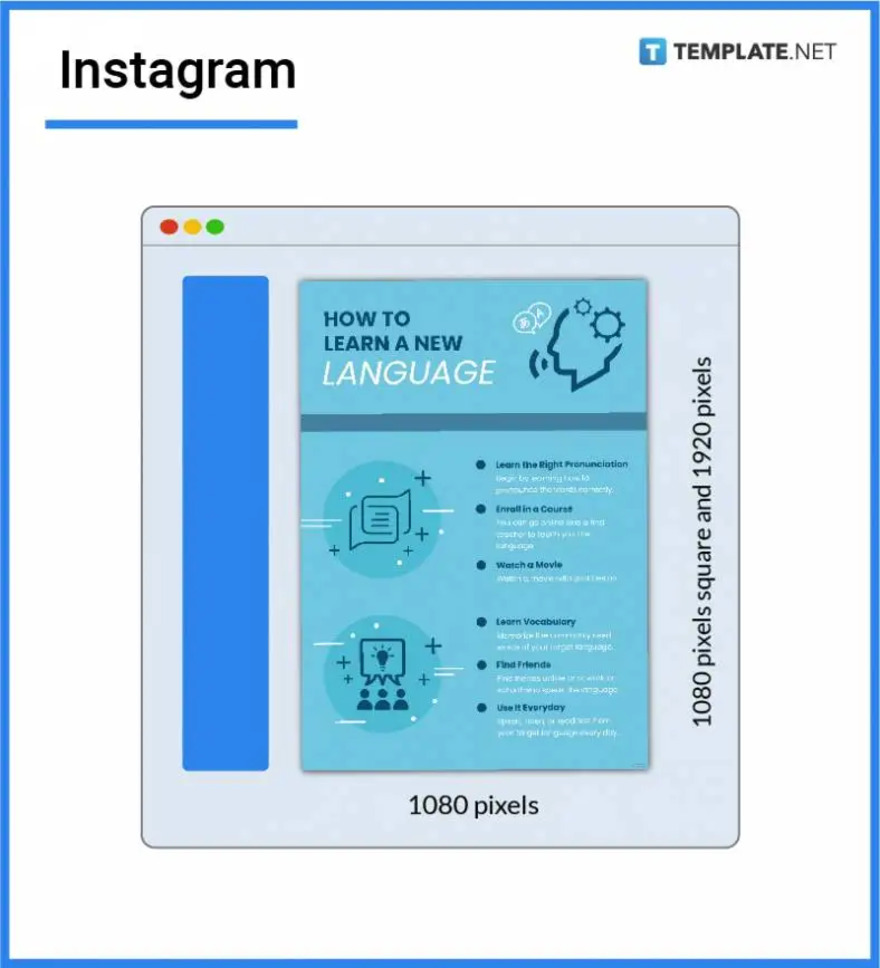
Use the size 1080 × 1080 pixels for a square image infographic post and apply the size 1080 × 1920 pixels for an infographic on an Instagram story. For a horizontal infographic post, set the size to 1080 × 566 pixels, and for a vertical infographic post, set the size to 1080 × 1350 pixels.
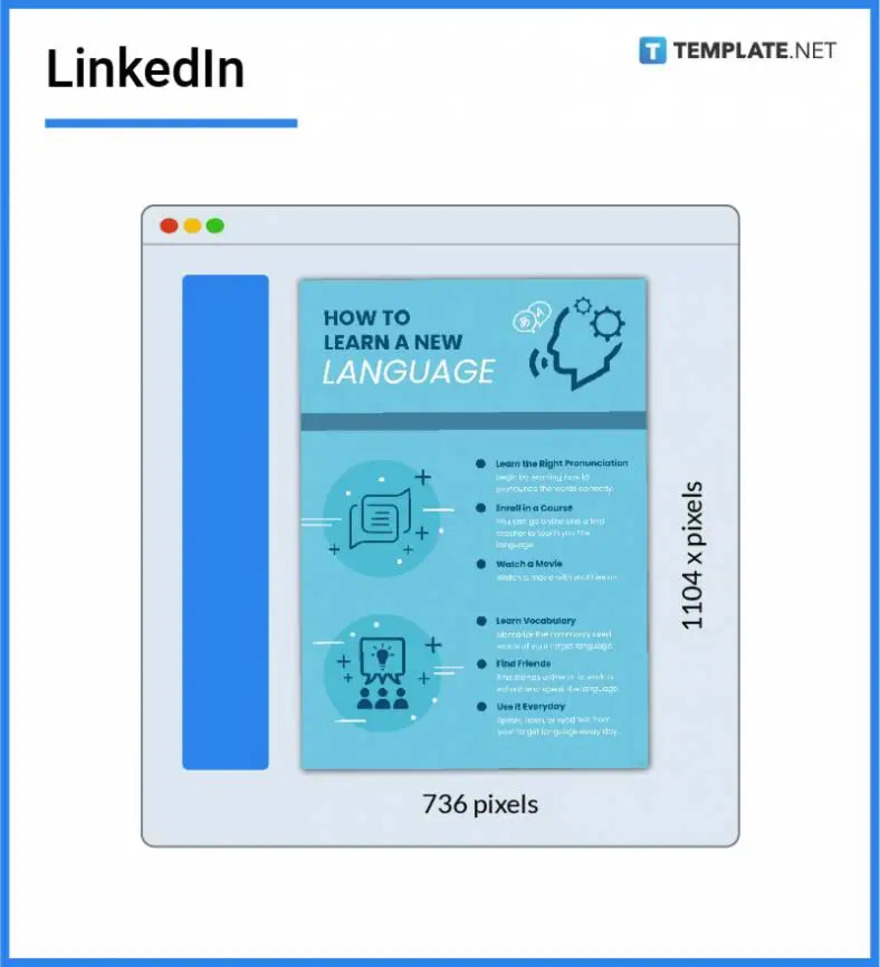
You can post an infographic on LinkedIn with a size configuration of 1104 × 736 pixels. It is a great size setting for job posting and marketing.
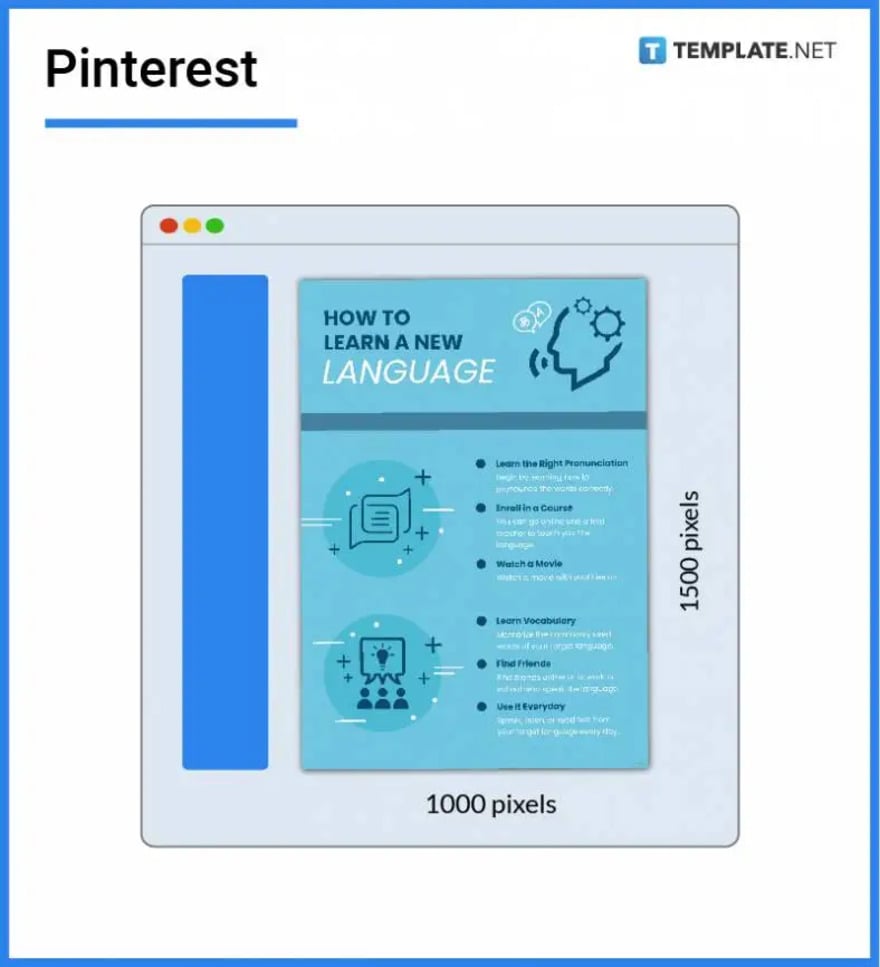
Make the vertical infographic pins stand out more, so set the size to 600 × 900 pixels. The recommended sizes commonly used on Pinterest are 1000 × 1500 pixels (standard infographic pin), and 1000 × 2100 (giraffe infographic pin).
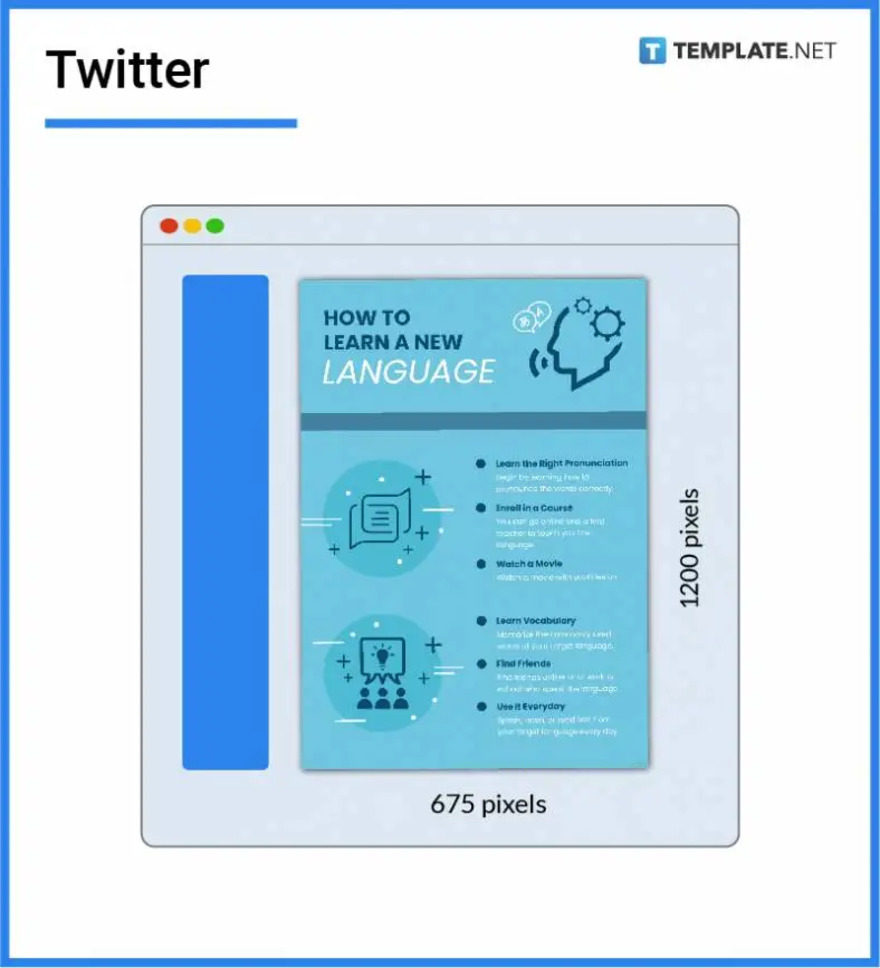
When you post a single image or GIF infographic, you need to set the size of around 1200 × 675 pixels or an aspect ratio of 16:9. For multiple infographics with multiple images, set the size to 1200 × 675 pixels.
If you are posting an infographic for events, blog posts, events, and company news on Google, the recommended size for infographic Google posts is 1200 × 900 pixels with an aspect ratio of 4:3. For the SERP display, the size setting for your infographic should be 230 × 130 pixels and for the desktop display, the size should be 404 × 303 pixels.

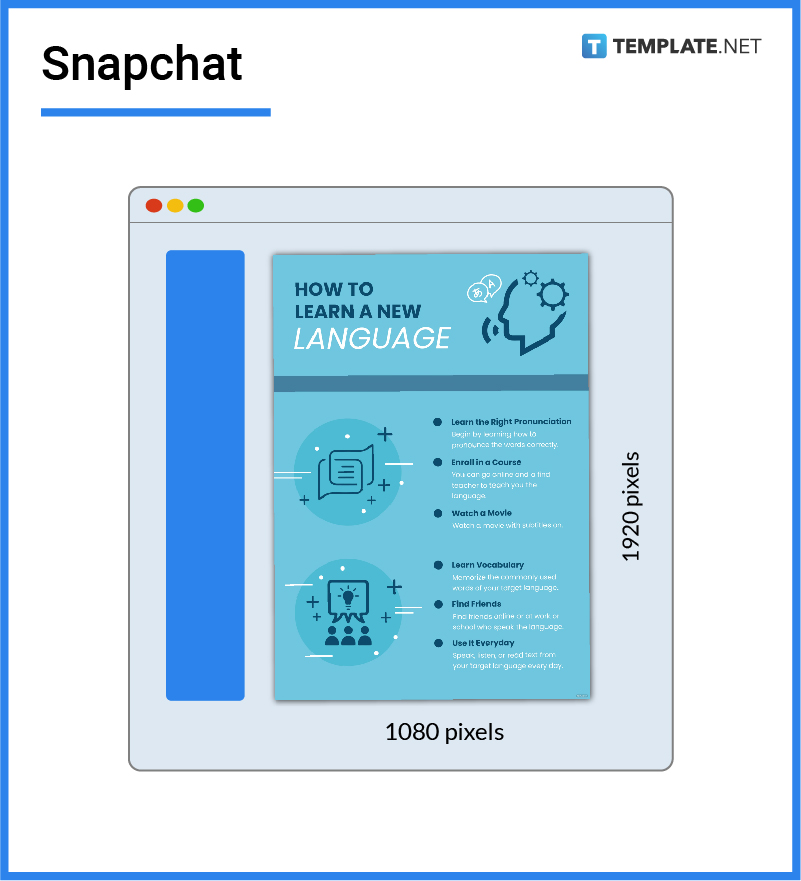
For the Snapchat infographic ad, the recommended image size is 1080 × 1920 pixels. It should have an aspect ratio of 9:16.
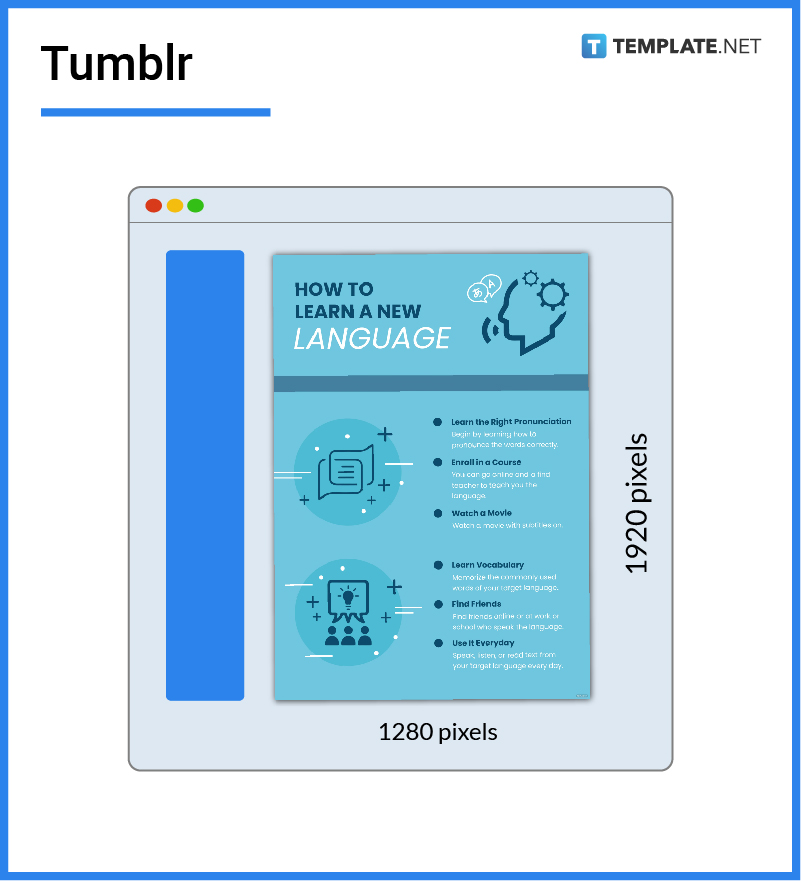
The recommended infographic size for a shared image post on Tumblr is 1280 × 1920 pixels. The minimum size is 540 × 810 pixels and the aspect ratio is 2:3.
Printed infographics are mainly used for advertisements, campaigns, education, and many other purposes. The recommended sizes for printed infographics are 8.5 × 11 inches for letter size, 8.8 × 14 inches for legal size, 7 × 10 inches for executive size, 11 × 17 inches for a tabloid, 4 × 6 inches for a photo, 8.3 × 11.7 inches for A4 and 11.7 × 16.5 inches for A3.
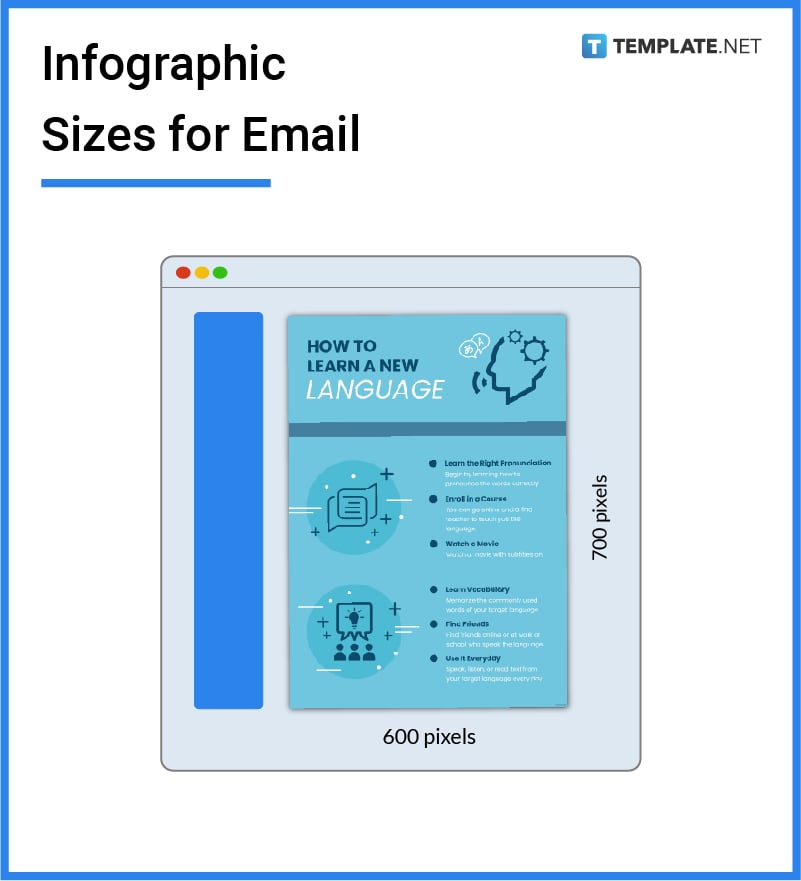
You need to use the right size for your infographic when you send it through email. The ideal infographic size for email is 600 × 700 pixels on a desktop and 320 × 385 pixels on a mobile phone. For infographic email newsletters, the recommended dimensions are 600 × 650 pixels.
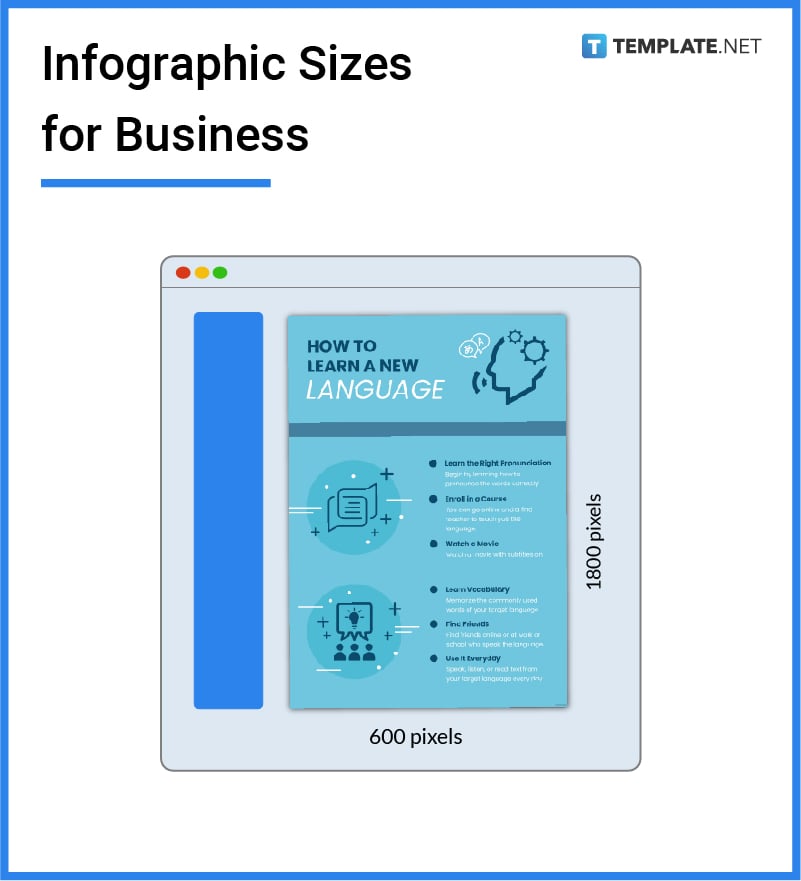
Many business firms use all sorts of digital and printed infographics for marketing and promotional purposes. Typically, the recommended size of their infographic posts on various social media platforms should be 720 × 720 pixels with a maximum file size of 5 MB. For their blogs and websites, the ideal infographic dimensions are 600 × 1800 pixels, while they commonly use letter and A4 sizes for printed infographics.
When you create an infographic with Adobe Photoshop, the size that you will set in your infographic depends on how and where you will use it. For example, if you will make an infographic post for your clothing business blog or travel website, simply adjust the size of your canvas to 600 × 1800 pixels.
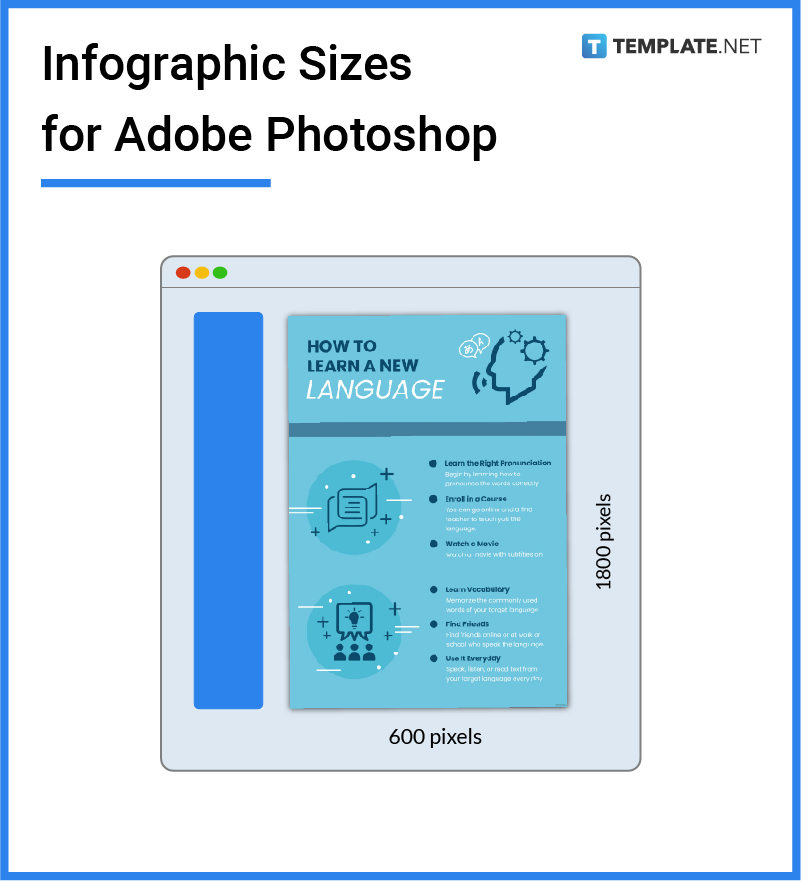
Make sure that the width of your infographic digital vector art must be between 600 pixels × 1800 pixels. For vertical infographic vector art, the recommended size should be between 1100 pixels × 1800 pixels. Select the RGB color mode and an image screen quality of 72ppi.
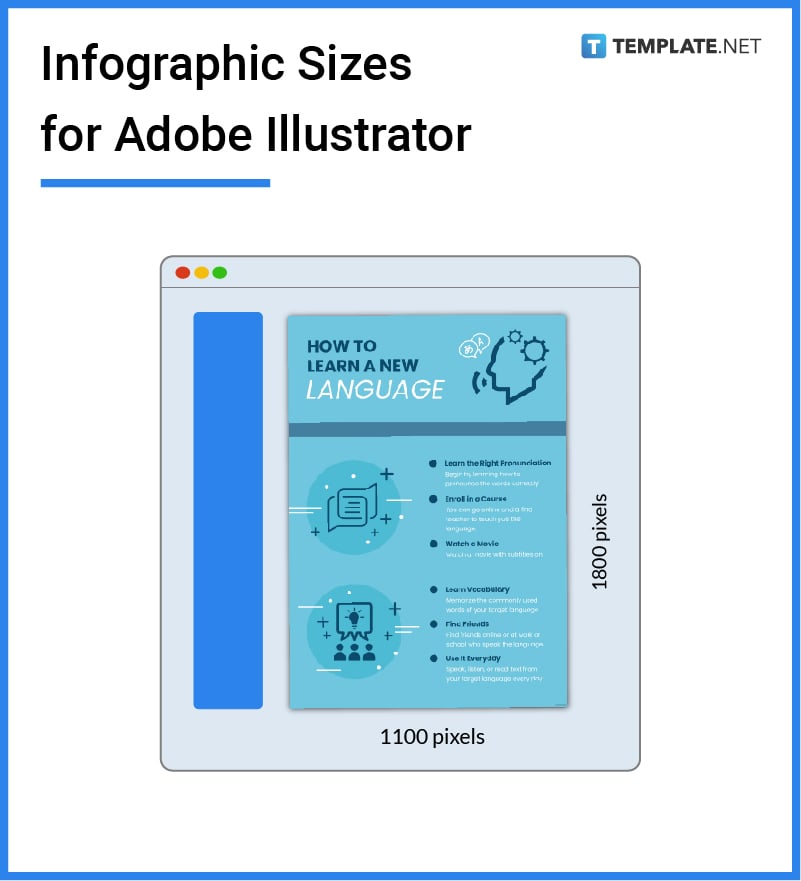
The standard size of an infographic is usually A4 or letter size for printed and at least 1920 pixels wide and up to 2000 pixels long for digital or social media posts.
Select the size from the top toolbar and check the scale content on resize and then set the correct size you prefer in the scale.
The ideal size of the infographic in PowerPoint is 6.5 × 50 inches or 16.51 × 127 cm.
The common infographic size in inches is the letter size, which has a measurement of 8.5 × 11 inches.
Use the block settings to the left of the canvas and modify the dimensions of your infographic according to your needs and preferences.
The icons in the infographic visually represent the text while being minimalistic as they signify key points and label charts or graphs.
An academic infographic is a type of infographic material that tells a story of your academic research work visually on social media platforms, conferences, and other events.
An infographic typically doesn’t have a height limit as it depends on its use and purpose, or how it will be presented to the public.
An infographic format is the basic structure or outline of the infographic or it also pertains to the type of file format in which the infographic is created or saved.
The recommended size of an infographic post on social media is 720 × 720 pixels with a file size maximum of 5 MB.
An infographic’s structure typically includes subheadings, supporting sentences, and compelling data visualization elements like icons, charts, graphs, and tables.
![How To Make/Create an Invitation in Google Docs [Templates + Examples]](https://images.template.net/wp-content/uploads/2023/07/How-To-Make_Create-an-Invitation-in-Google-Docs-Templates-Examples-788x443.png)
To formally invite someone or a group of people to an event or activity, you will need to send out…
![How To Create an ID Card in Google Docs [Template + Example]](https://images.template.net/wp-content/uploads/2023/07/How-To-Create-an-ID-Card-in-Google-Docs-Template-Example-788x443.png)
ID cards are used as a way to represent an individual to the company or organization they work or volunteer…
![How to Make an ID Card in Microsoft Word [Template + Example]](https://images.template.net/wp-content/uploads/2023/07/How-to-Make-an-ID-Card-in-Microsoft-Word-Template-Example-788x443.png)
ID cards are an essential part of any employee working for a company or an organization to be recognized as…
![How To Make/Create a Book Cover in Google Docs [Templates + Examples]](https://images.template.net/wp-content/uploads/2023/07/How-To-Create-a-Book-Cover-in-Google-Docs-788x443.png)
Aside from protecting a book, book covers are specifically designed to attract readers and convey the essence of the book.…
![How To Make/Create a Book Cover in Microsoft Word [Templates + Examples]](https://images.template.net/wp-content/uploads/2023/07/How-To-Create-a-Book-Cover-in-Microsoft-Word-788x443.png)
A book cover is the outer layer of a book that is used to protect its contents. Book covers are…

Job vacancy is a common scenario in companies and organizations. Employees leave for all kinds of reasons and when they…
Save the date sizes are usually the same size as a formal invitation. But there are a number of different…
Script is a popular word that is frequently used in the entertainment world. There are a variety of areas and usages…

Presentations may not look as pleasant as how you design them with pictures, animations, videos, and other graphic designs without…