How to Connect Access with Microsoft SharePoint
Microsoft SharePoint is one of the products within the Microsoft product suite where you can access more applications integrated into…
Aug 16, 2022


Dec 06, 2023
Microsoft Excel is one of the top spreadsheet applications in the software industry, with 750 million regular users. It was developed by Charles Simonyi and was released by the Microsoft Corporation in 1985, exactly two years after the release of Microsoft Word.

Microsoft Excel is a spreadsheet program developed by Microsoft. Like all other spreadsheet apps, Microsoft Excel has the tools that enable users to organize data in a systematic manner and with the use of formulas. However, its features are more flexible—offering various ways to arrange tables, charts, grids, rows, columns, and other visual aid tools. Microsoft Excel belongs to a family of Microsoft 365 products such as Microsoft Word, Microsoft PowerPoint, Microsoft Publisher, and more.
Microsoft Excel is a product of Microsoft Office that quickly became a powerhouse spreadsheet program with a complete set of spreadsheet editing and customization tools for users to easily create tables, charts, graphs, and grids that organize data cohesively.
Microsoft Excel is arguably most commonly used for creating pivot tables. As a gigantic spreadsheet, it lays the groundwork for pivot table creation. Users won’t have to start from scratch, needing only to adjust the spreadsheet’s rows, columns, and cells.
Microsoft Excel has every tool to create charts and graphs. Users can form them manually by customizing the spreadsheet or inserting MS Excel’s free pre-made charts and graphs.
Microsoft Excel lets users use spreadsheet formulas (addition, subtraction, division, and multiplication), which help calculate accurate results, mirror data from one cell to another, perform a wide-range command, and much more. The challenge is familiarizing yourself with the formulas, but once you’ve mastered them, preparing spreadsheets with statistics becomes a lot easier.
Users can insert comments and notes in MS Excel spreadsheets. It’s a helpful feature for remote collaboration, allowing team members to share their thoughts and provide feedback about specific data in the spreadsheet. In addition, users can add comments and notes in every individual cell of the spreadsheet.
MS Excel allows users to share spreadsheet files anytime and can grant Edit or View access to other users. This helps with remote collaboration, allowing multiple users to access a single Excel file from different devices.

Microsoft Excel is a well-known spreadsheet brand. It’s beloved by countless users for its accessibility and flexibility. That said, it’s safe to say that Excel will remain a top spreadsheet app. So right now, let’s discuss what makes Microsoft Excel special.
As a spreadsheet application, Microsoft Excel is an excellent platform for data management. You can use its tools for creating charts and graphs to organize data and store them for safekeeping. For example, if you’re a teacher, you can use MS Excel to calculate and store your students’ grades for safekeeping.
MS Excel can automatically calculate results and statistics for you. Simply encode the required spreadsheet formulas, and Excel will do the rest. With its calculator features, Excel can produce accurate results, even with large numbers.
Excel has excellent built-in tools for data analysis. With all the rows, columns, graphs, and pivot tables you can create with it, data will be much easier to organize, break down, analyze, and interpret.
Excel also lets users print report documents fast. That’s why many office workers use Excel to prepare their reports. Besides fast printing, Excel offers multiple page setup customization choices before printing an Excel (XLS) file.
Microsoft Excel has free templates for creating monthly budget sheets, schedules, calendars, and more, allowing users to start their spreadsheets quickly.
Nowadays, many teams work remotely and deal with spreadsheets daily. Since MS Excel can be accessed online with its desktop and mobile versions, people choose it as their primary spreadsheet app since they can work together in one Excel spreadsheet in real-time across different locations and devices.
The Title Bar is located at the very top of the MS Excel interface. What it mainly displays is the name or title of the Excel file.
The Menu Bar is found right below the Title Bar. It contains tabs of all the available menus in MS Excel. These menus are the following: File, Home, Insert, Page Layout, Formulas, Data, Review, View, and Help.
The Toolbar is situated below the Menu Bar. There, you’ll be doing a lot of commands such as changing fonts, merging cells, inserting rows/columns, applying cell colors, and many more. The Toolbar changes depending on which tab in the Menu Bar is currently open.
The Row Headings are found on the left side of the MS Excel interface. It’s placed vertically and displays the row numbers starting from 1, 2, 3, 4, and beyond. MS Excel has a limit of 1,084,576 rows.
The Column Headings are located at the top of the Excel spreadsheet or worksheet. It’s placed horizontally and represents the names of the columns, which are letters starting from A, B, C, D, E, F, and so on. MS Excel can accommodate up to 16,384 columns.
The cells are those small rectangles formed due to the intersection of Excel’s columns and rows. This is where users input their data, characters, and formulas in Excel.
The Name Box is located above the Column Headings on the left-most side. It simply displays the cell name you’re currently working on.
The Formula Bar is found just beside the Name Box to the right. It displays the characters you’ve inserted in a cell, specifically in the area you’re currently working on. You can also use the Formula Bar to input data for each cell.
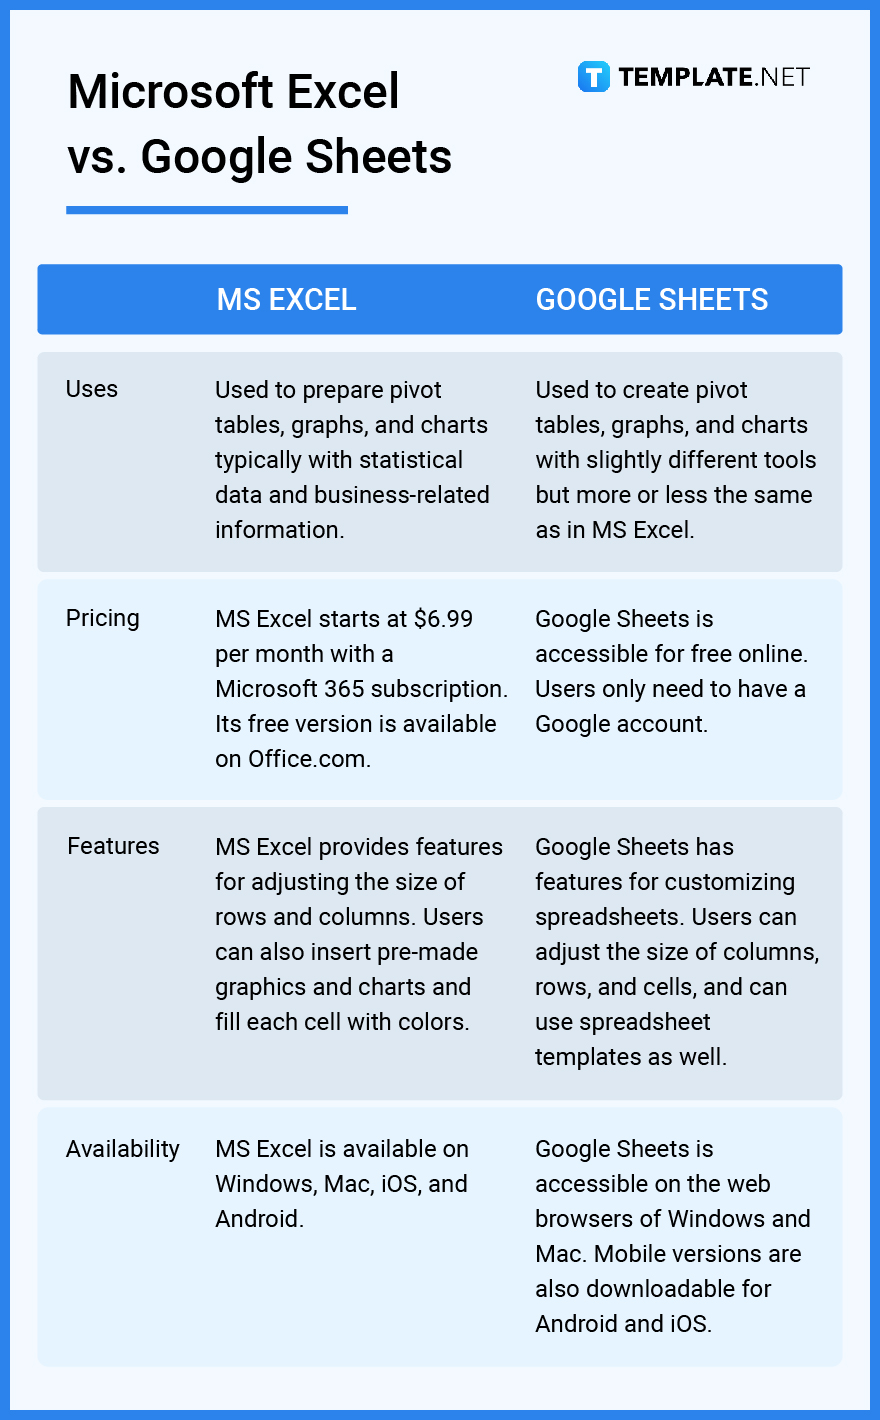
Microsoft Excel is Microsoft’s flagship spreadsheet software product that allows users to create tables, charts, and graphs filled with data and information.
Google Sheets is also a spreadsheet program under the Google Workspace umbrella. It has similar features to MS Excel but with some variations.
Check out the detailed comparison of Microsoft Excel and Google Sheets in the table below.
Microsoft Excel is a user-friendly spreadsheet program. In terms of creating tables, graphs, and charts, the things you can do with Excel are practically limitless—no need for thorough user training. With that said, we’ll share with you our basic MS Excel tips and tricks.
If you’re on a tight budget, don’t worry. Microsoft Excel has a free edition that you can get at any time. Just follow our guide on how to get Microsoft Excel for free.
If you don’t have Microsoft Excel on your computer yet, you should download and install it today. Simply follow the easy steps on how to download Microsoft Excel, and you’ll soon have it on your device.
Excel has everything you need to create comprehensive flowcharts. Our guide on how to make a flowchart in Microsoft Excel will show you the step-by-step process.
You can open your Excel files in Google Sheets if needed. The steps on how to transfer Microsoft Excel to Google Sheets are easy to follow. Check out our guide to get started.
Users can open their MS Project files on MS Excel. Go over each step of our guide on how to export from Microsoft Project to Excel to do it right.
Cells in MS Excel can be split easily when you master the process of how to split a cell in Microsoft Excel. See our guide and try these steps yourself.
Checklists can be used for various purposes, either for work, school, or personal agendas. So if you have time, you should learn how to create a checklist in Microsoft Excel.
If you have some existing Excel files that need revisions, go ahead and do them before the deadline. Learn how to edit in Microsoft Excel so that you can start ASAP.
Learn how to graph on Microsoft Excel and create all kinds of charts and pivot tables according to your needs.
MS Word and MS Excel can be integrated. So, familiarize yourself with our guide on how to insert/update Microsoft Word into Excel.
MS Excel can do basic and advanced multiplication calculations for you. Learn how to activate it in our guide about how to multiply in Microsoft Excel.
If you need to print labels, you can create and get them from MS Excel. Be guided on the steps on how to print labels from Microsoft Excel to do it right.
You’ll commit small mistakes as you create documents in MS Excel. Luckily, you can fix them quickly with the undo/redo function. So make sure to learn how to undo/redo in Microsoft Excel.
If you’re a Mac user, you can try using MS Excel instead of Apple Numbers. See our guide on how to get Microsoft Excel on Mac.
For sure, you’ll be using numerical characters in your Excel files. With that said, you should know how to add numbers in Microsoft Excel.
Be a master MS Excel user by reading our guide about how to become proficient in Microsoft Excel.
MS Excel has all the tools you need to create data entry forms. Learn how to take advantage of them by seeing our guide about how to create data entry forms in Microsoft Excel.
Sometimes, we need to freeze certain cells in a spreadsheet. You can learn to do that simply by learning how to freeze cells in Microsoft Excel.
If you’re an architect or floor planner, MS Excel can be a good substitute for creating floor plans. Check out our simple guide on how to make a floor plan on Microsoft Excel.
You can merge as many cells as you want in your spreadsheet. If you’re not sure how to do it, just see our short guide on how to merge cells in Microsoft Excel.
You can make a bar chart in your spreadsheet simply by reading our short article on how to make bar chart in Microsoft Excel.
Microsoft Excel provides basic ways to calculate percentages. You can learn this by looking at our guide on how to calculate percentage in Microsoft Excel.
You can keep your spreadsheet’s readability by wrapping your text in Microsoft Excel. Take some time to read our guide on how to wrap text in Microsoft Excel to take your spreadsheets to the next level.
Microsoft Excel’s worksheet Hiding and Unhiding features can be a quick and simple way to secure data or free up some tabs. Carefully follow our step-by-step guide on how to hide/unhide worksheets in Microsoft Excel to do it correctly.
You can add as many columns as you need in your Excel spreadsheet. Just follow the steps we’ve gathered on how to add a column in Microsoft Excel.
Rows can be added virtually without limits in Excel. Once you learn the steps on how to add a row in Microsoft Excel, you can expand your spreadsheet anytime.
Want to change the language settings in Excel? If you do, we invite you to read our simple guide on how to change language in Microsoft Excel.
You can attach drop-down lists to your Excel spreadsheets. They’ll come in handy in creating data entry forms. But first, learn how to create a drop-down list in Microsoft Excel.
If you need a pie chart for your presentation, you can make one in Excel. Visit our guide about how to create a pie chart in Microsoft Excel so you can start soon.
Learn how to create a table in Microsoft Excel to make pivot tables quickly.
It’s possible to attach pictures to your spreadsheet. Just explore the steps on how to insert picture in Microsoft Excel to get started.
It would be convenient to use Excel to fill out PDF forms. So, learn how to automatically fill PDF forms using Microsoft Excel for a smooth-sailing data entry process.
If you lost an unsaved Excel file, don’t panic. See our guide on how to recover unsaved Microsoft Excel files.
With MS Excel, you don’t have to use your calculator to find the mean of your numerical dataset. Learn the process in our guide on how to calculate mean in Microsoft Excel.
Gannt charts are excellent visual aid tools. That said, you should learn how to create a Gantt chart in Microsoft Excel.
Symbols are certain characters users can insert into an Excel spreadsheet with the help of the Insert tab.
Relative cell references change when formulas are copied to other cells, while absolute cell references remain as they are regardless of where they’re being copied.
The three types of data in Excel are text, number, and logical.
The max number of rows in Excel is 1,084,576.
The wildcards available in Excel are an asterisk, question mark, and tilde.
The F1 to F12 keys in Excel function as shortcut keys to perform certain commands faster.
Simply press F11 to create a chart on a new spreadsheet in Excel.
A cell address is the name of a cell, which is basically a combination of the column letter and row number.
Simply go to View, click Windows, and select Freeze Panes.
The name box displays the name of the cell you’re currently working on.

Microsoft SharePoint is one of the products within the Microsoft product suite where you can access more applications integrated into…
Finding a product key for the Microsoft Visio software only takes a few clicks and doesn’t require a diagrammed process.…
With Microsoft Visio, collaborating and editing drawings online is entirely possible. In addition to that, templates and various selections of…
Microsoft Publisher is an easy-to-use publishing software application that users in this DIY age can optimize to produce digital content…
Access Microsoft Visio on your PC or mobile device to graphically arrange complicated concepts. Begin your Visio projects with hundreds…
Flattening an image means reducing the file size of the image, which will make saving and printing much easier. So,…
Microsoft Visio lets you create professional diagrams and flowcharts for various purposes and occasions. It also enables you to collaborate…
Knowing the version of Microsoft Publisher installed on your computer is also helpful when downloading templates and add-ins because some…
Microsoft Visio is an excellent tool and application for creating visual representations of flows and processes using creative and beautiful…