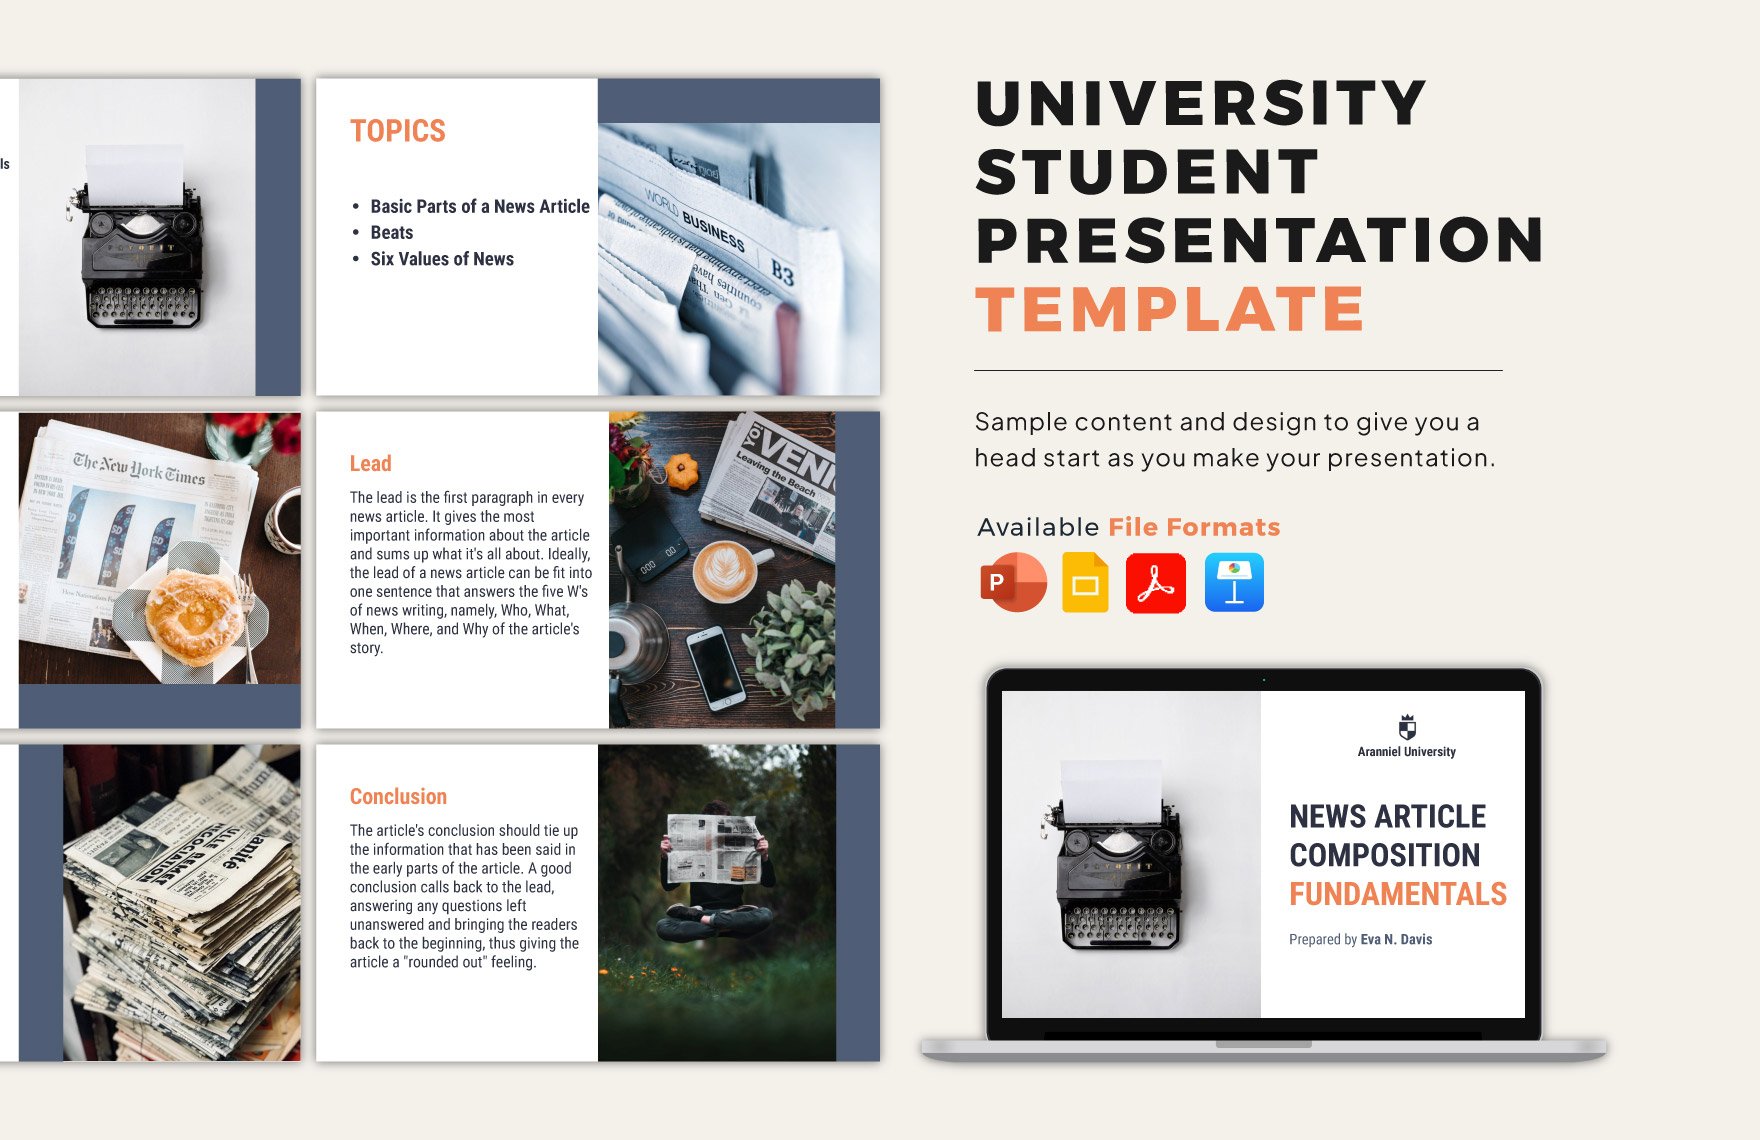
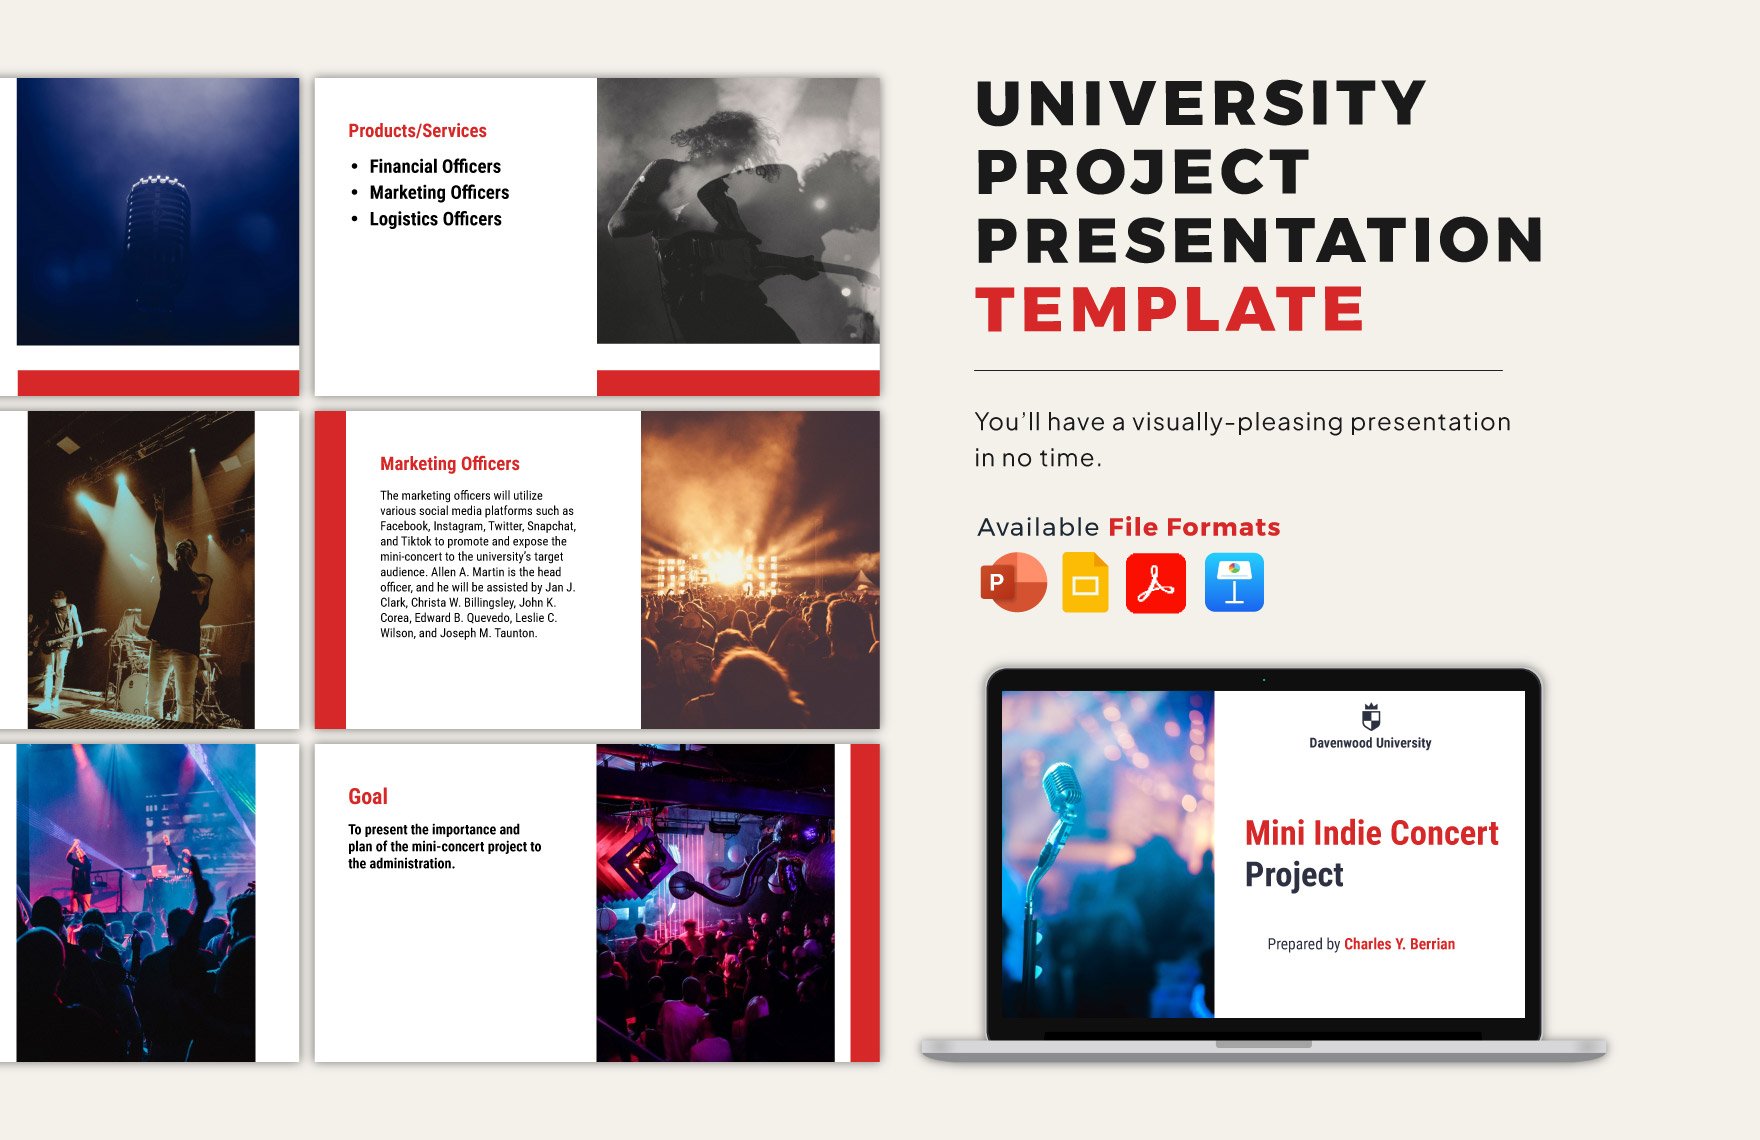
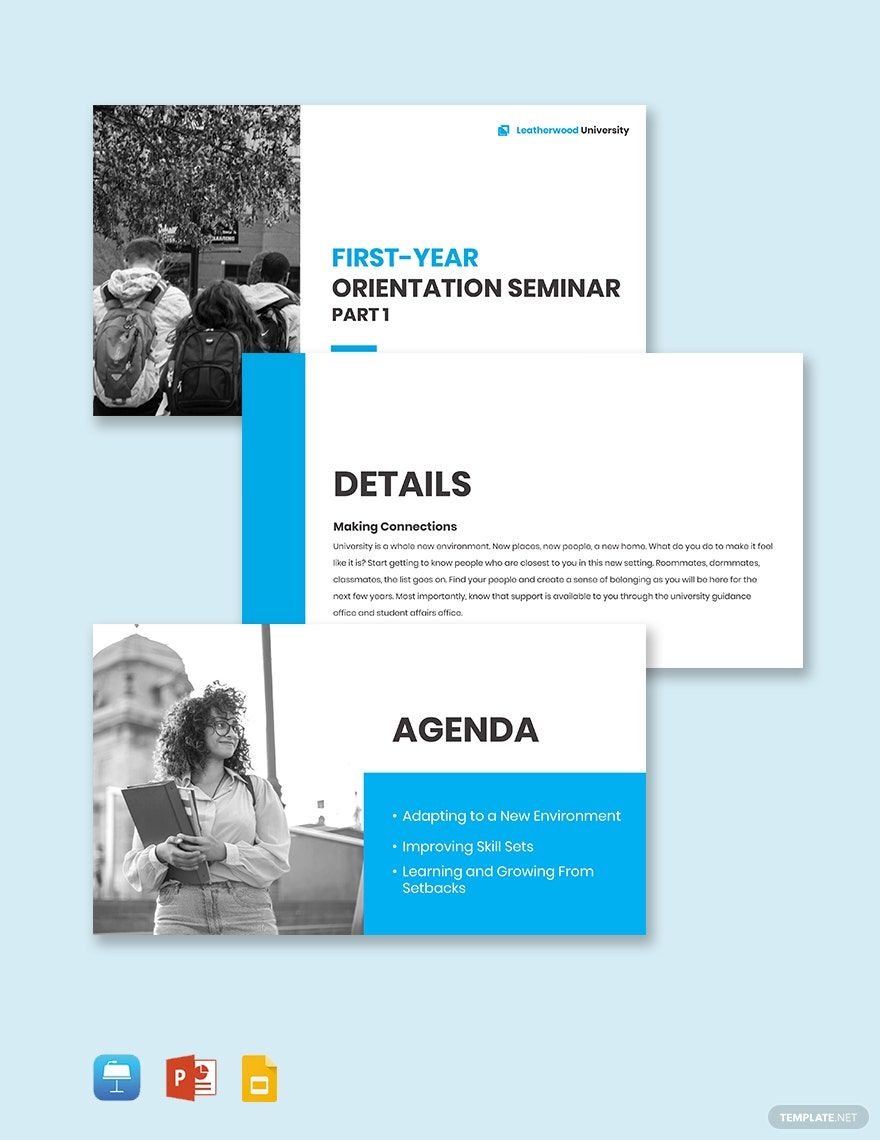
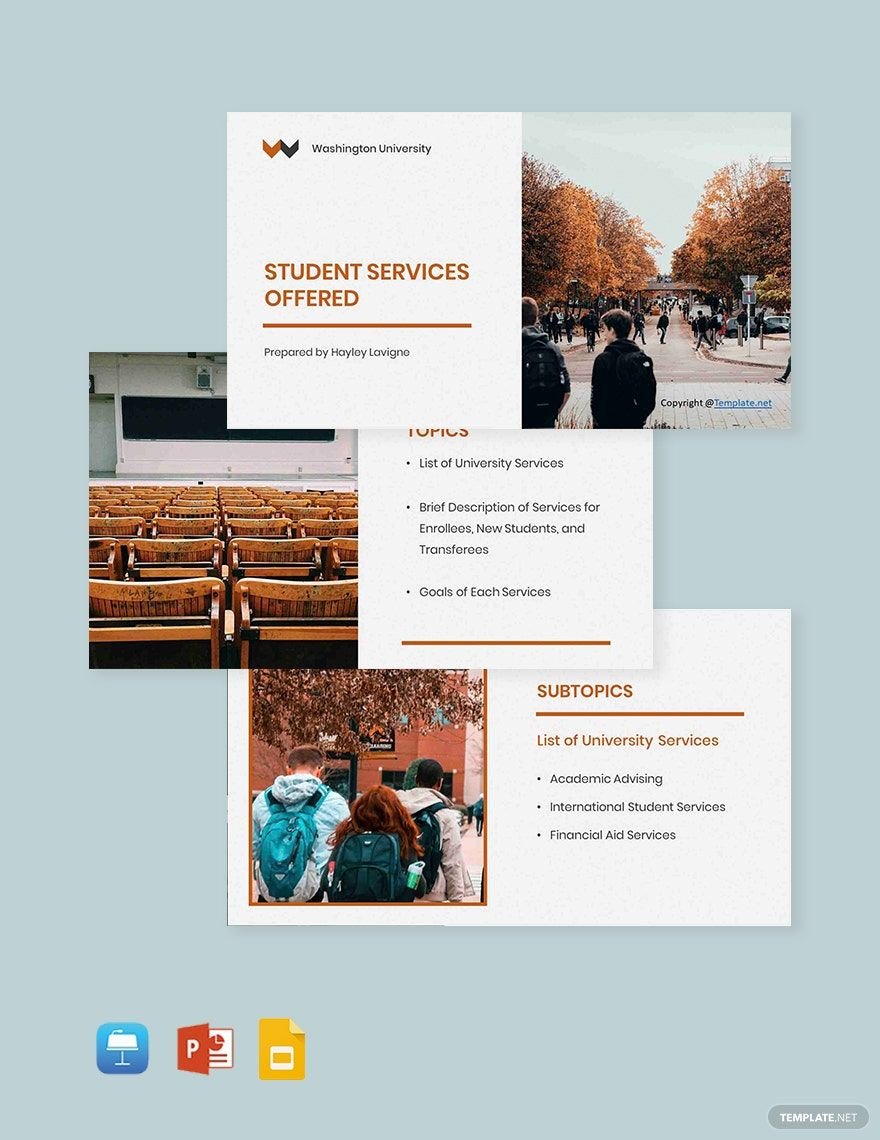
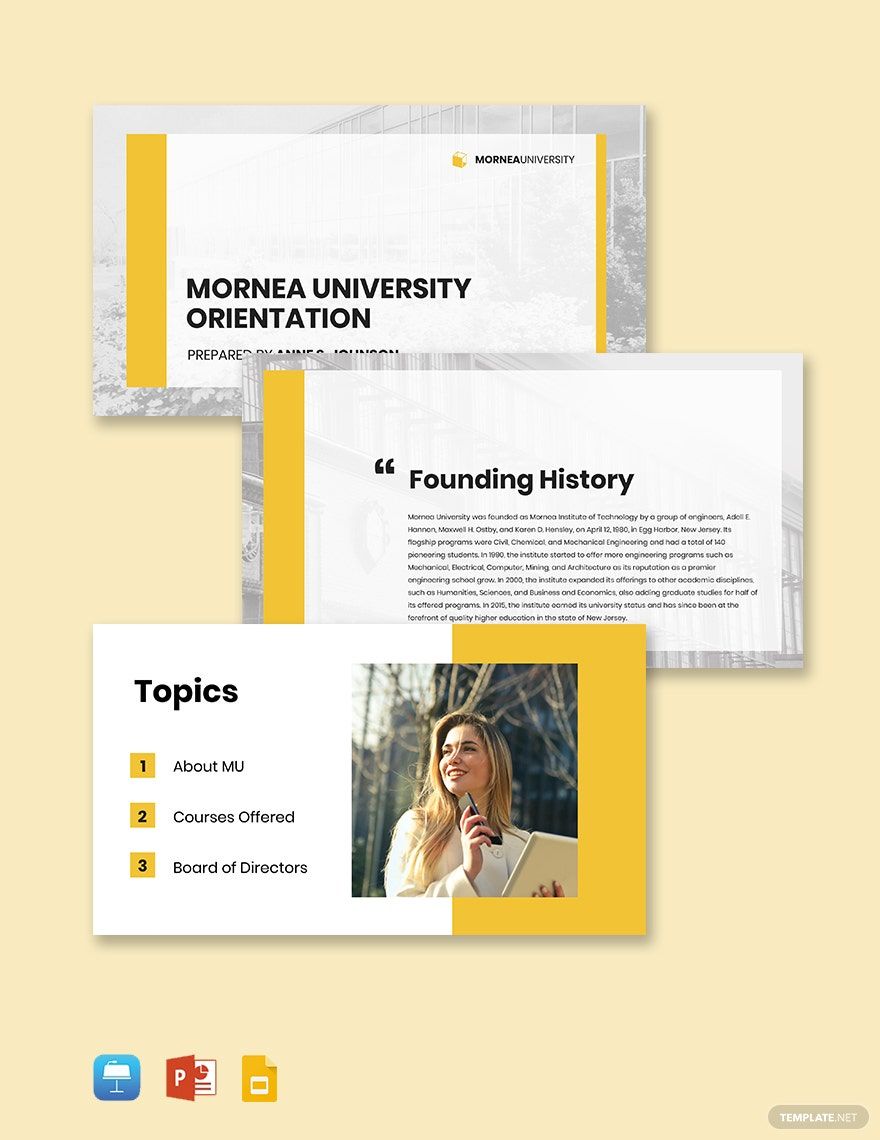
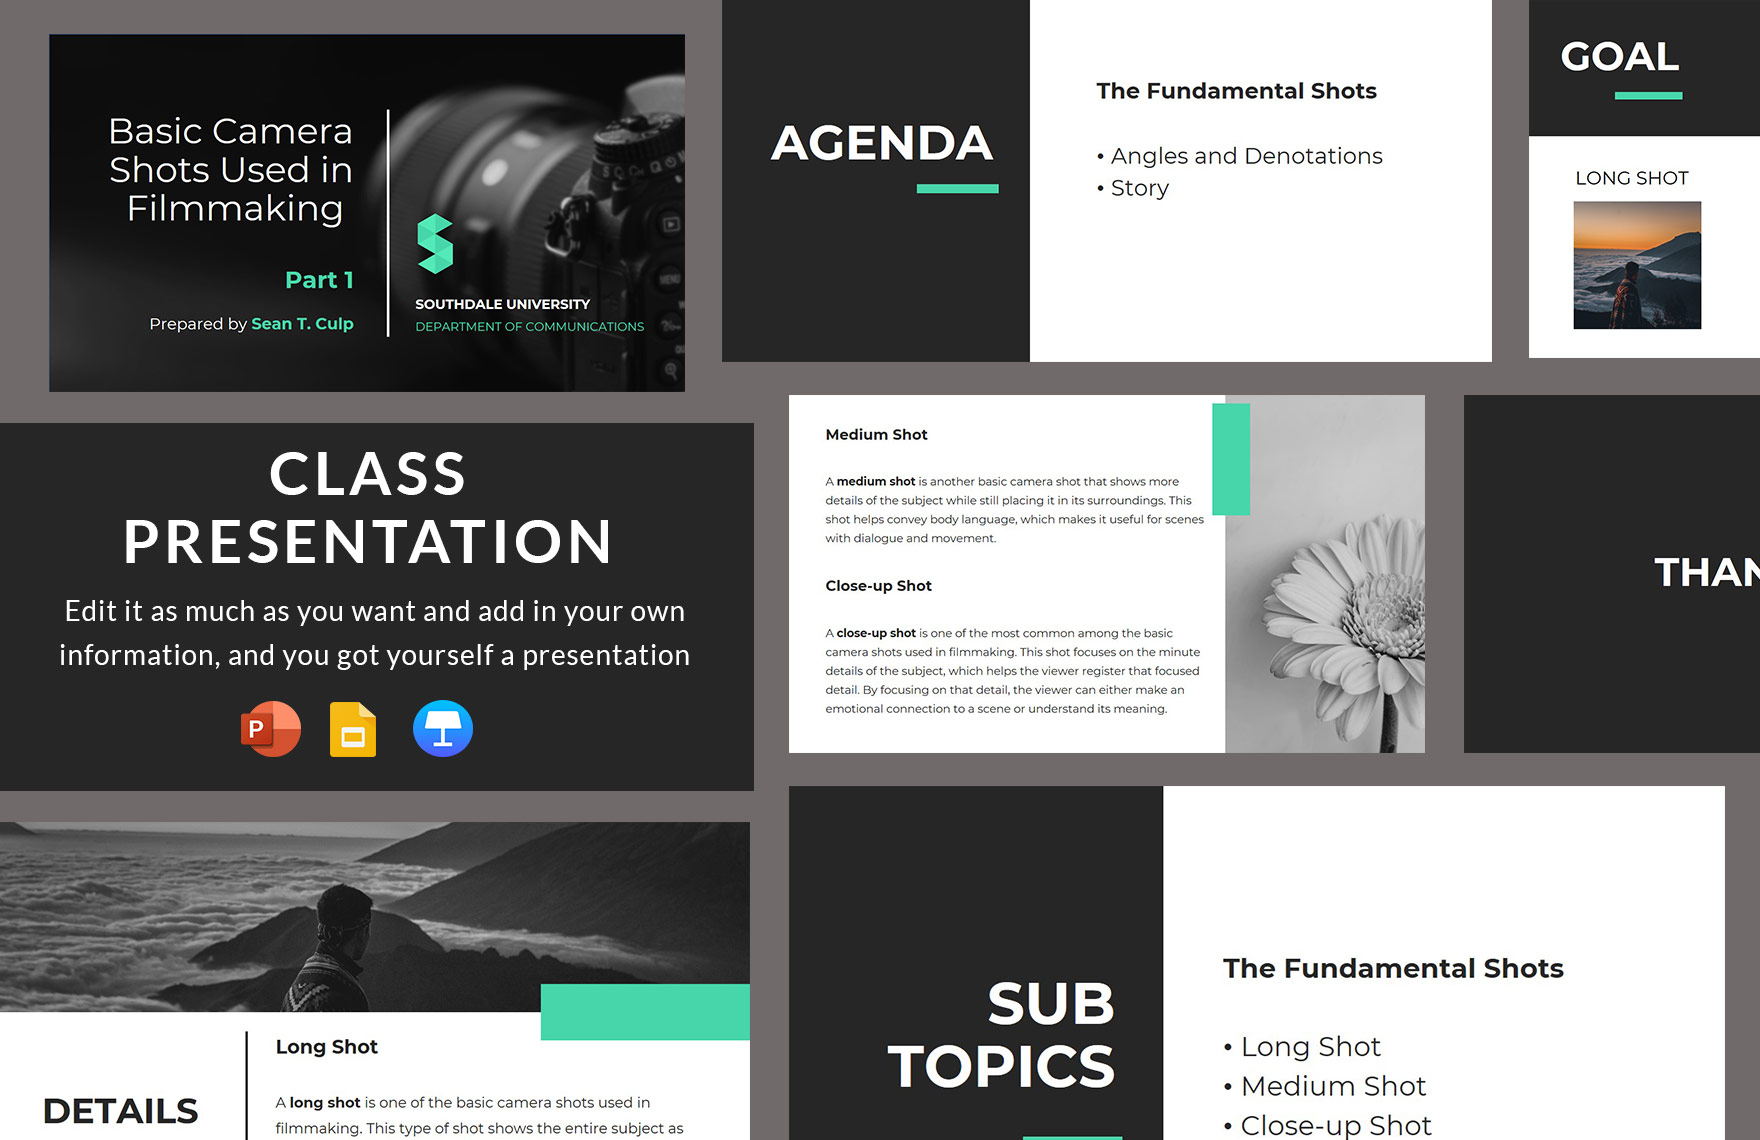
Presentations take more time to make since the content should have a tailored approach for the viewers. You need to do extensive research for it to become more accurate. If you need to make one in the shortest amount of time, our University Presentation Templates are a handy collection that you can avail! The templates are 100% editable and customizable. They're available in PowerPoint, Pages, and Google Slides as well. The original content gives you ideas in creating your presentation without any hassle. Score the best deals by downloading our templates now!
How to Create a University Presentation?
A university presentation is a document that students and staff make to present a topic. These types of documents are also used to introduce the university to new students.
Presentations come in handy when you need to present a topic at school. The features in applications you choose to make it on are convenient for you. If you need to create one for your class, read our tips below.
1. Decide on a Topic
You can't make a proper presentation without a topic in mind. Determine the kind of topic that you want to tackle. Almost all presentations are informative, and these help a lot during lectures. Create a list of possible subtopics from your main topic.
2. Research the Facts
Get relevant information based on your list of topics and subtopics. Make an outline of all the information that you have gathered—from facts, statistics, and other useful data. If you're working with a group for your presentation, it's easier if you assign each member a topic to research on.
3. Write Content
Open a blank slide and start writing your content. Begin with a catchy introduction. You can use a video, a quote, an iconic poster, or a historical fact to kickstart your presentation. Statistics work better when you're making an academic presentation. Just write the content in the simplest manner possible.
4. Add Details
It's not just content that adds beauty to the presentation. The details also contribute a lot as well. Add graphics and colors to your presentation. Use tables, pie charts, and diagrams to present statistical data accurately. Doing so will make viewers understand your topic better.

