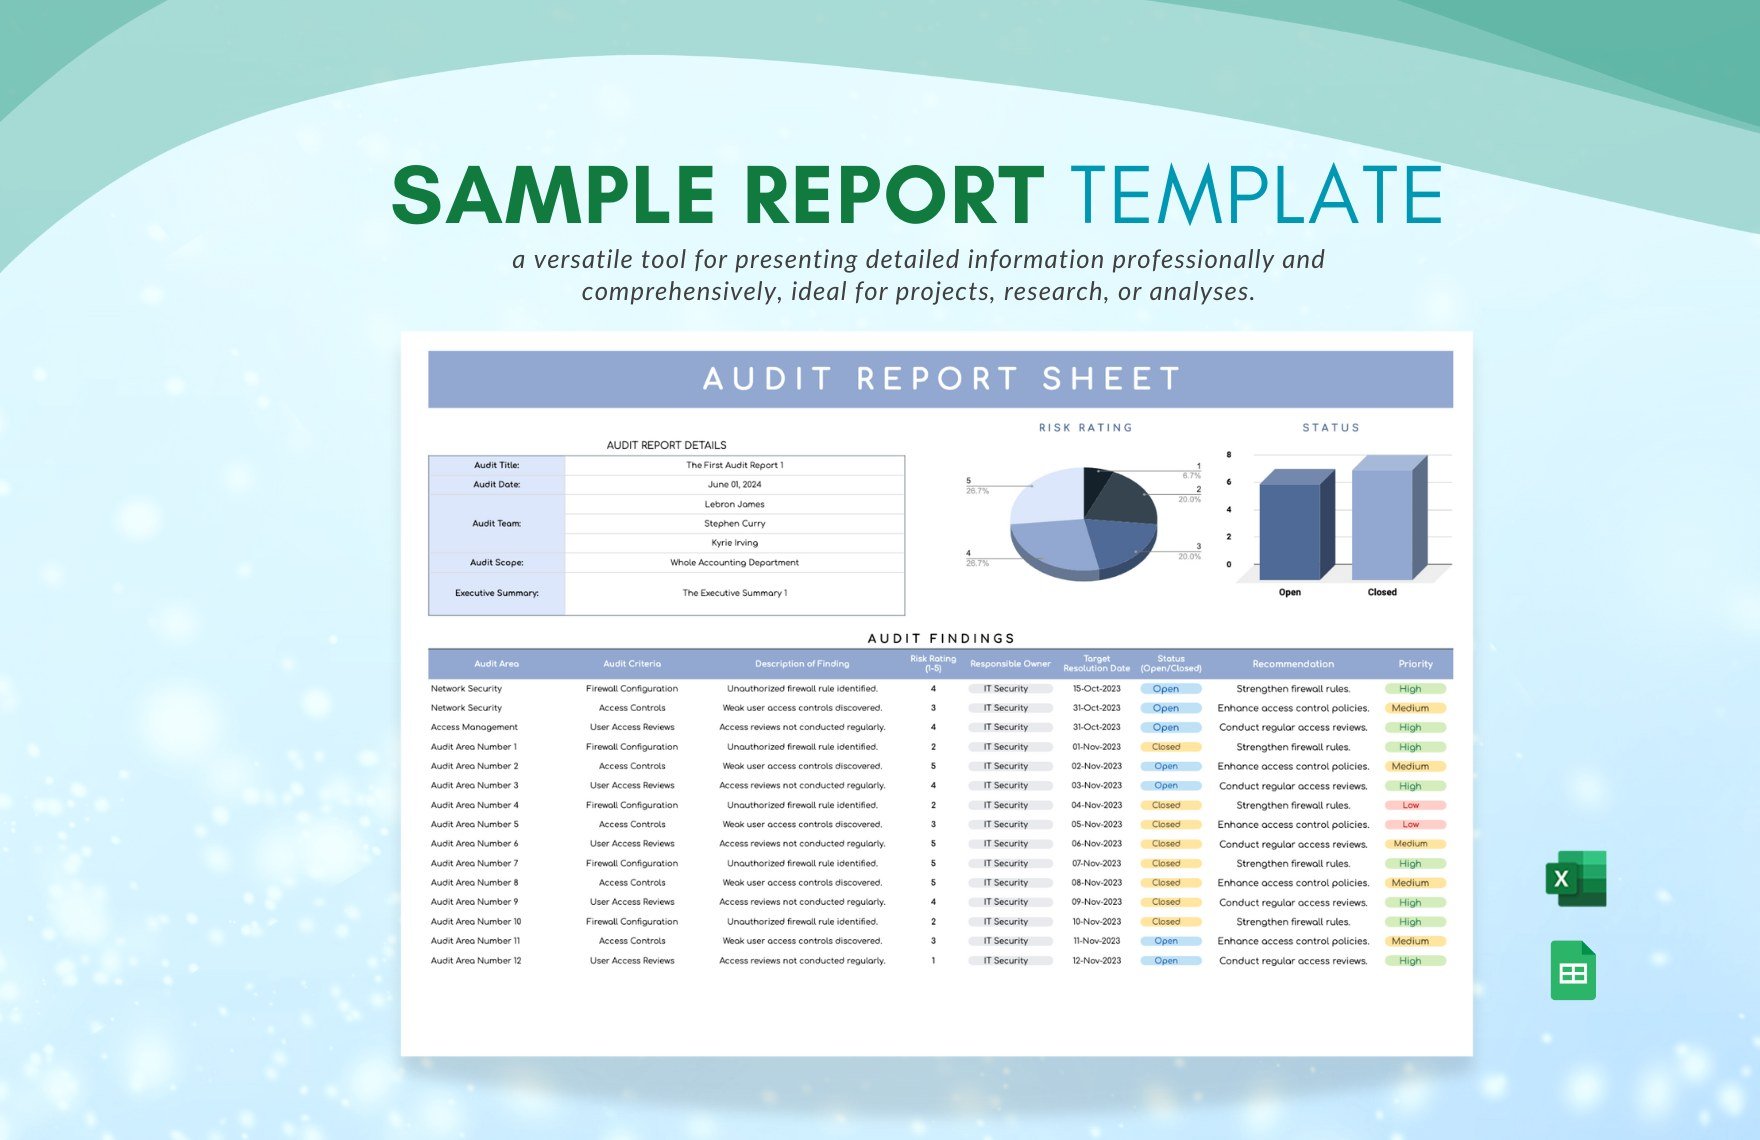
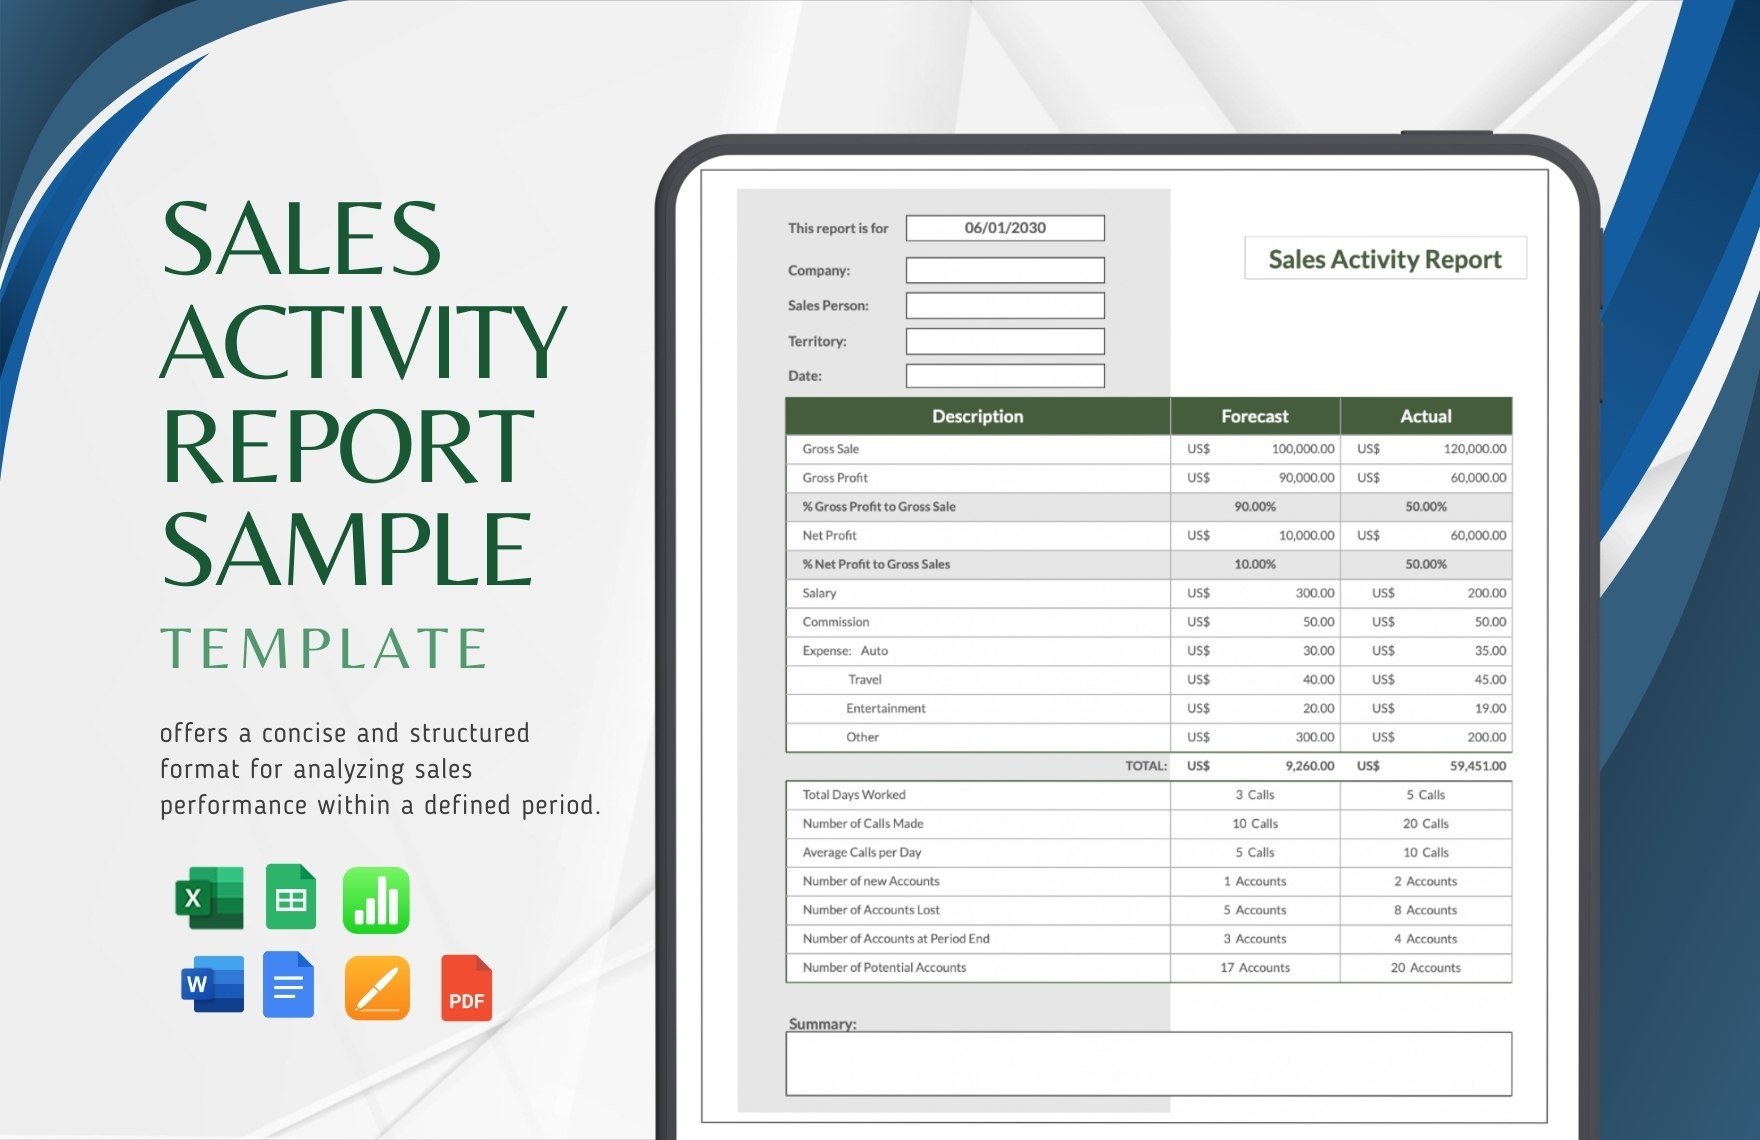
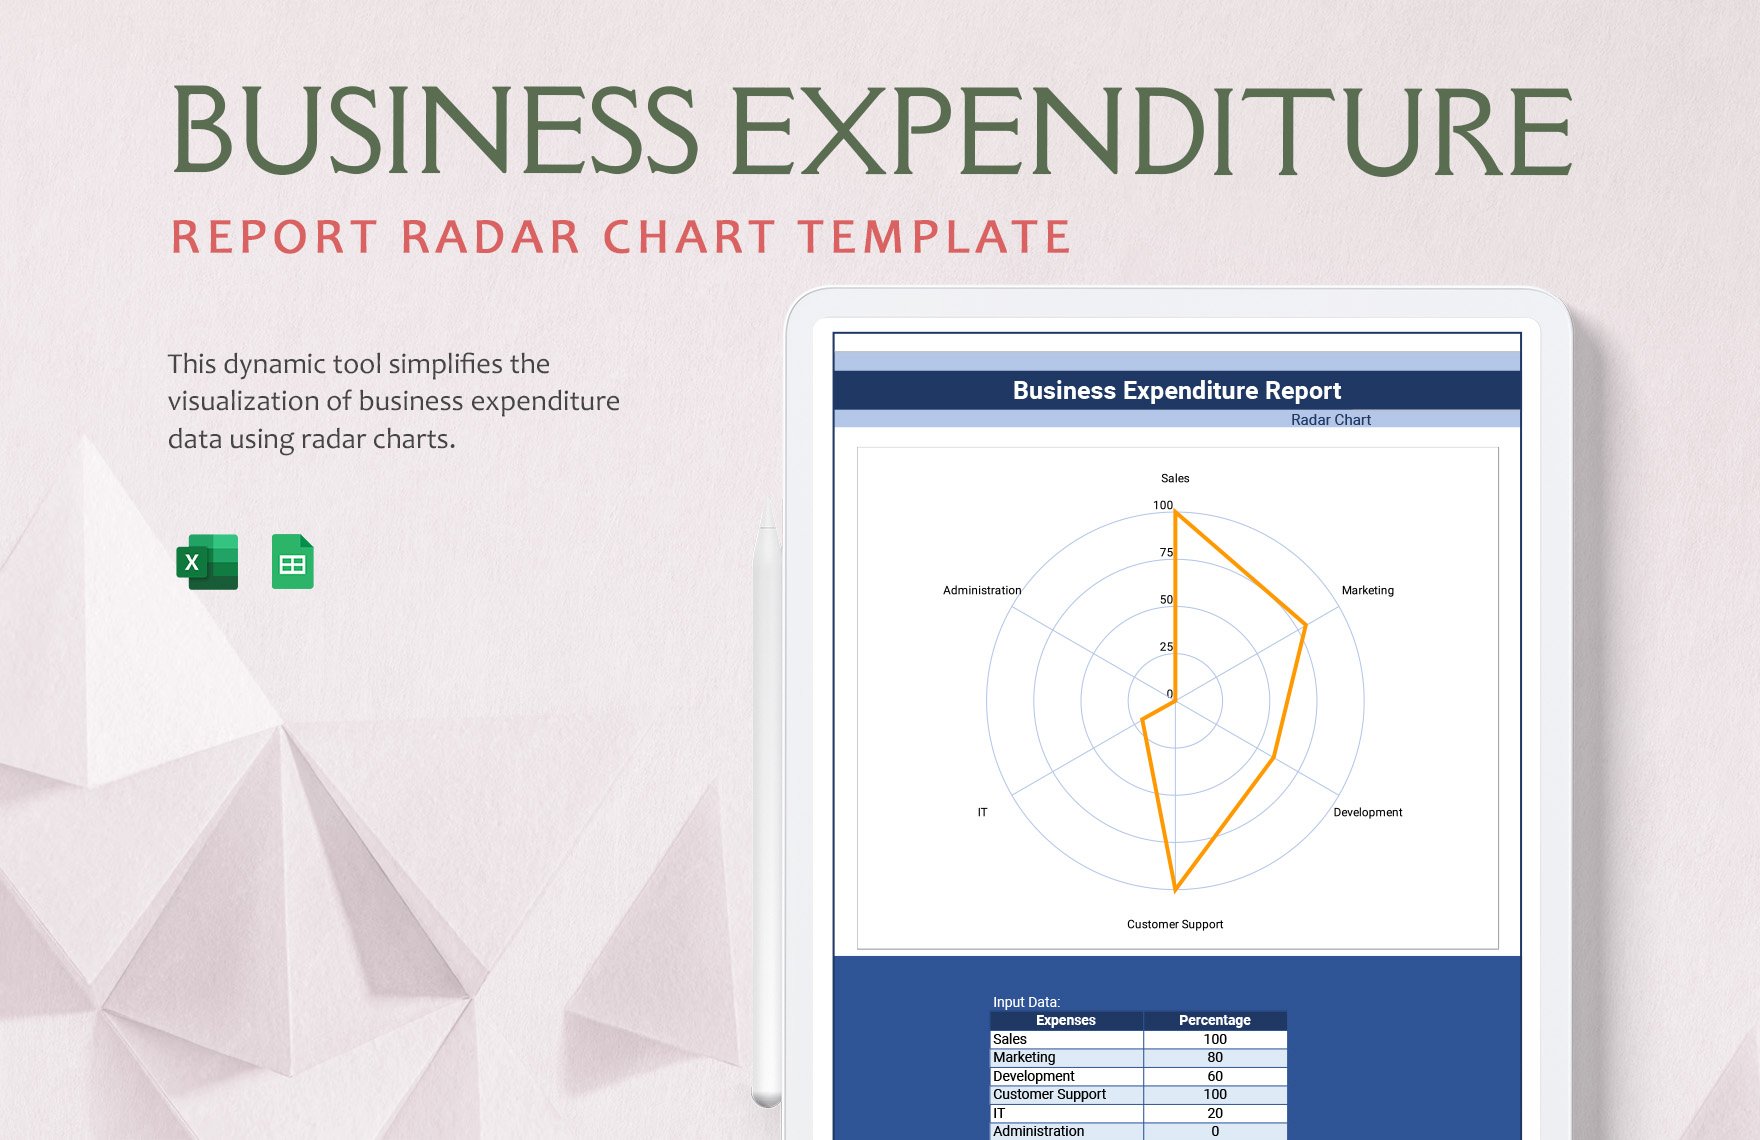
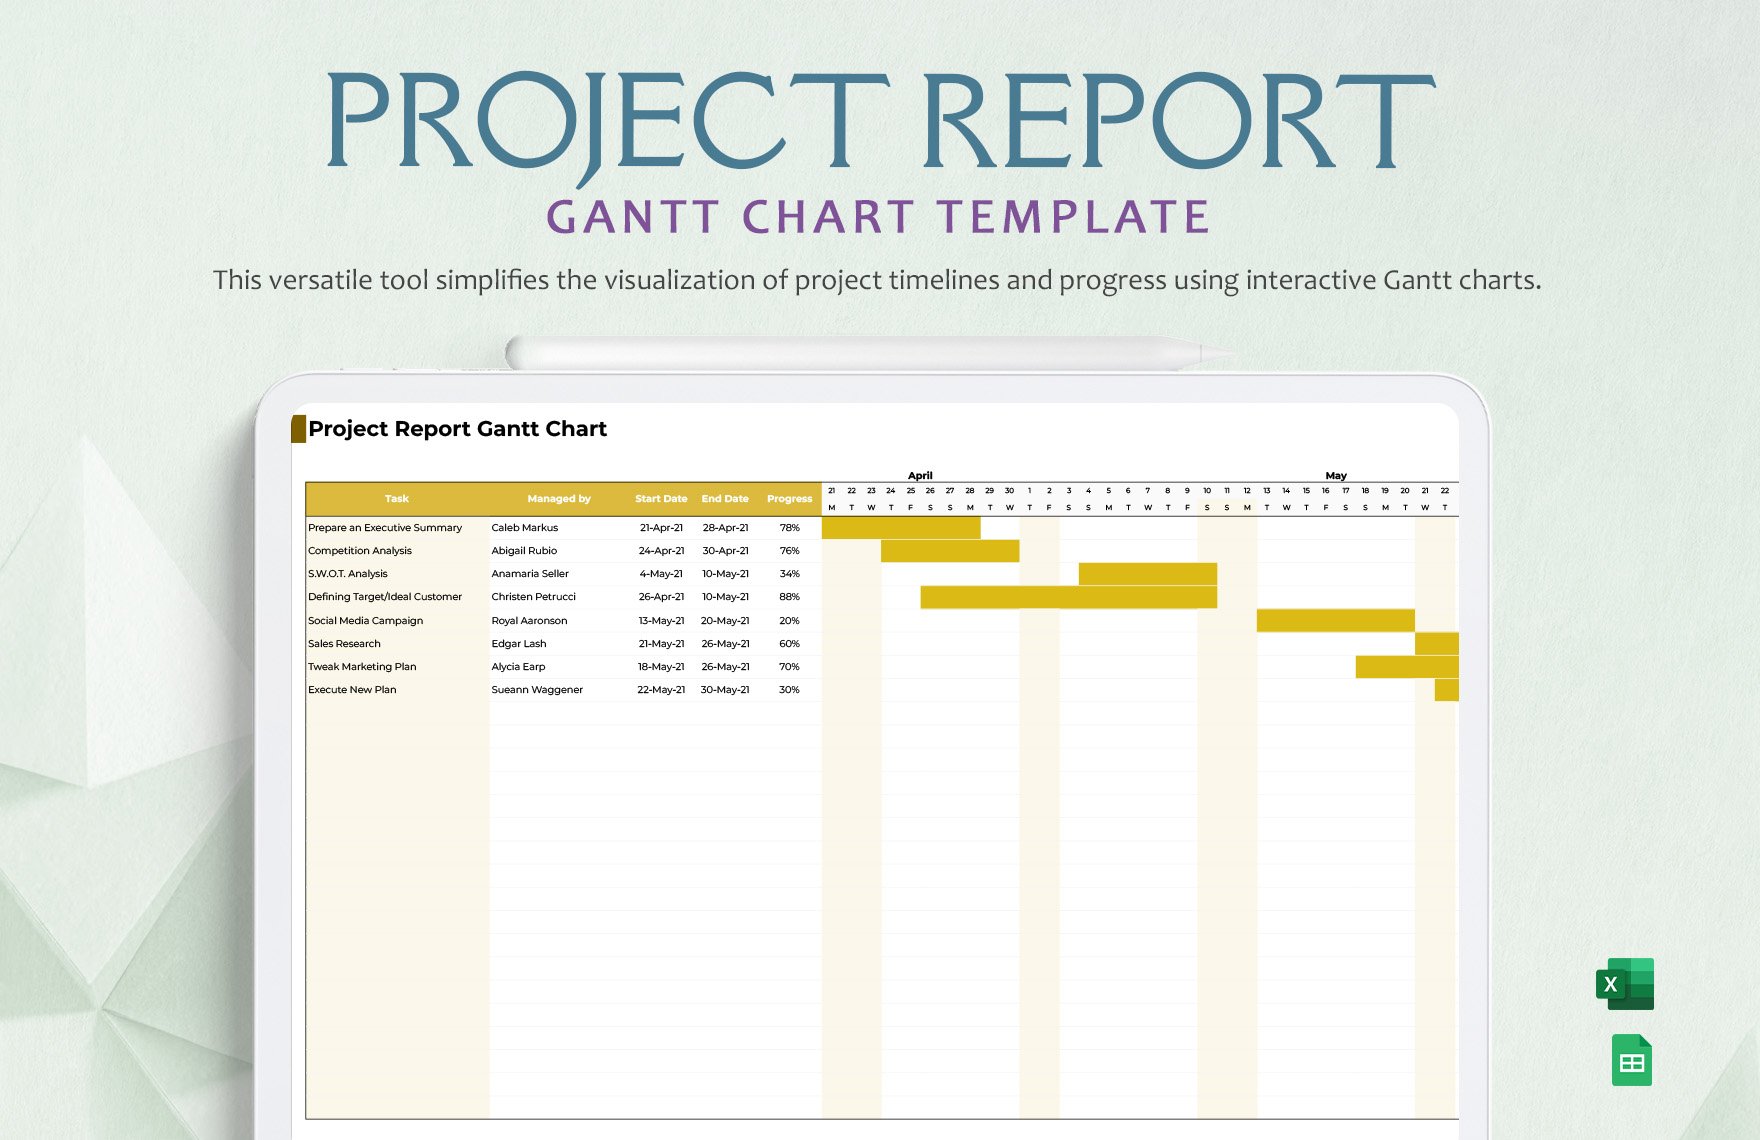
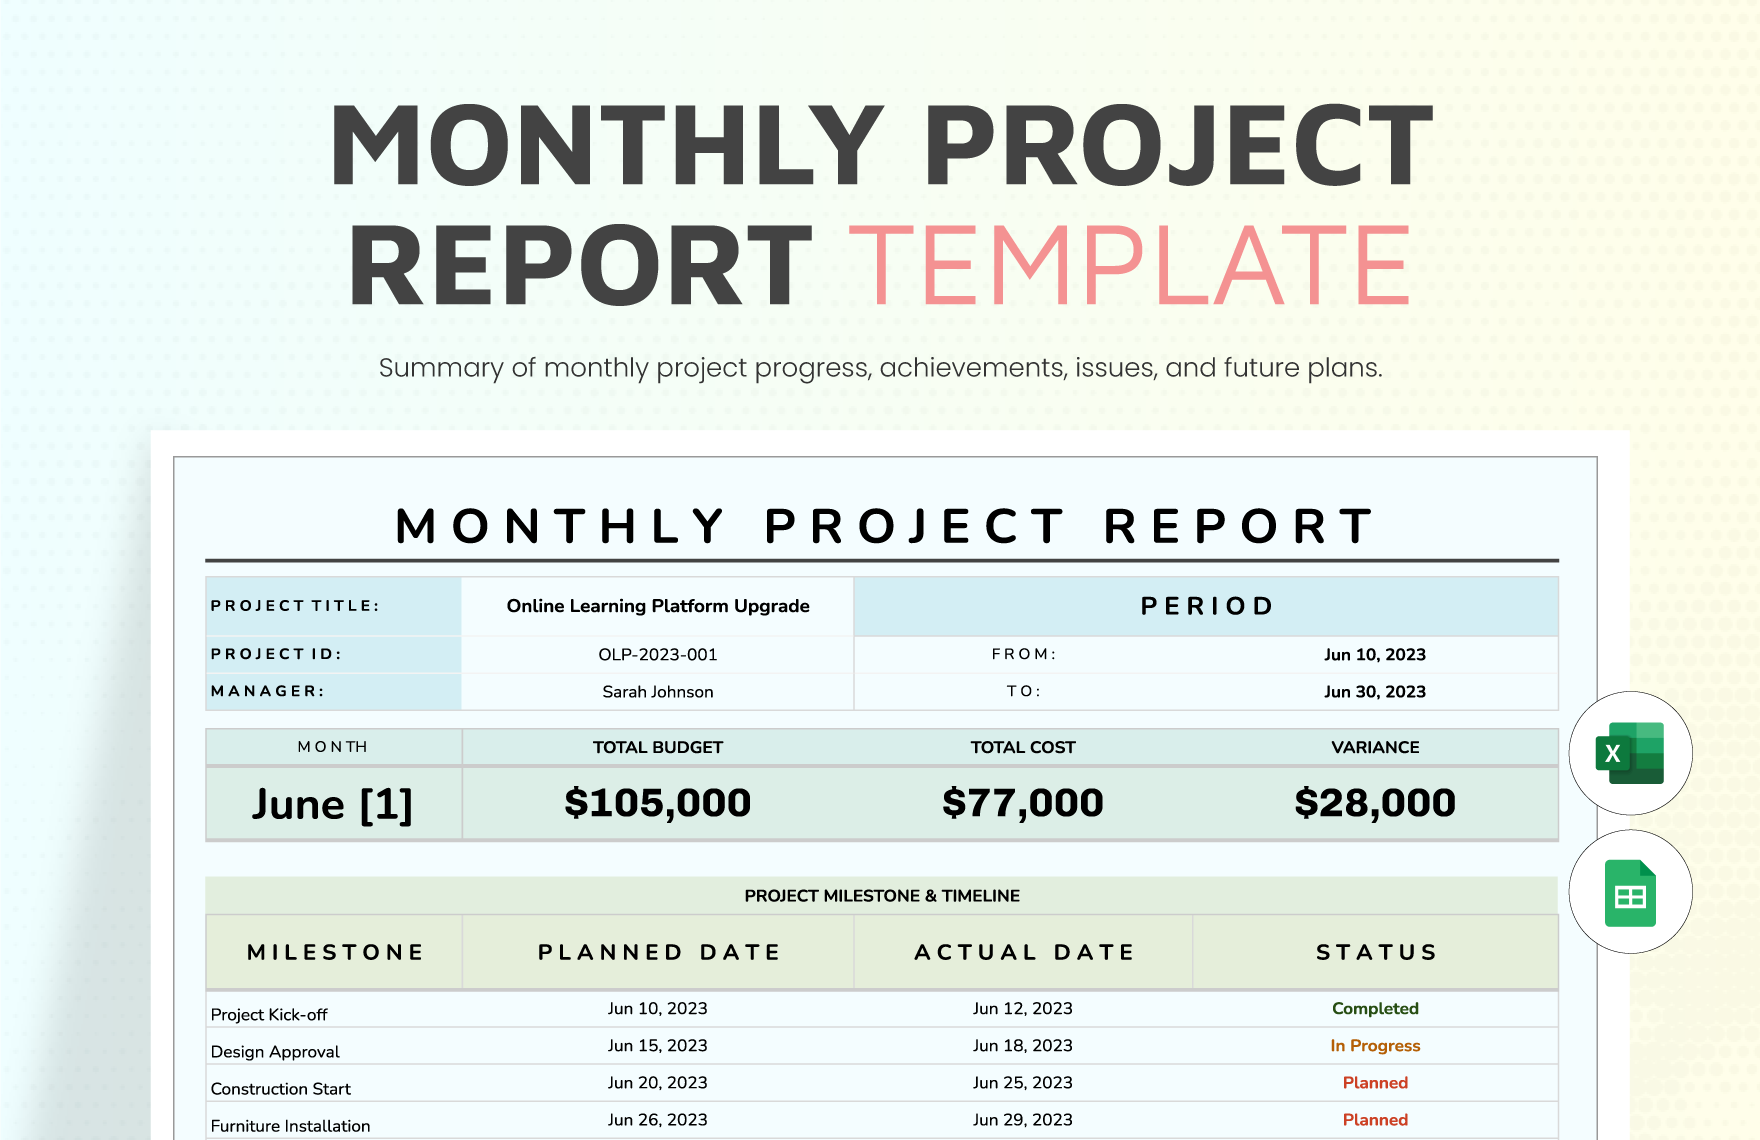
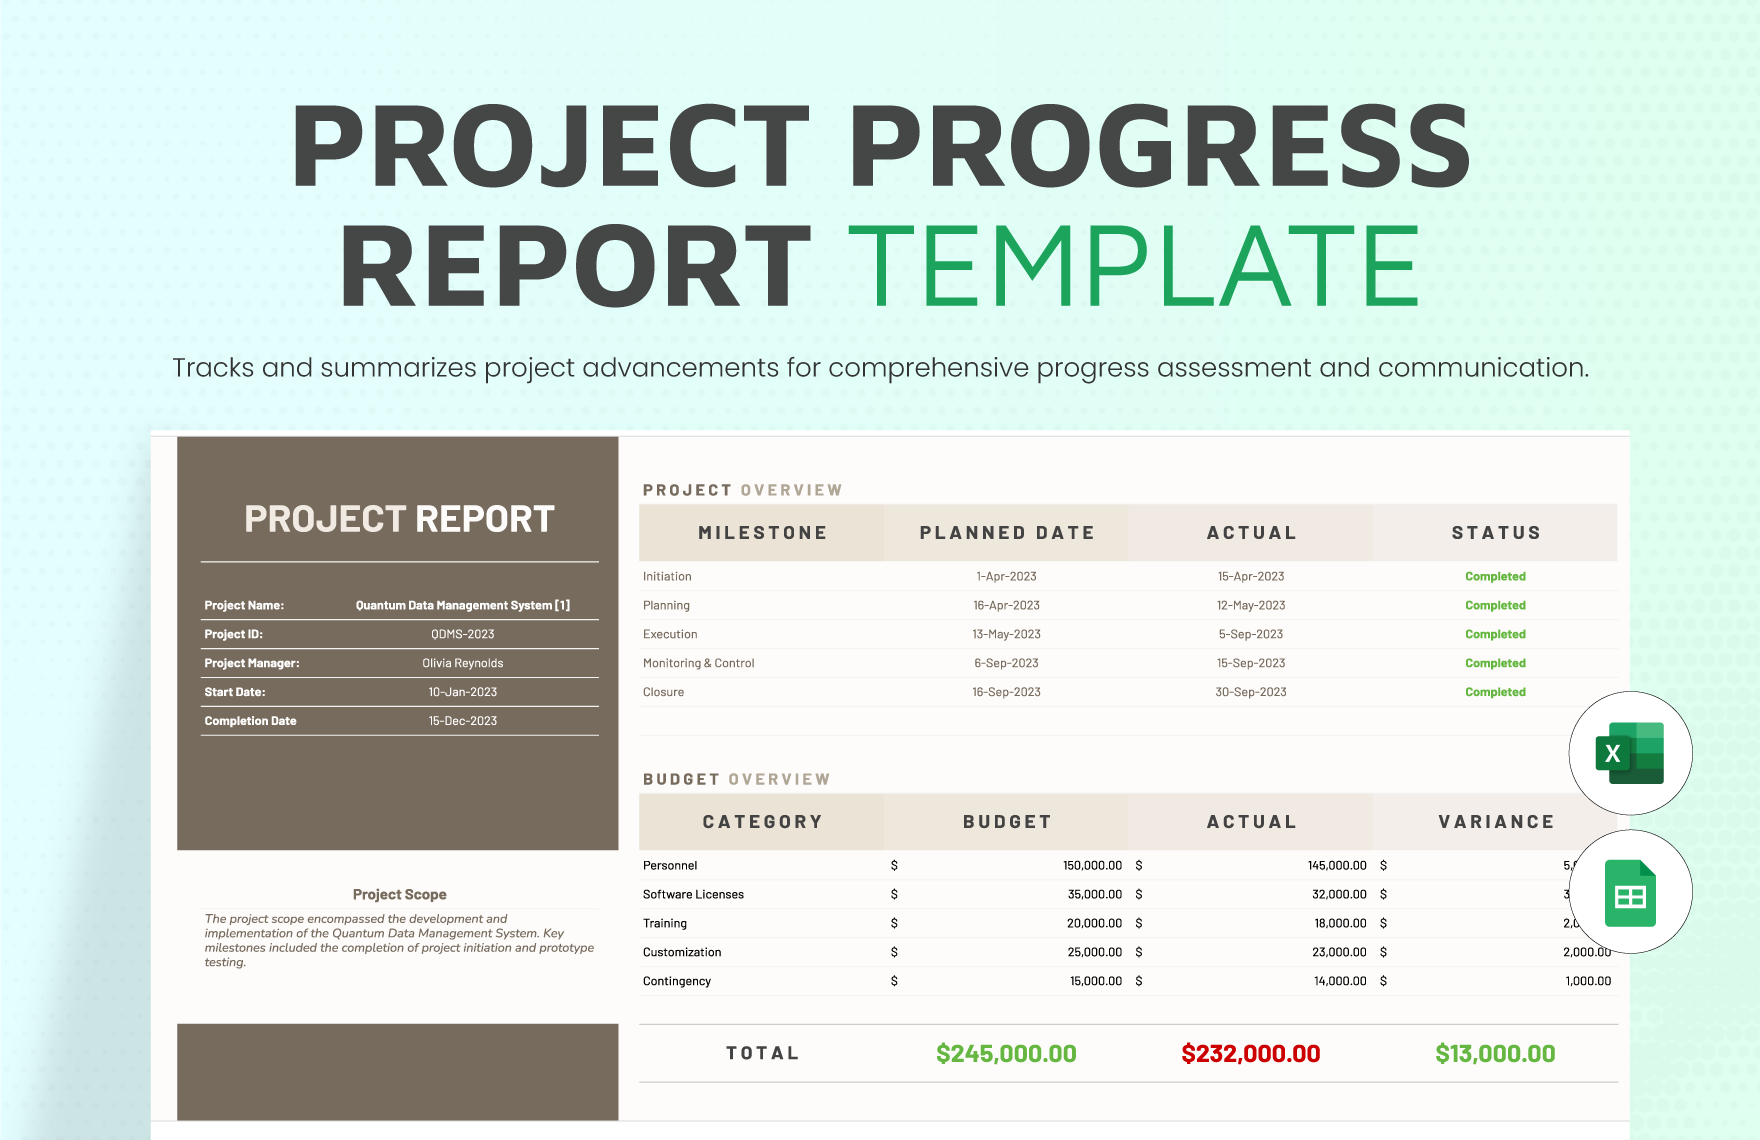
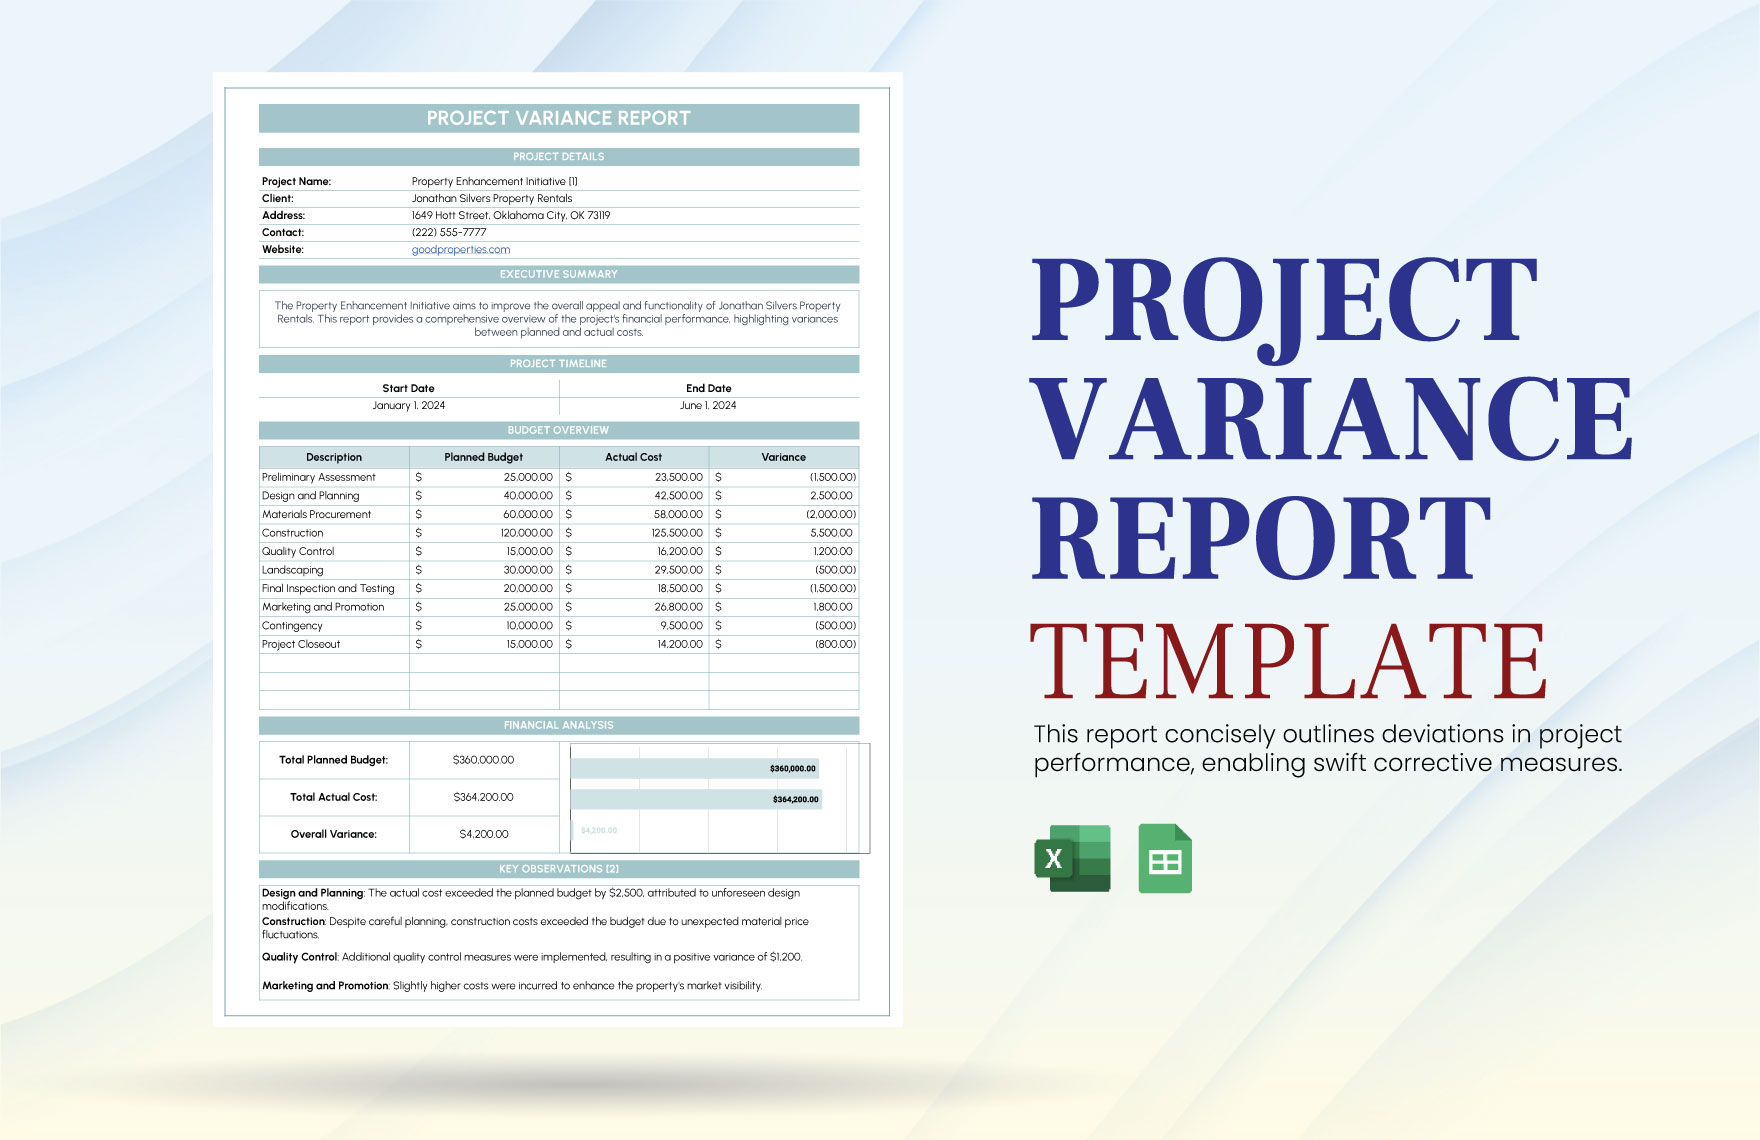
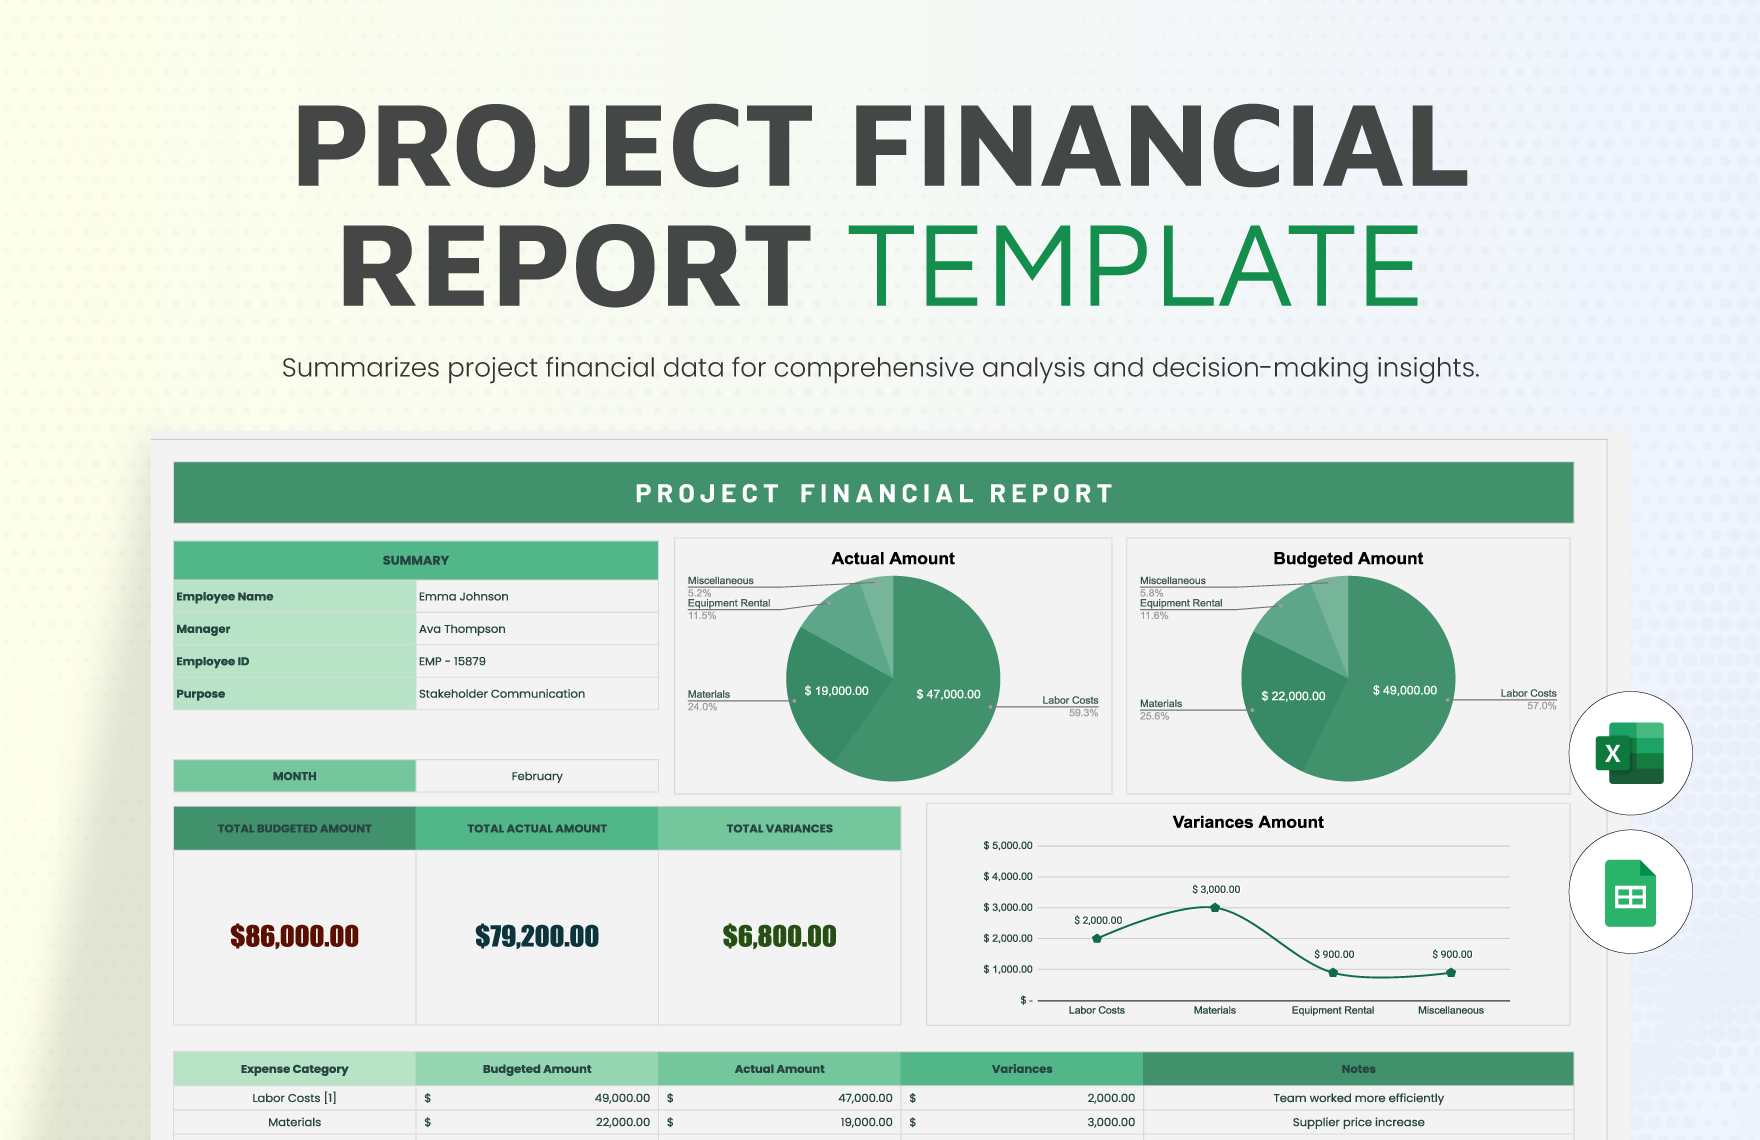
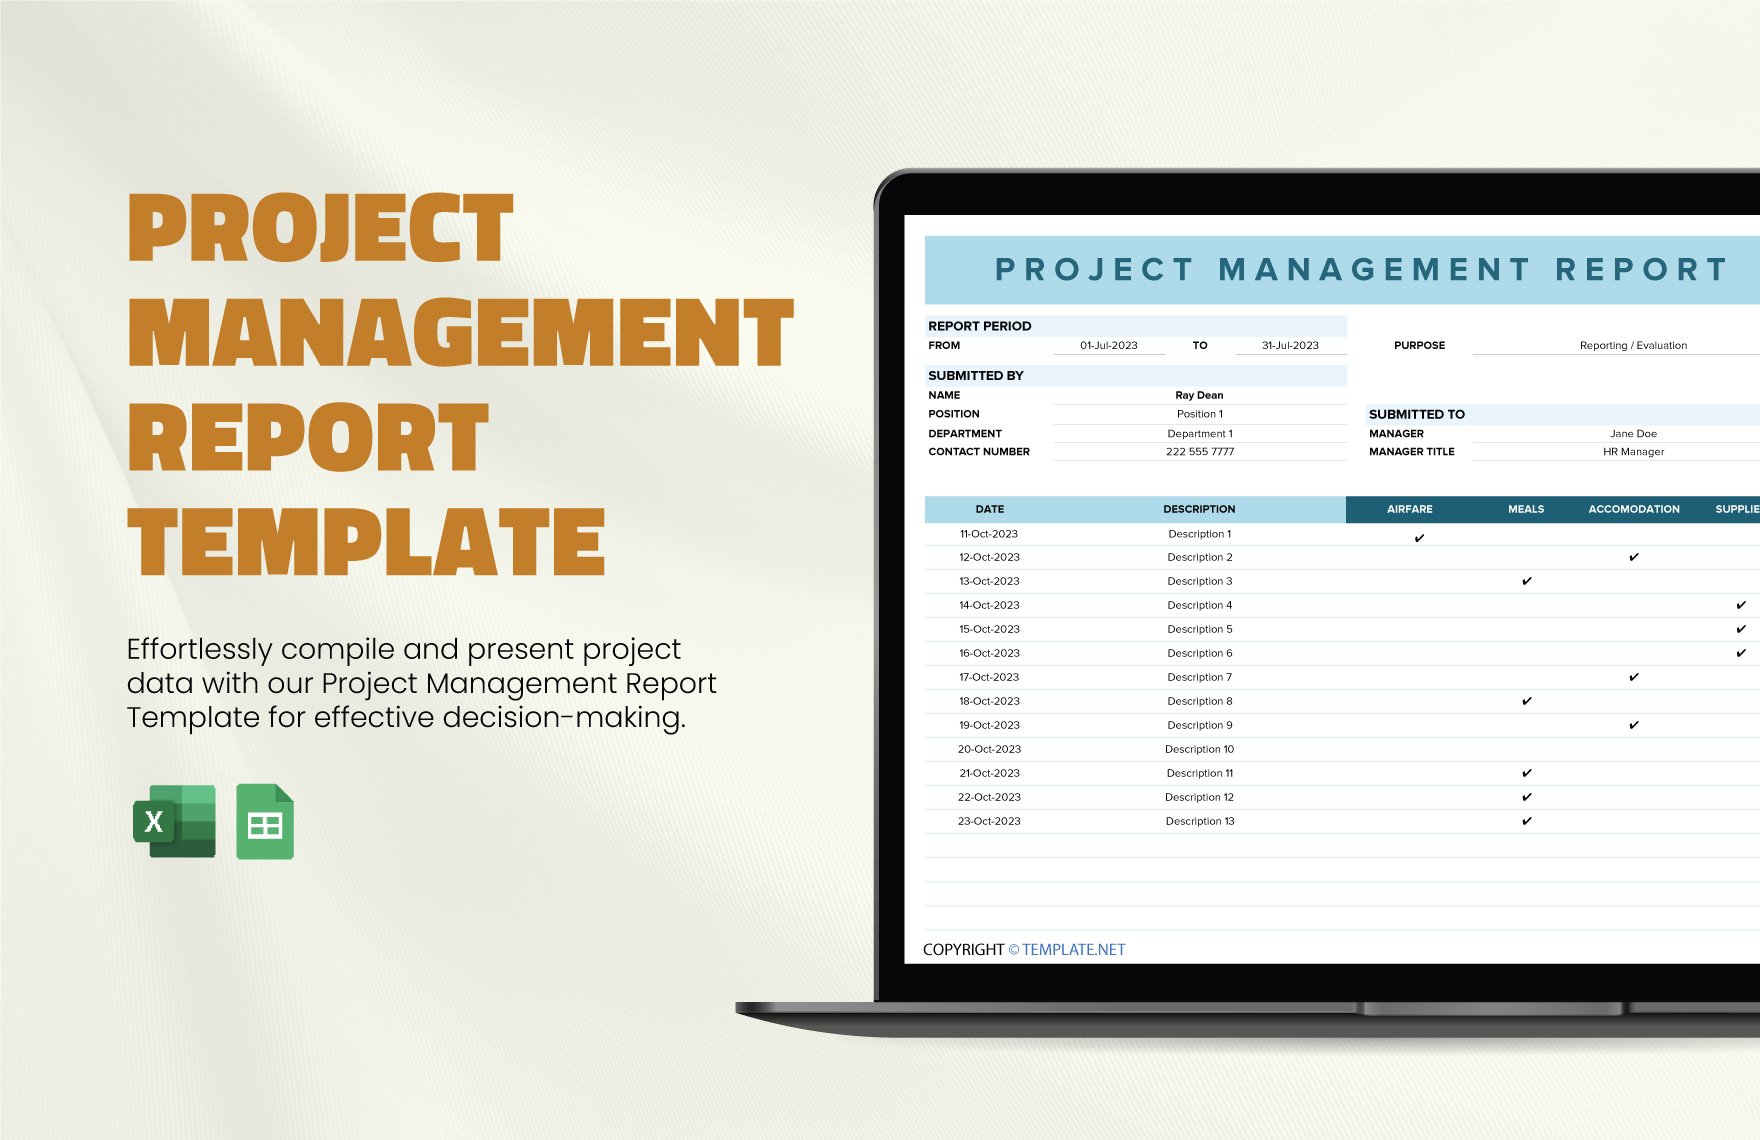
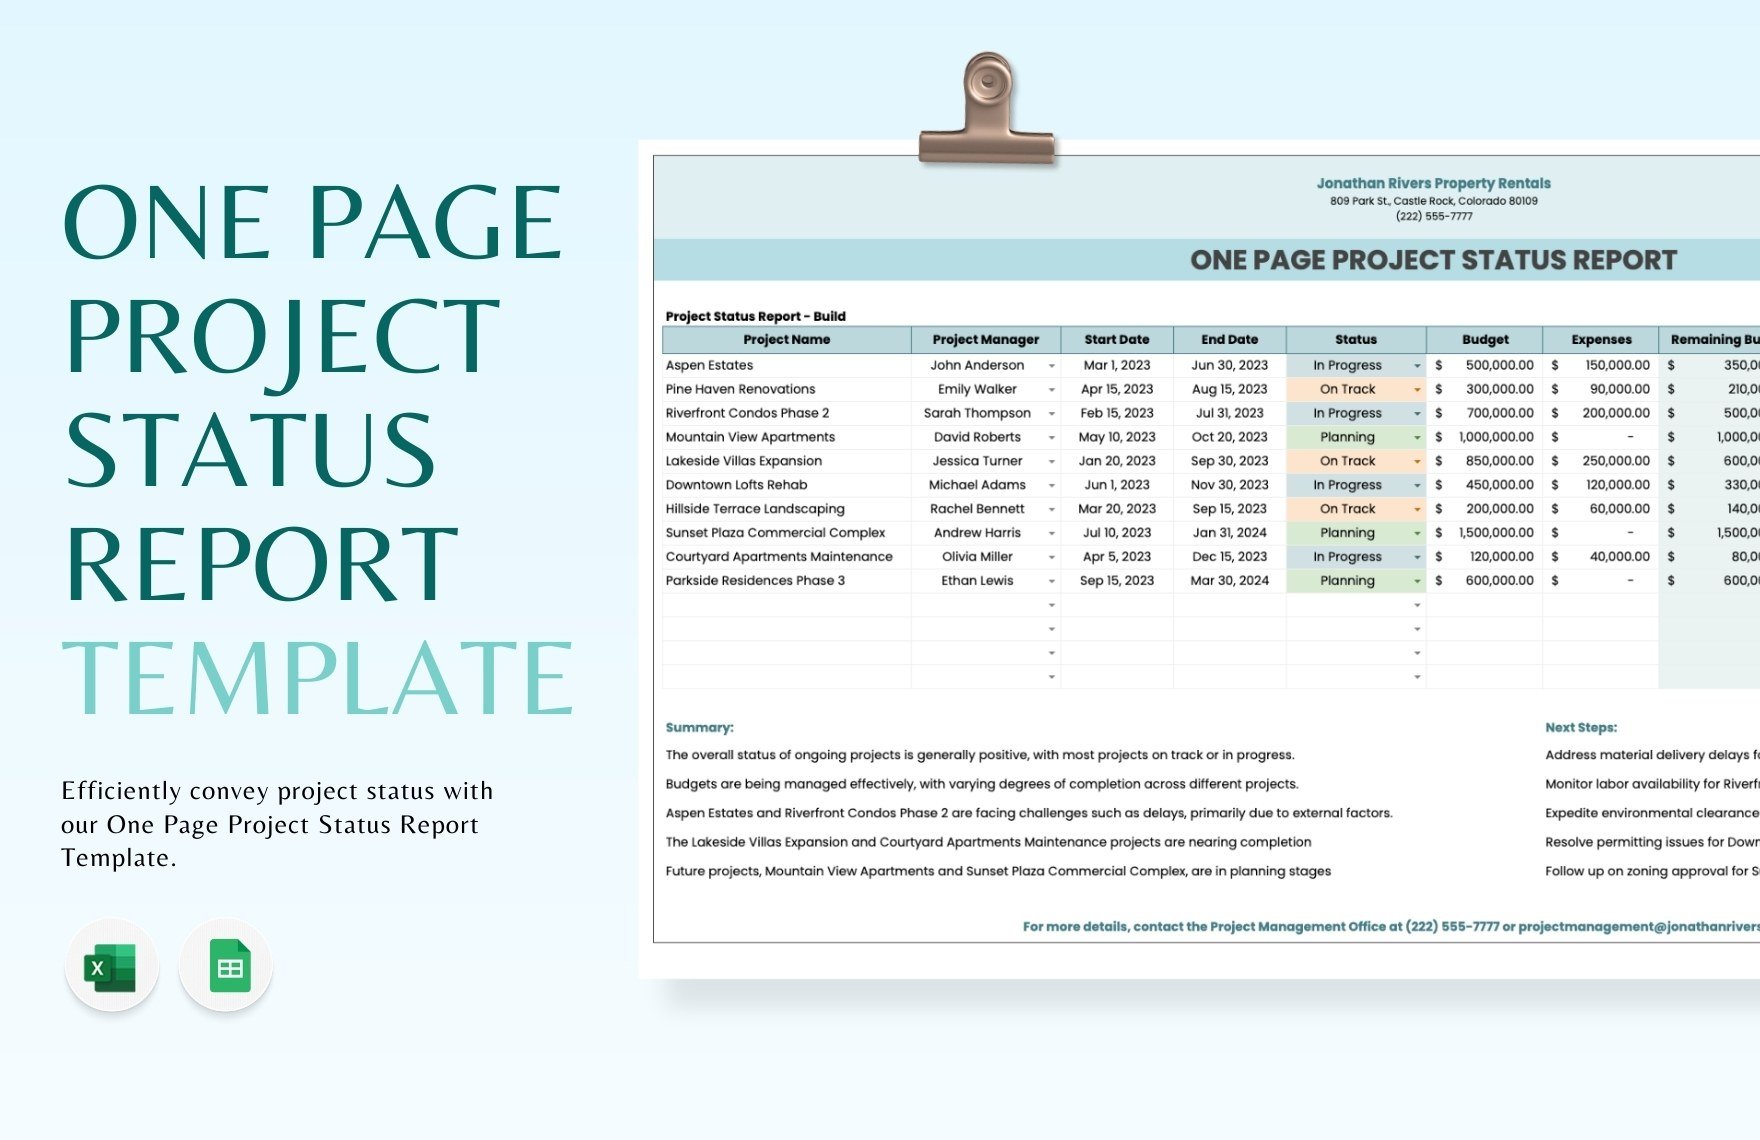
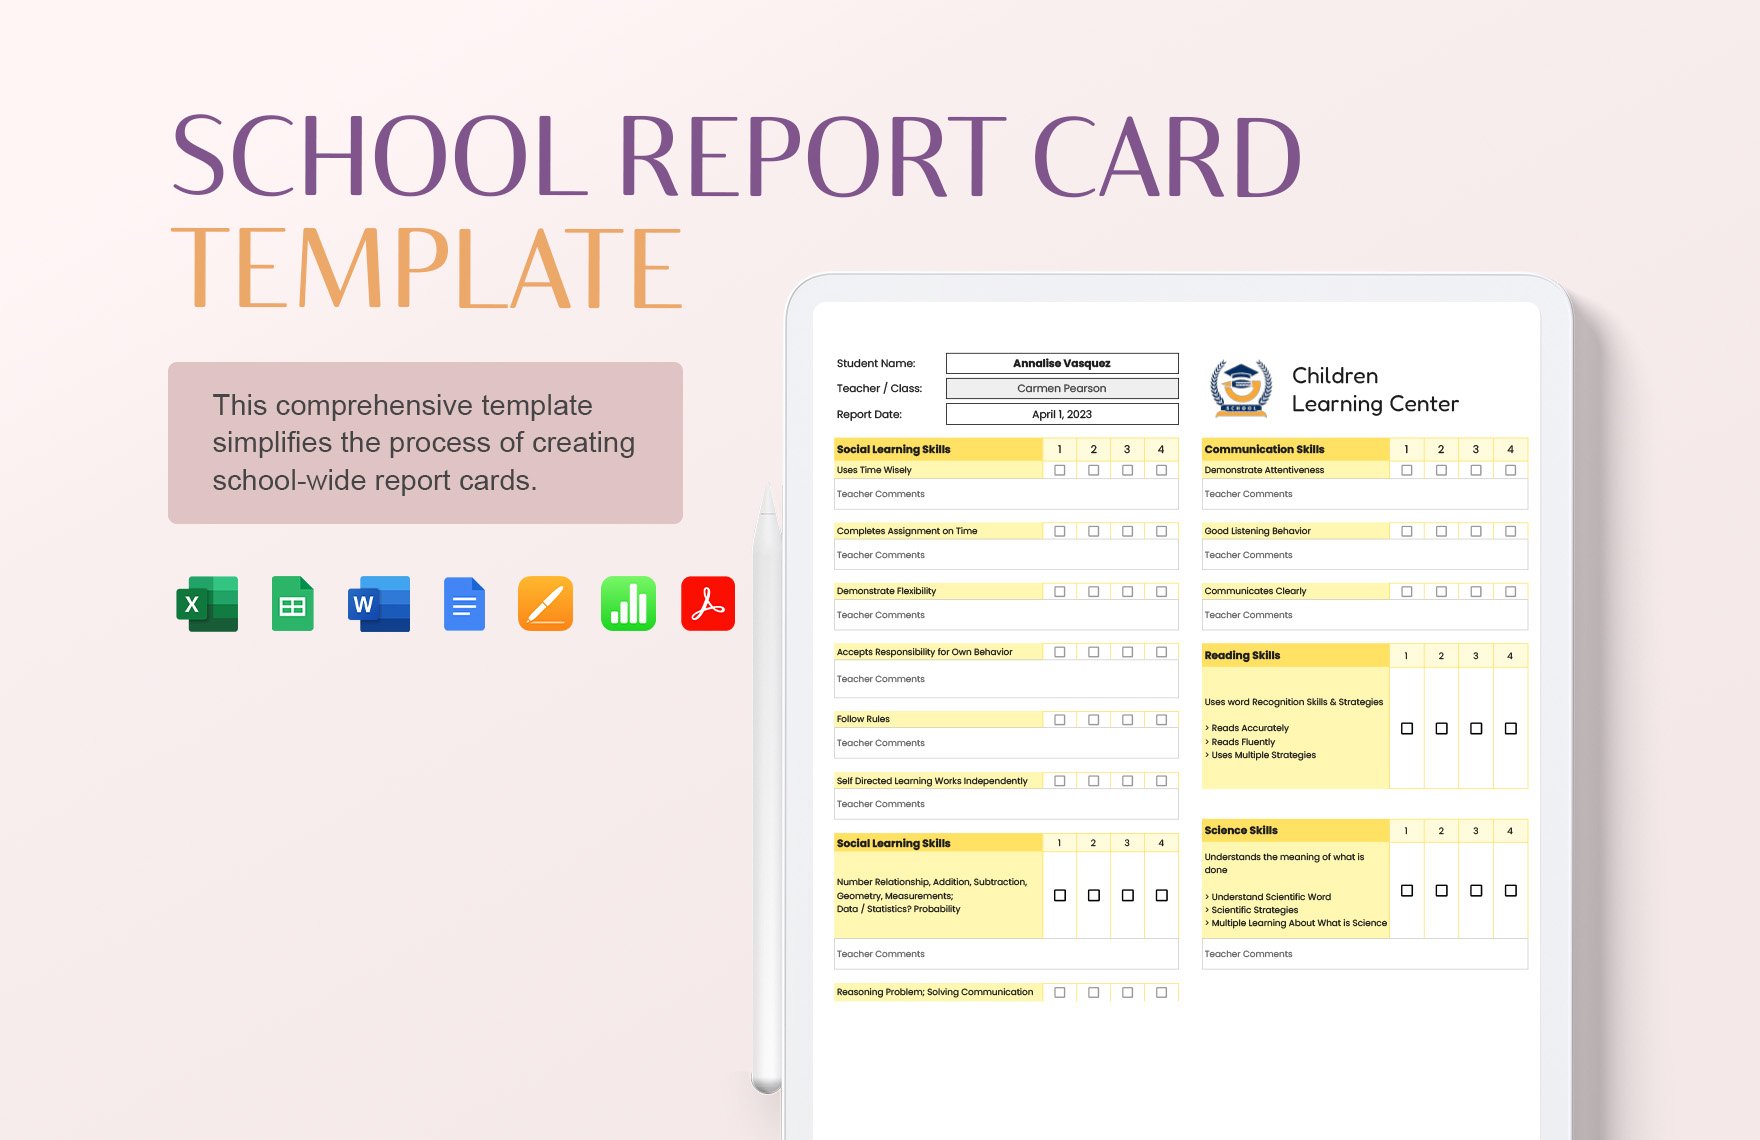
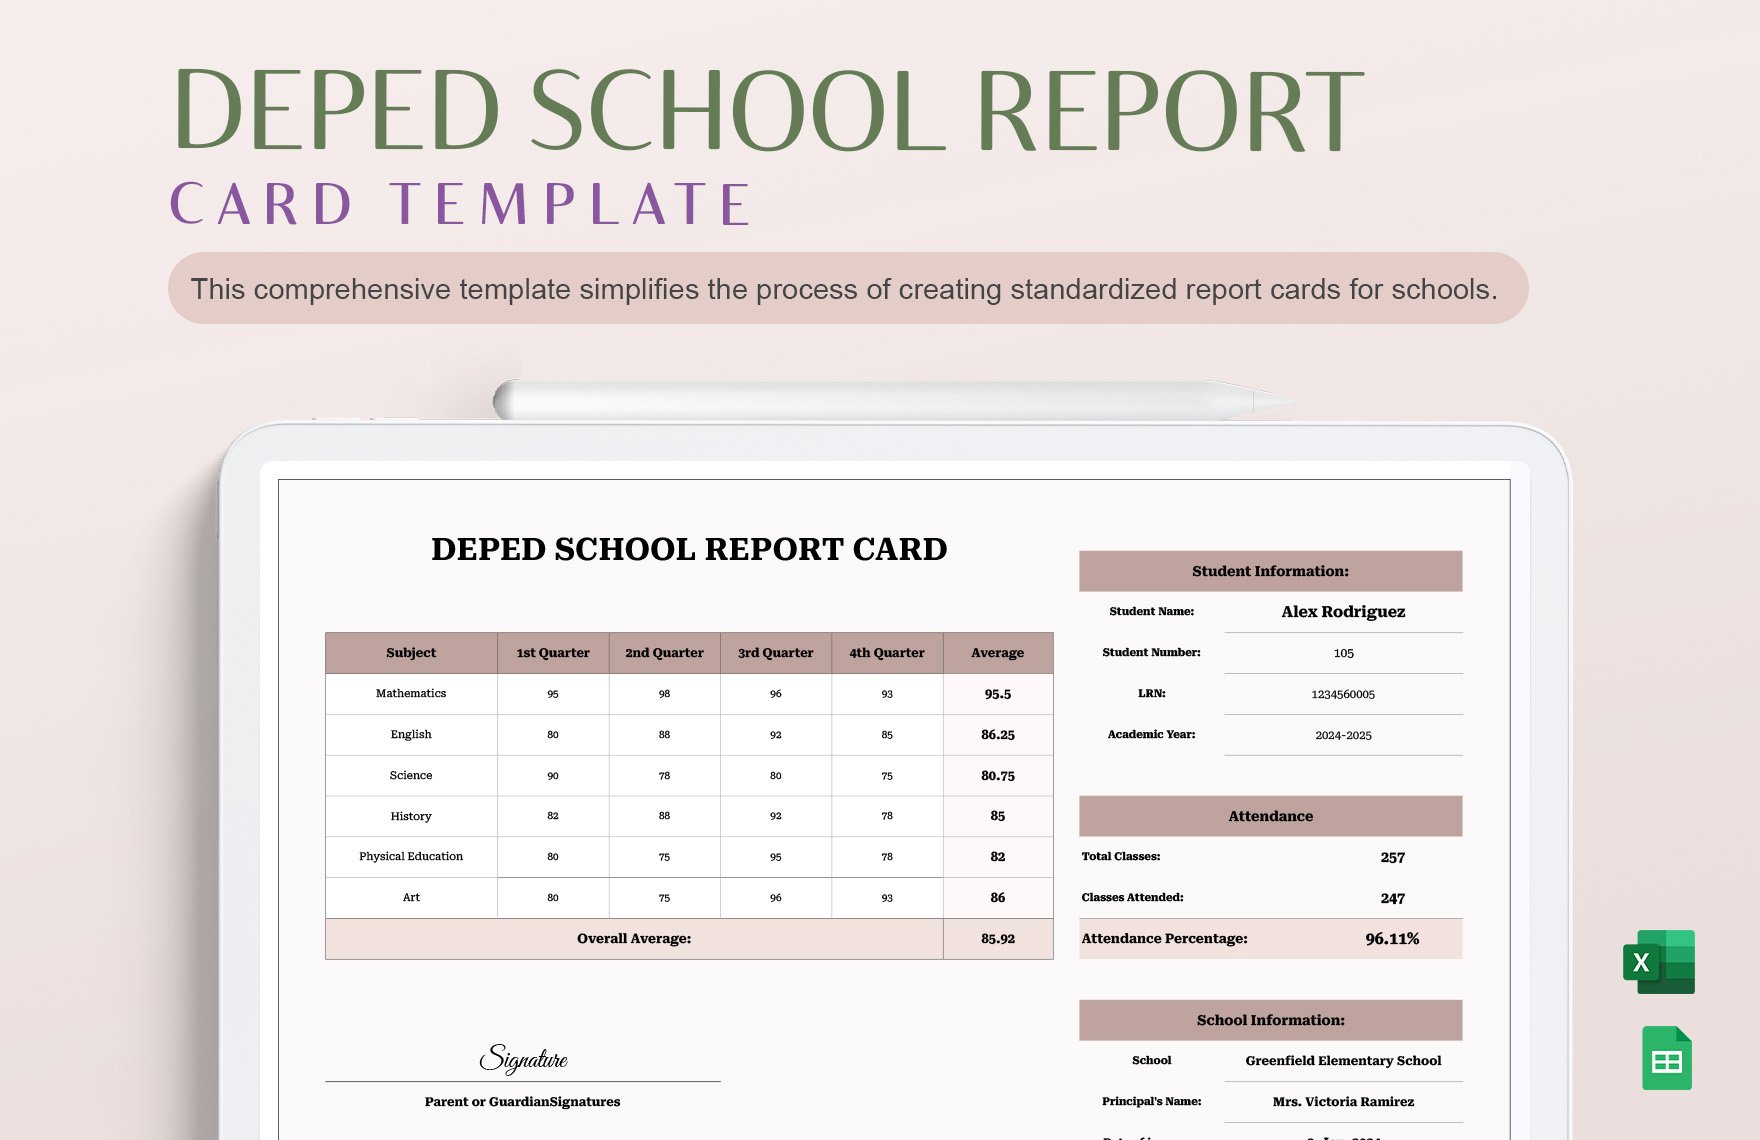
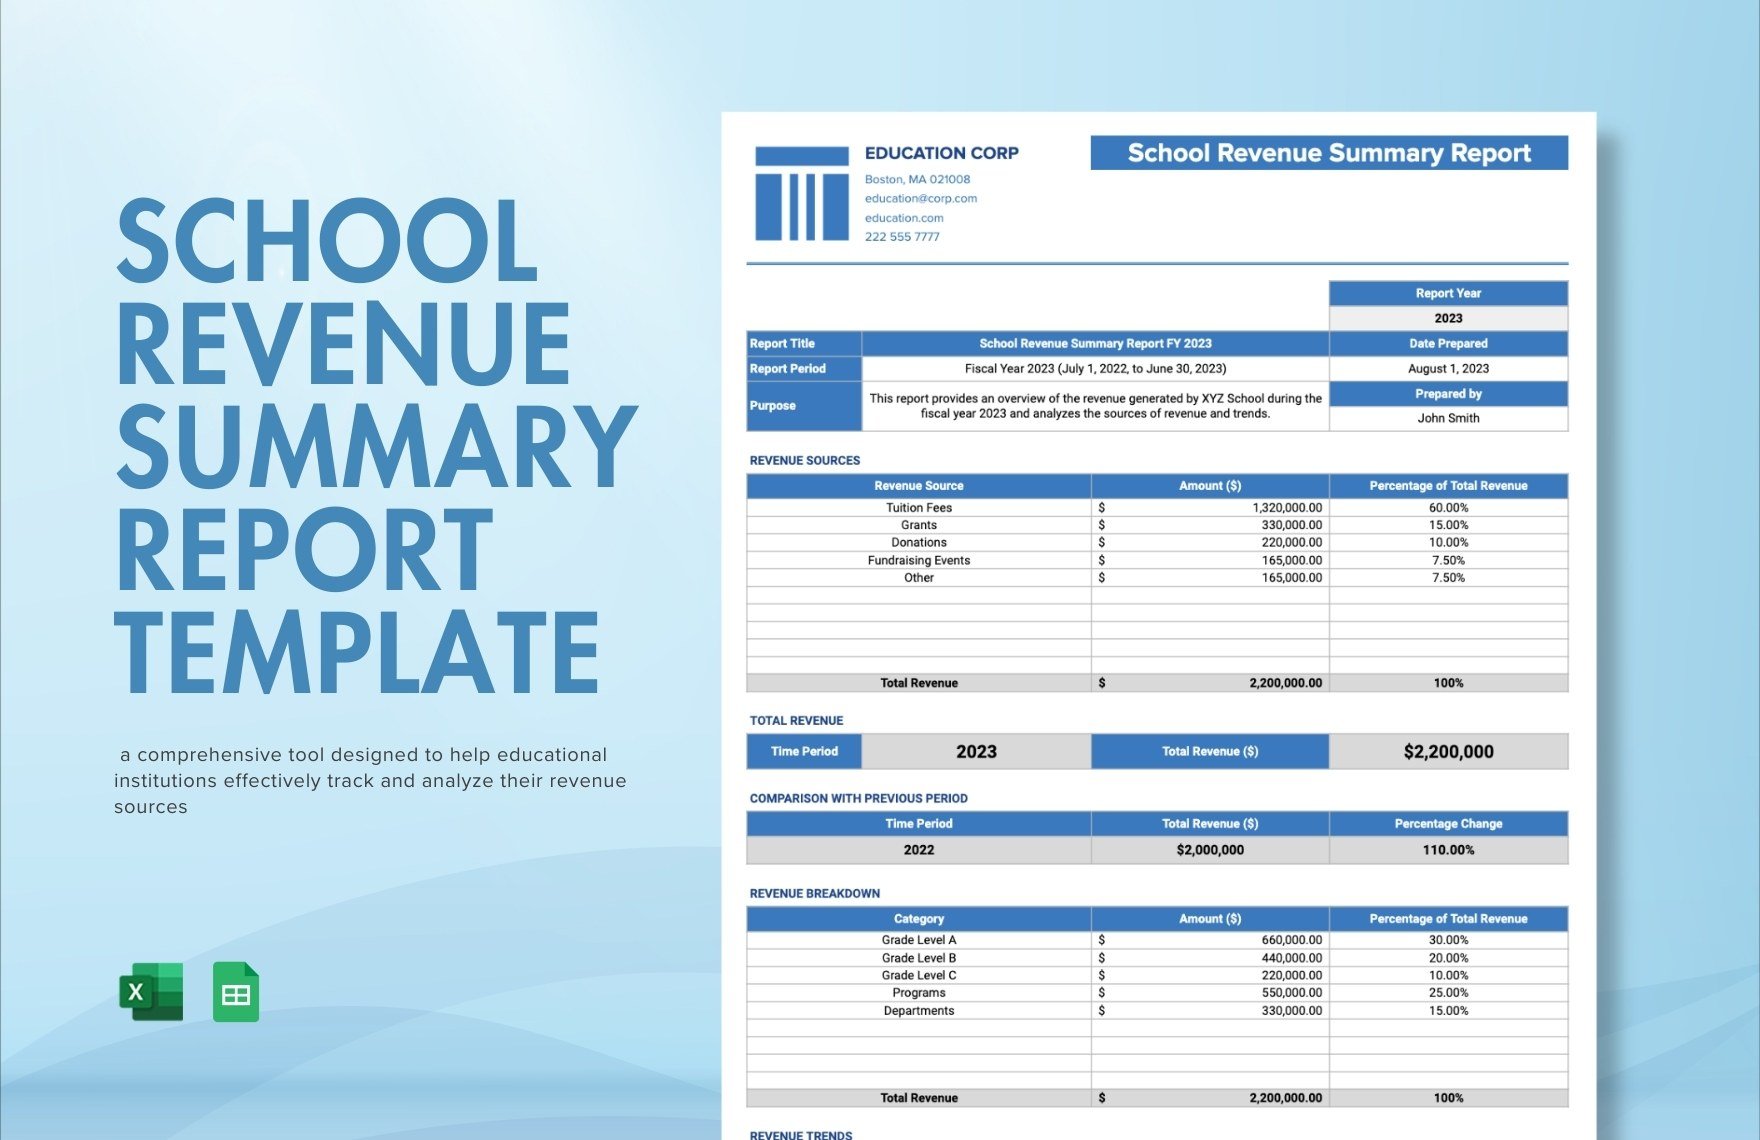
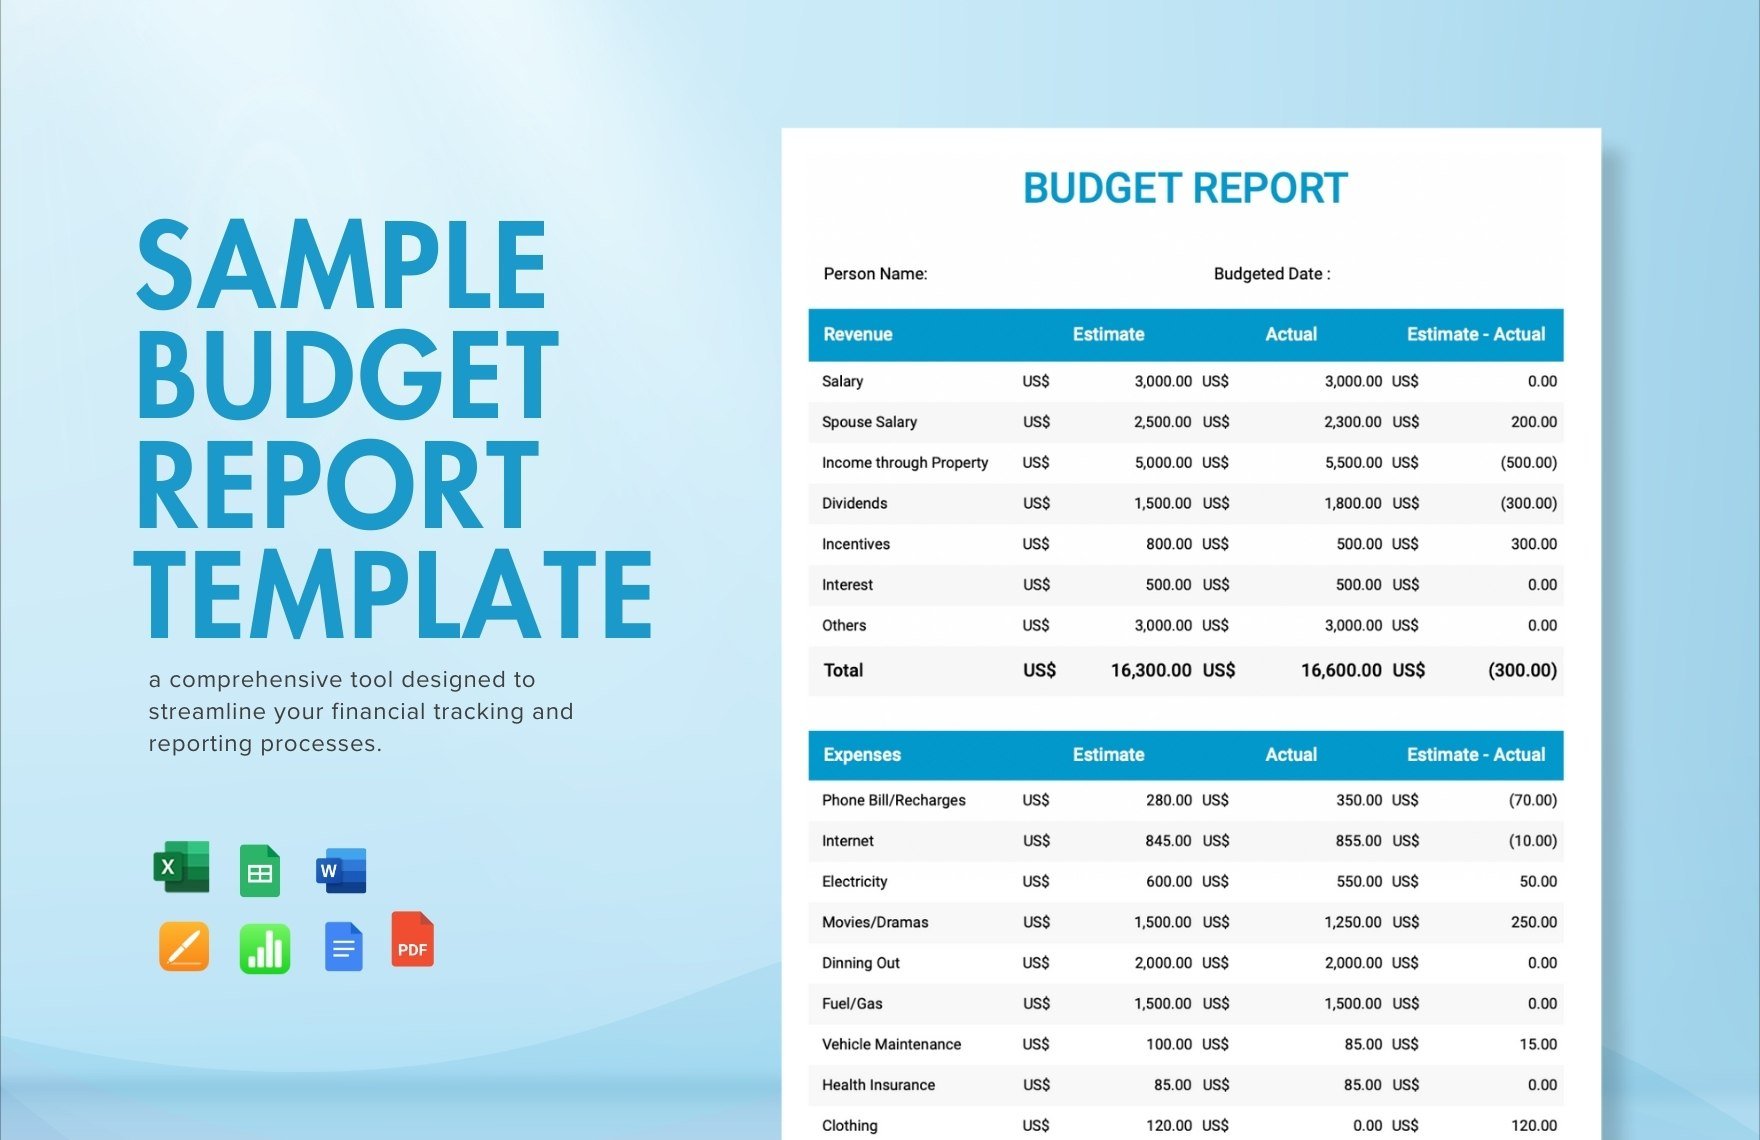
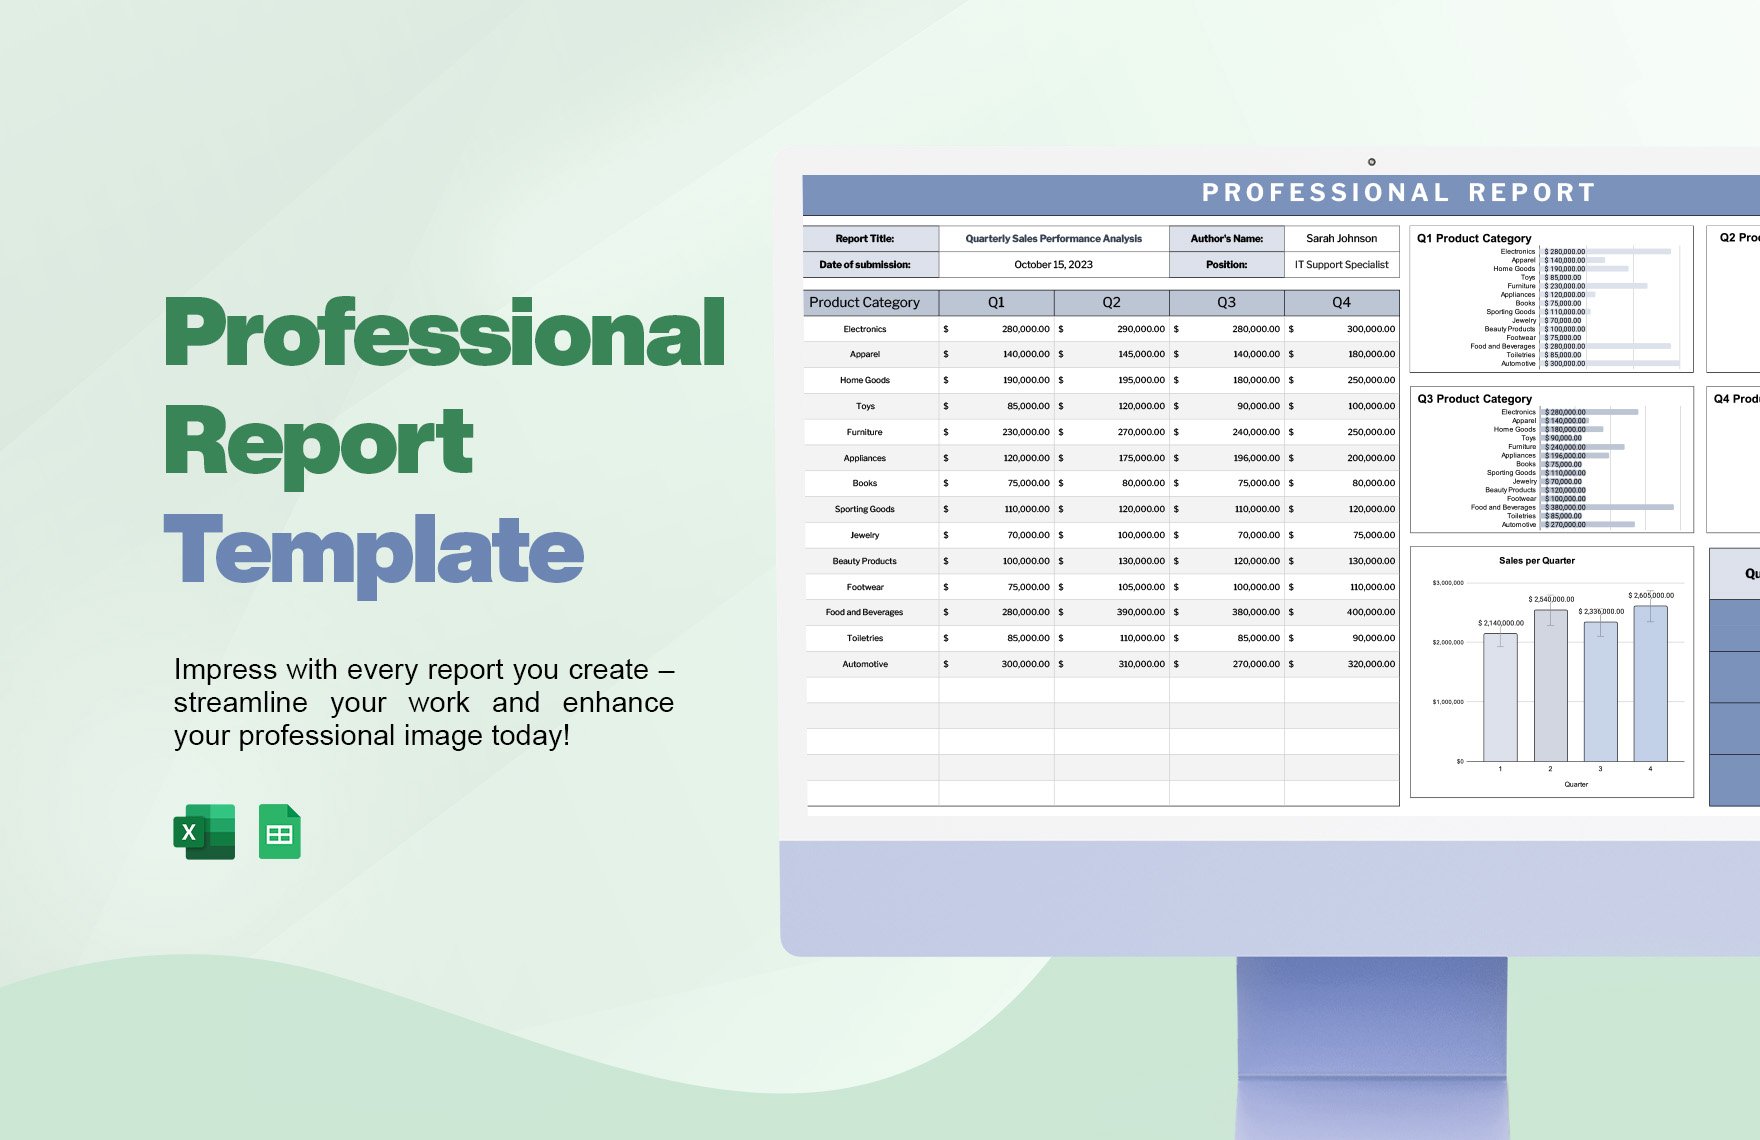
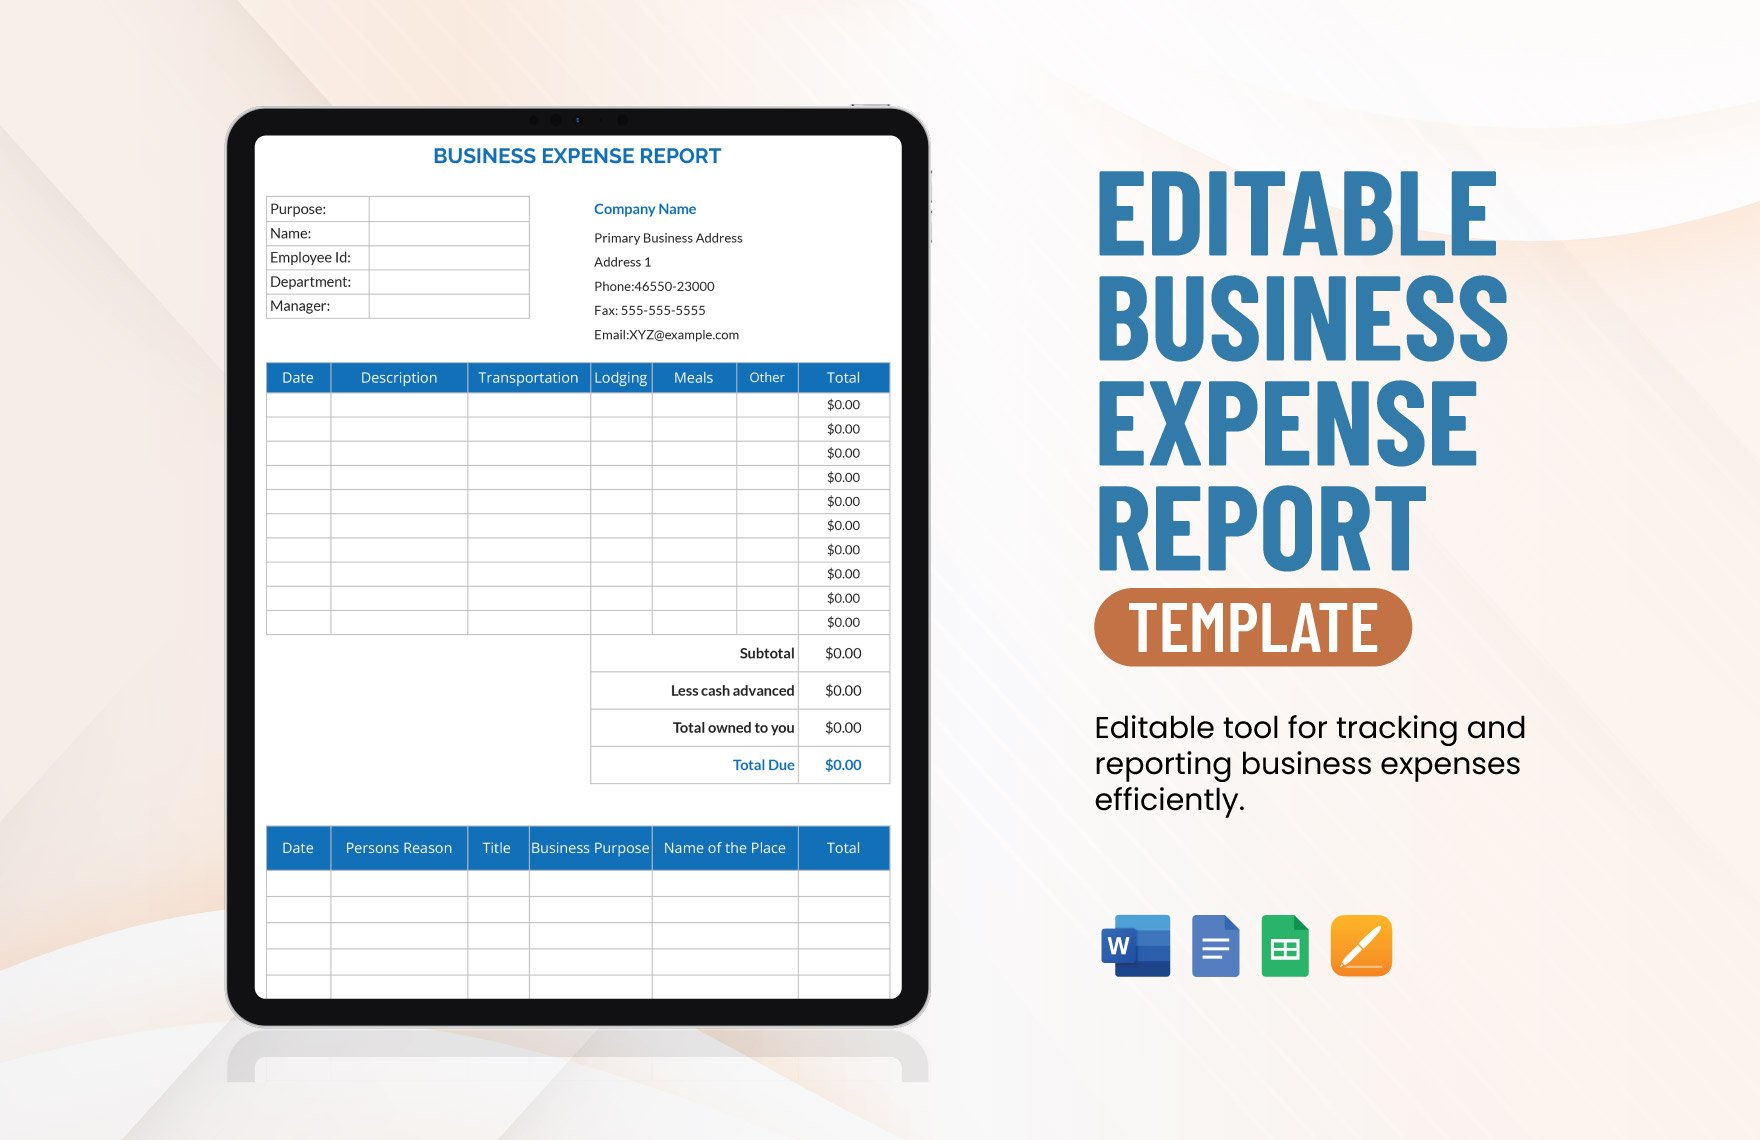
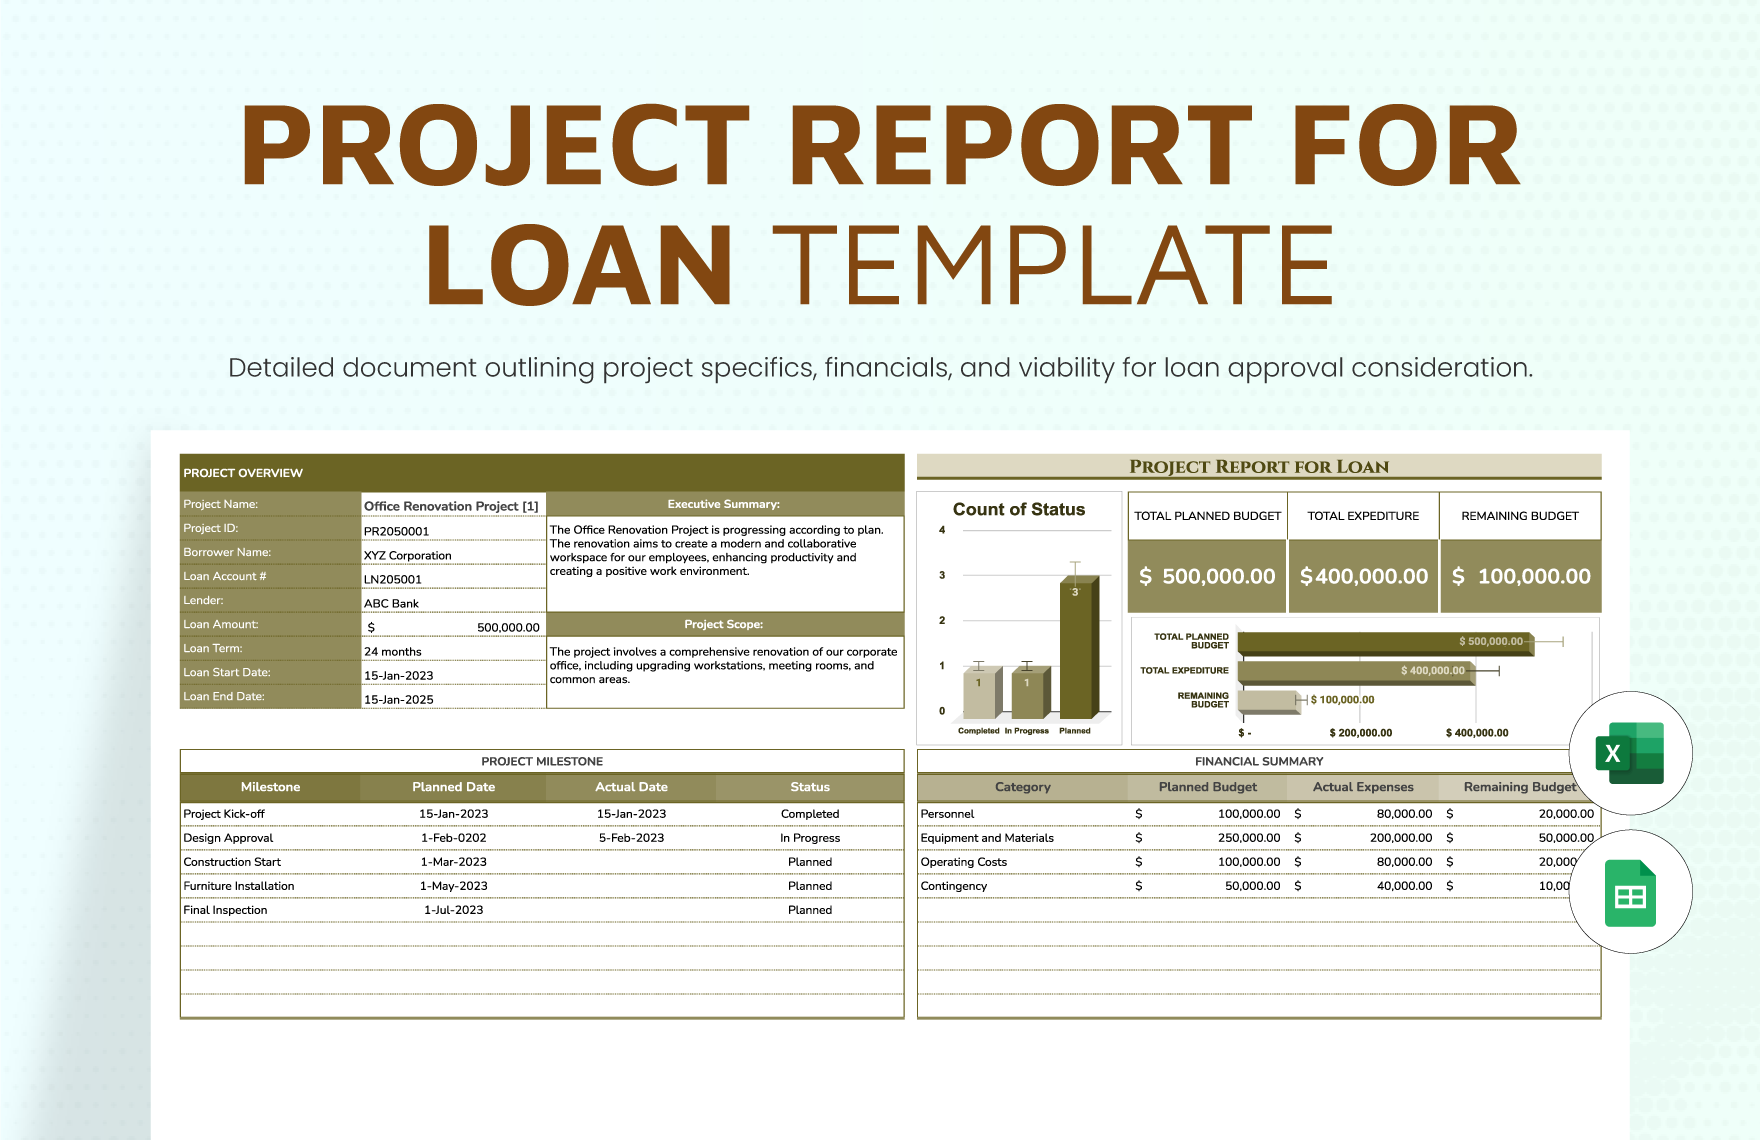
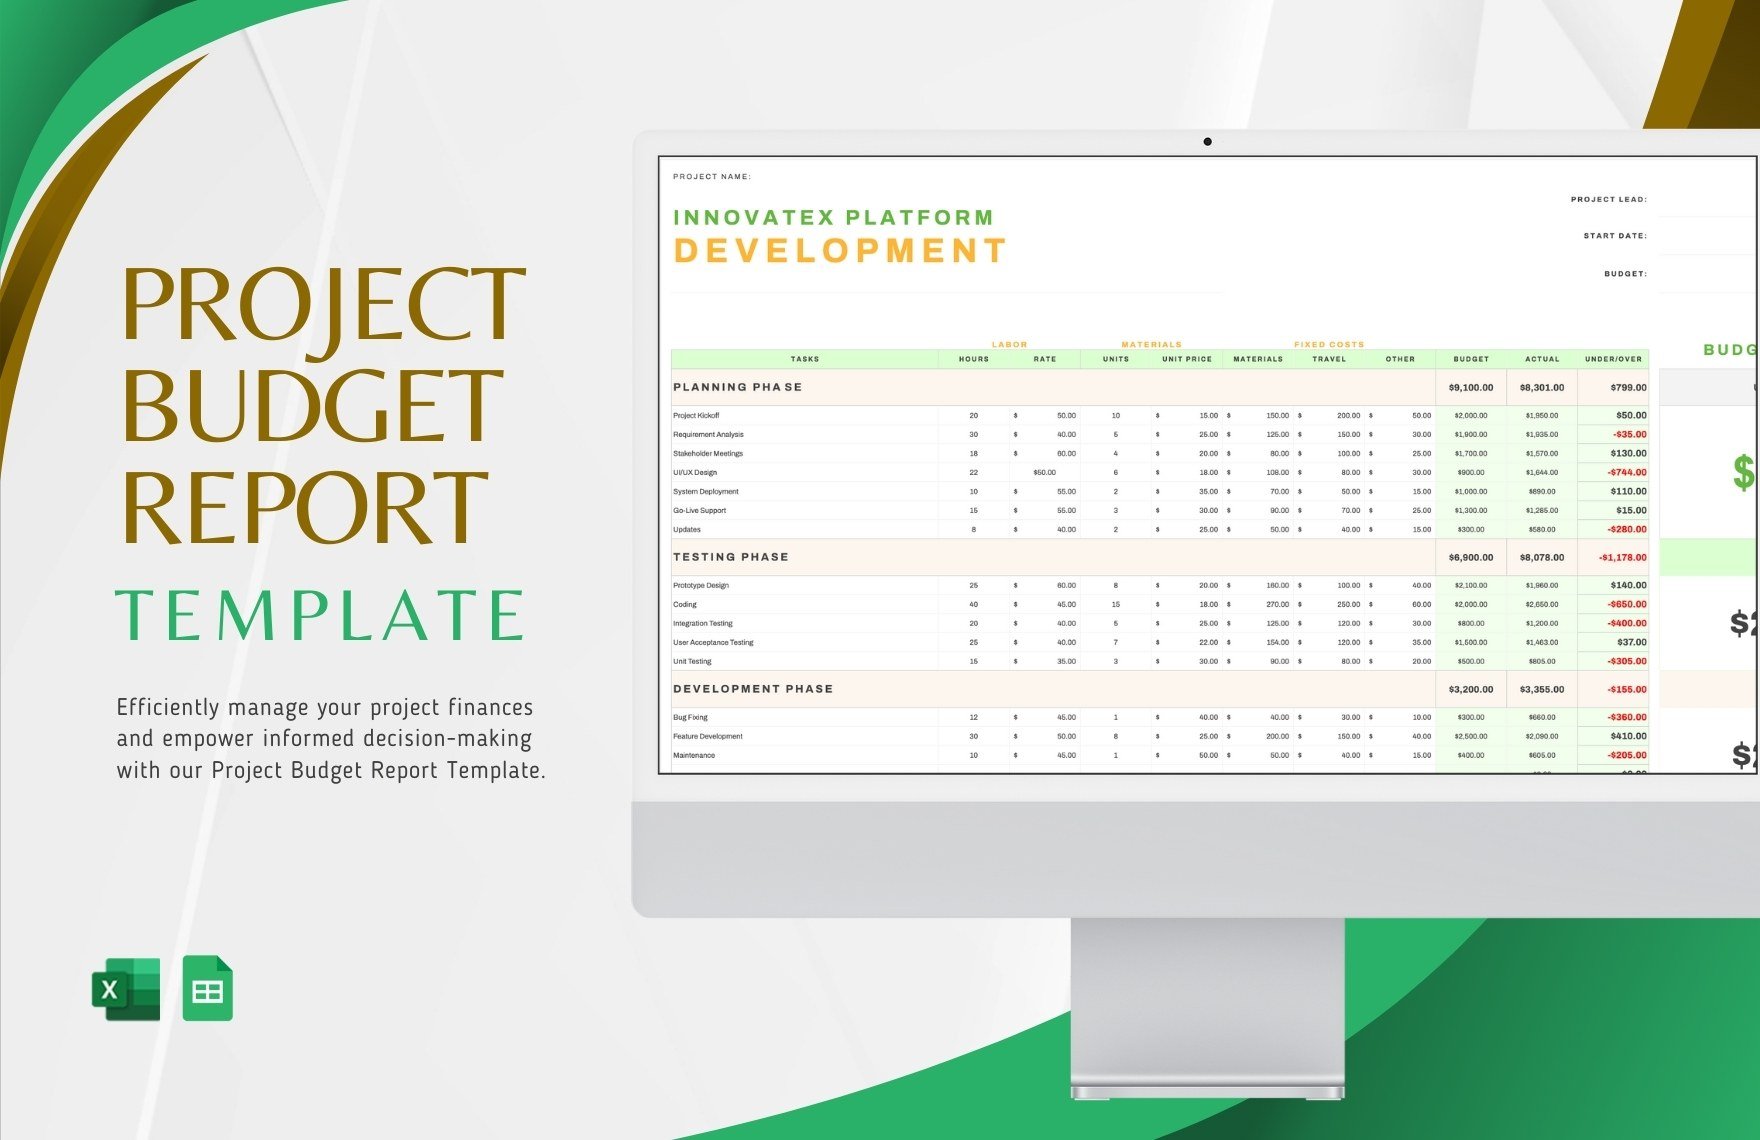
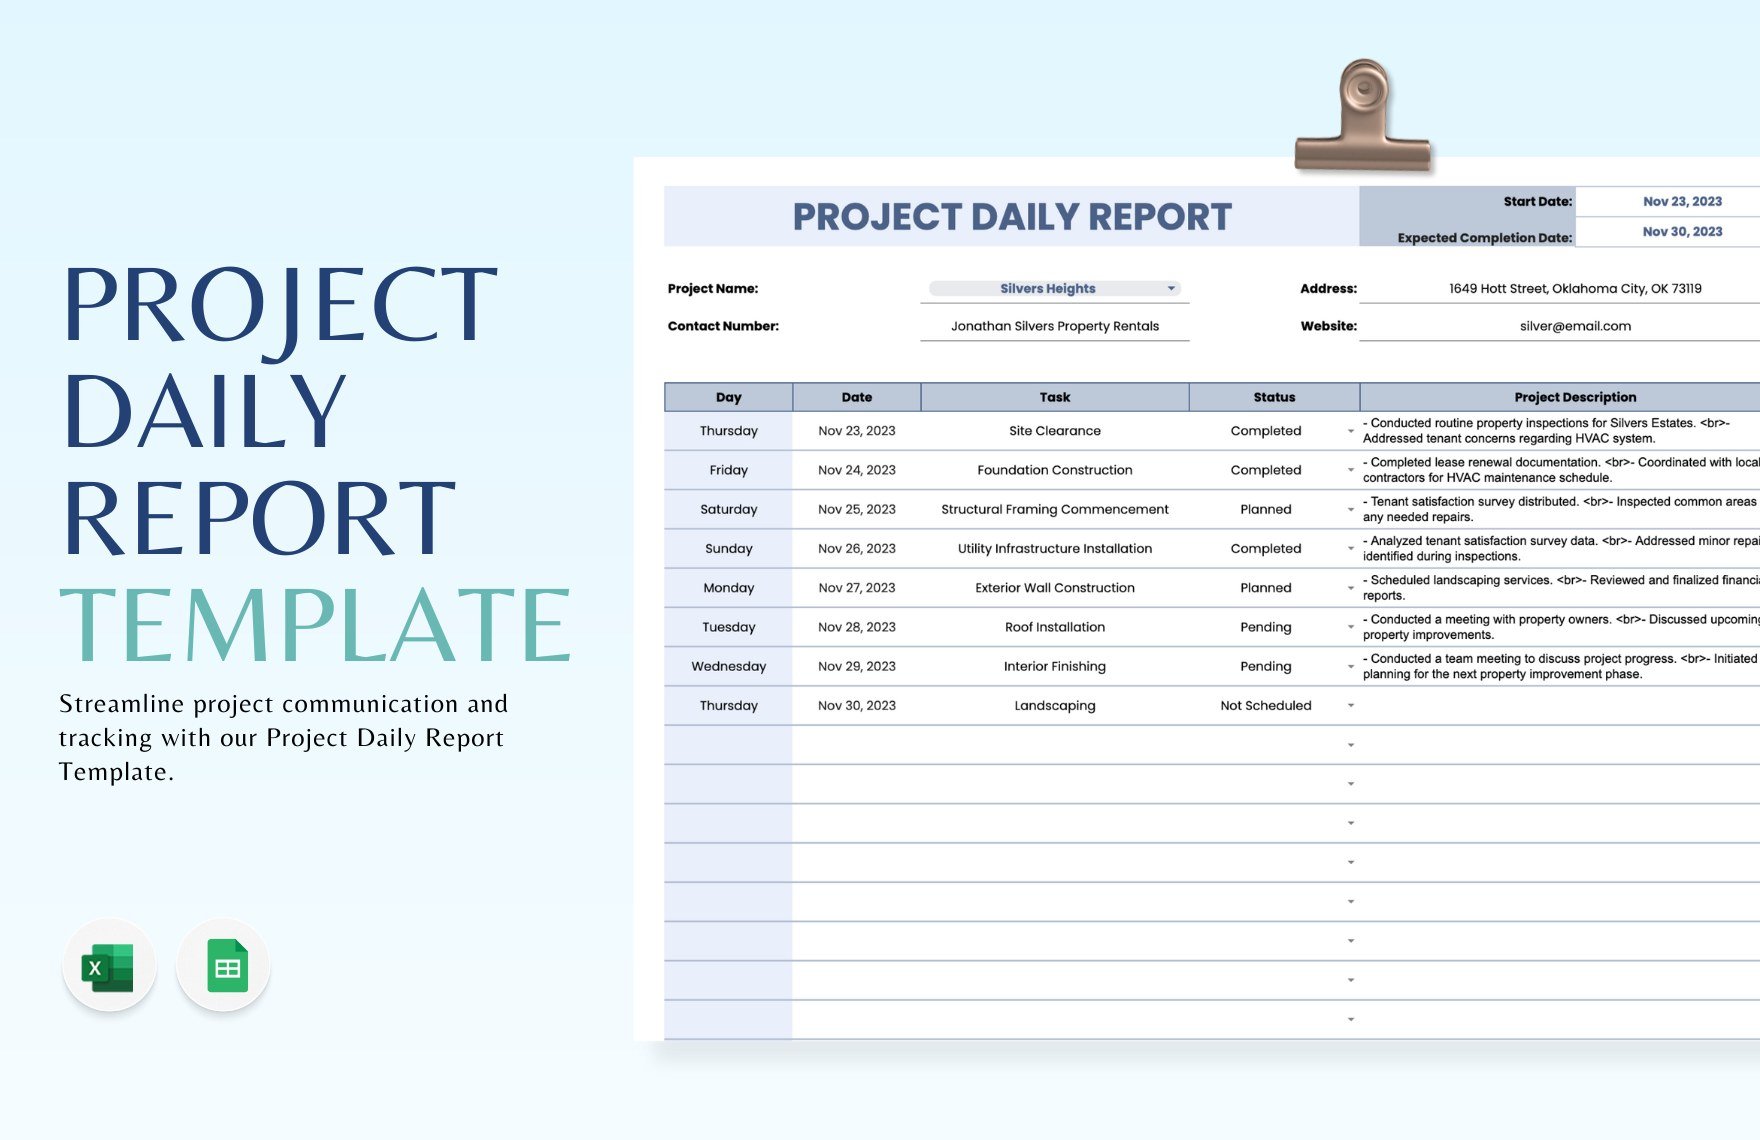
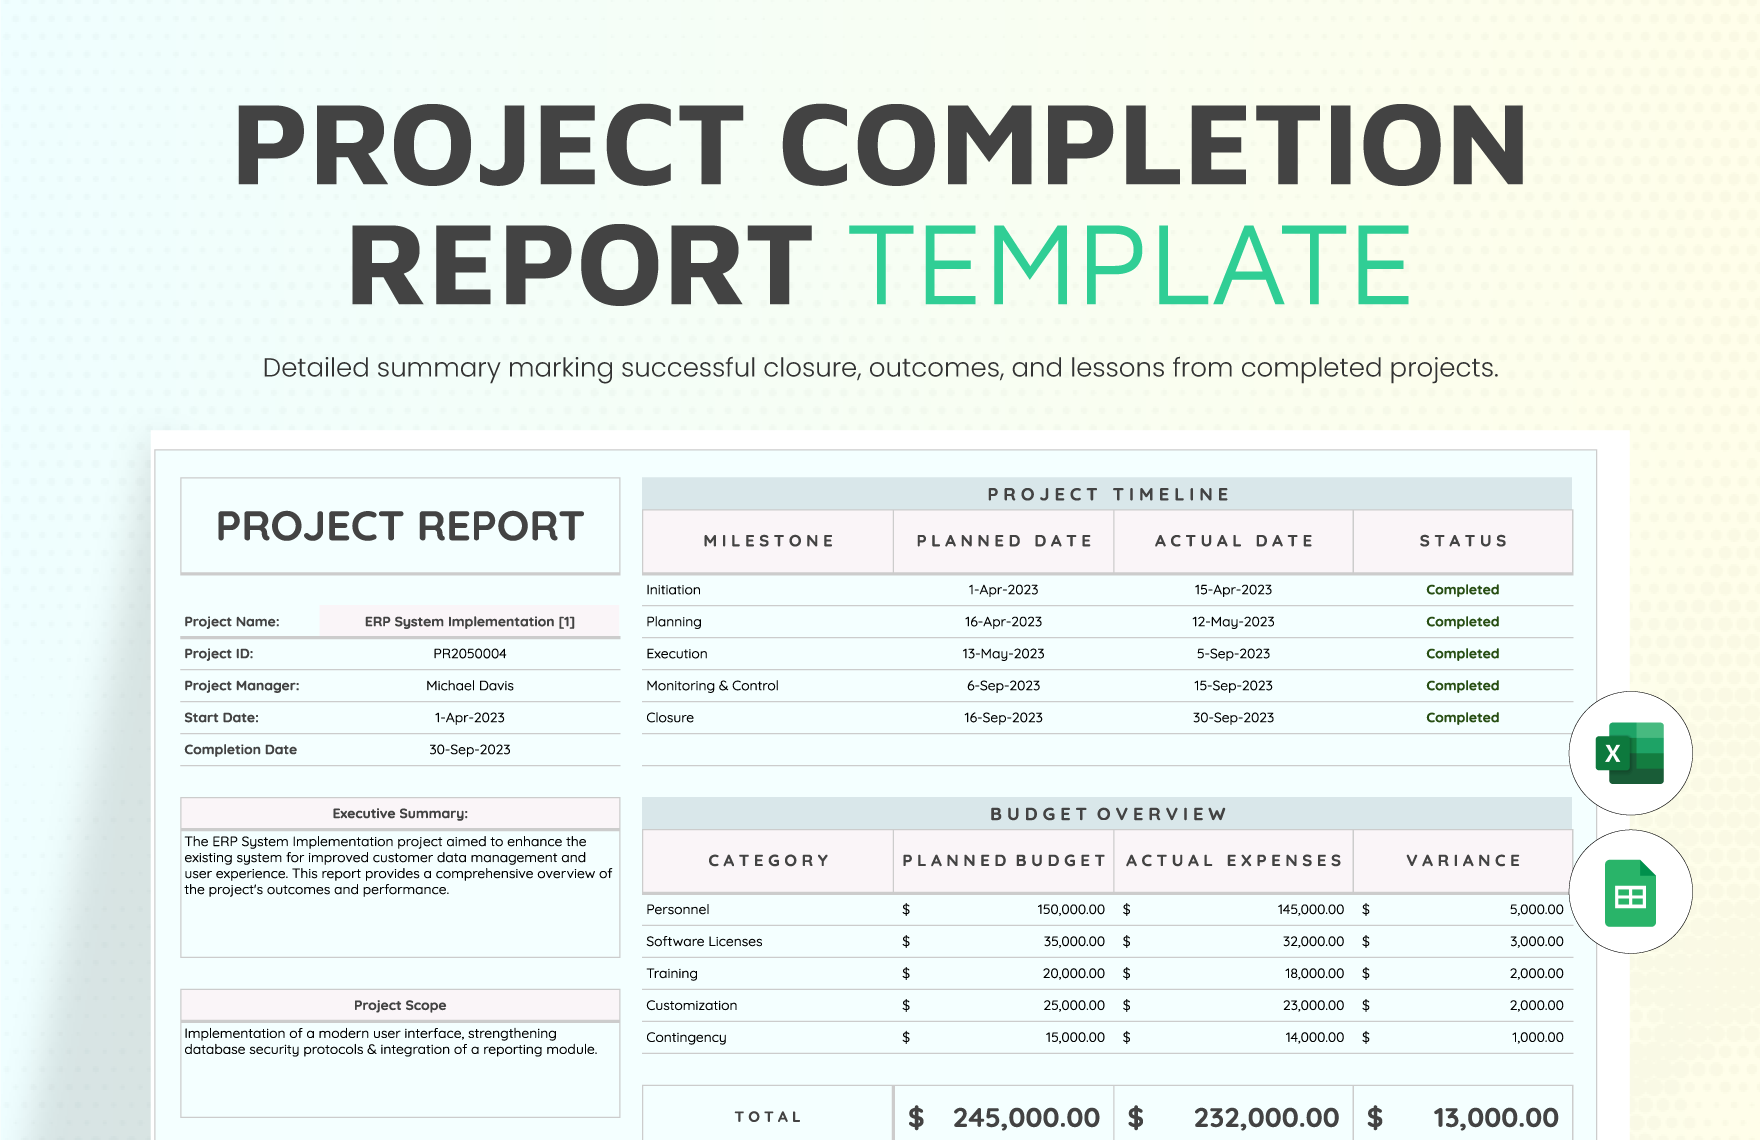
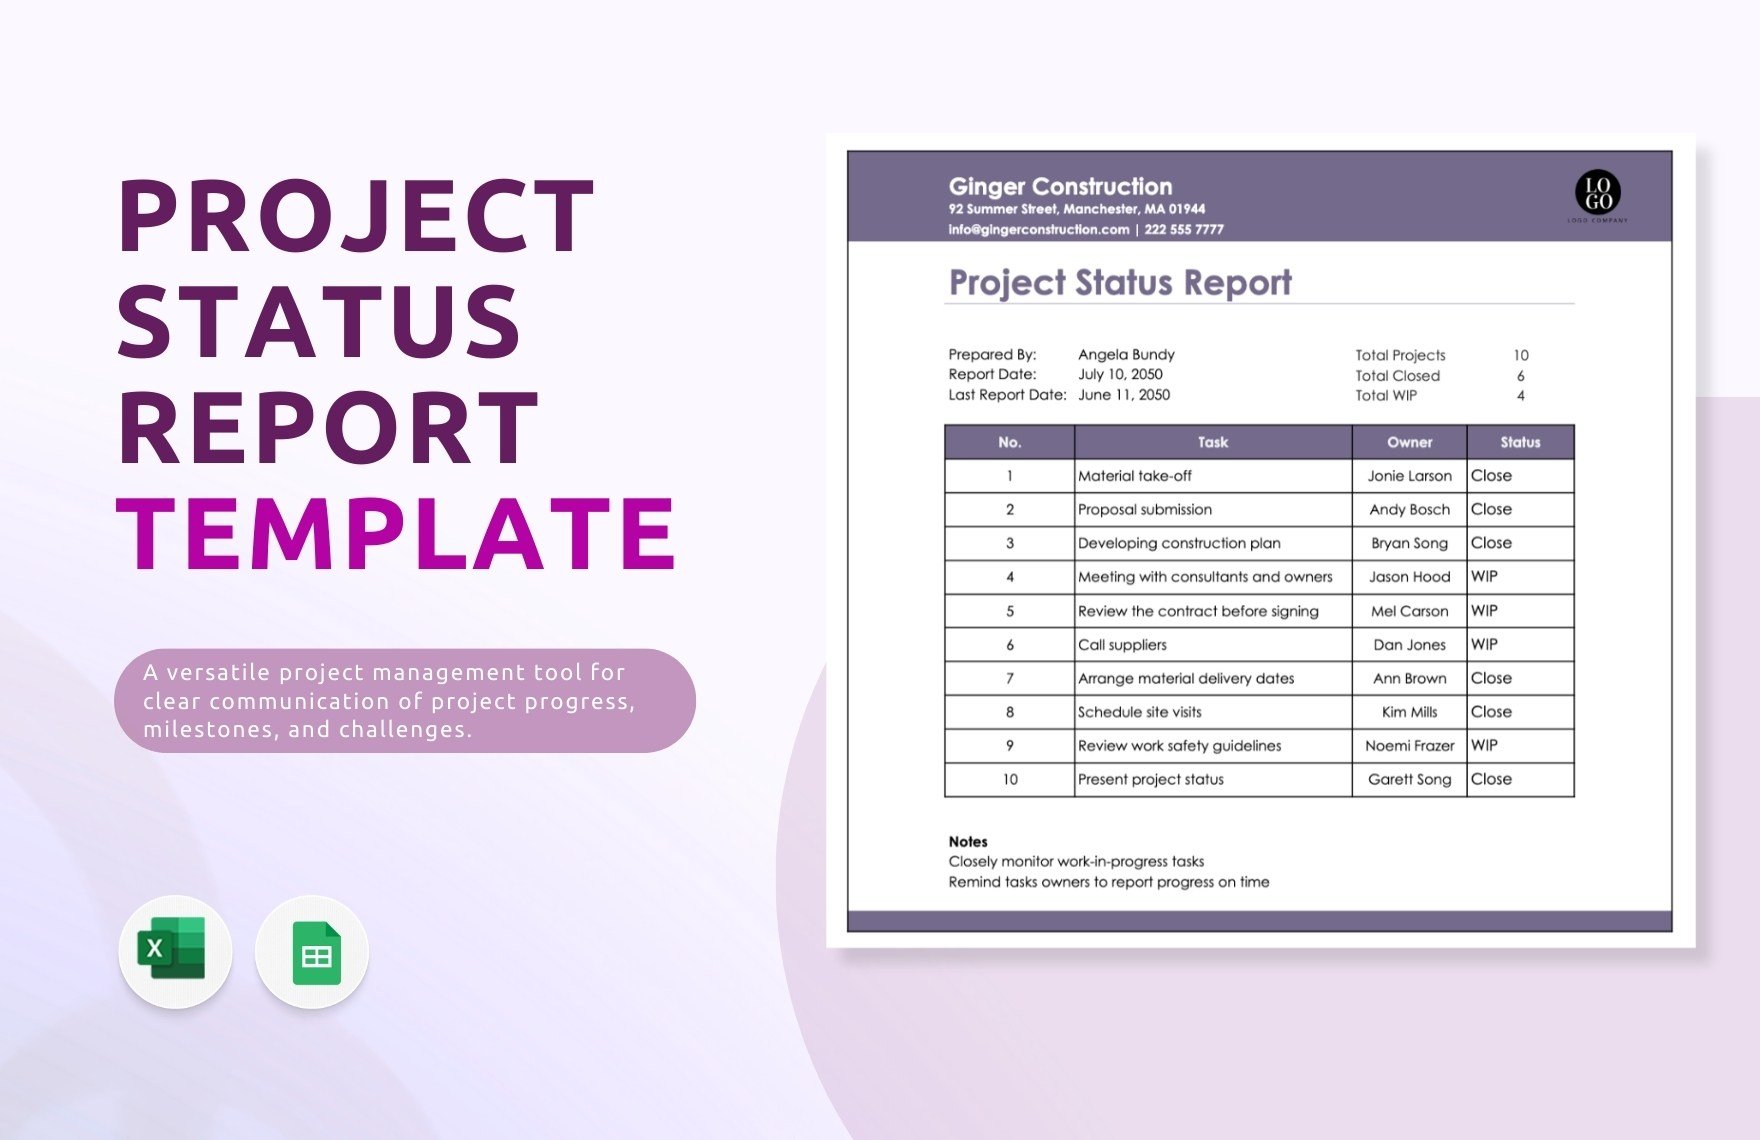
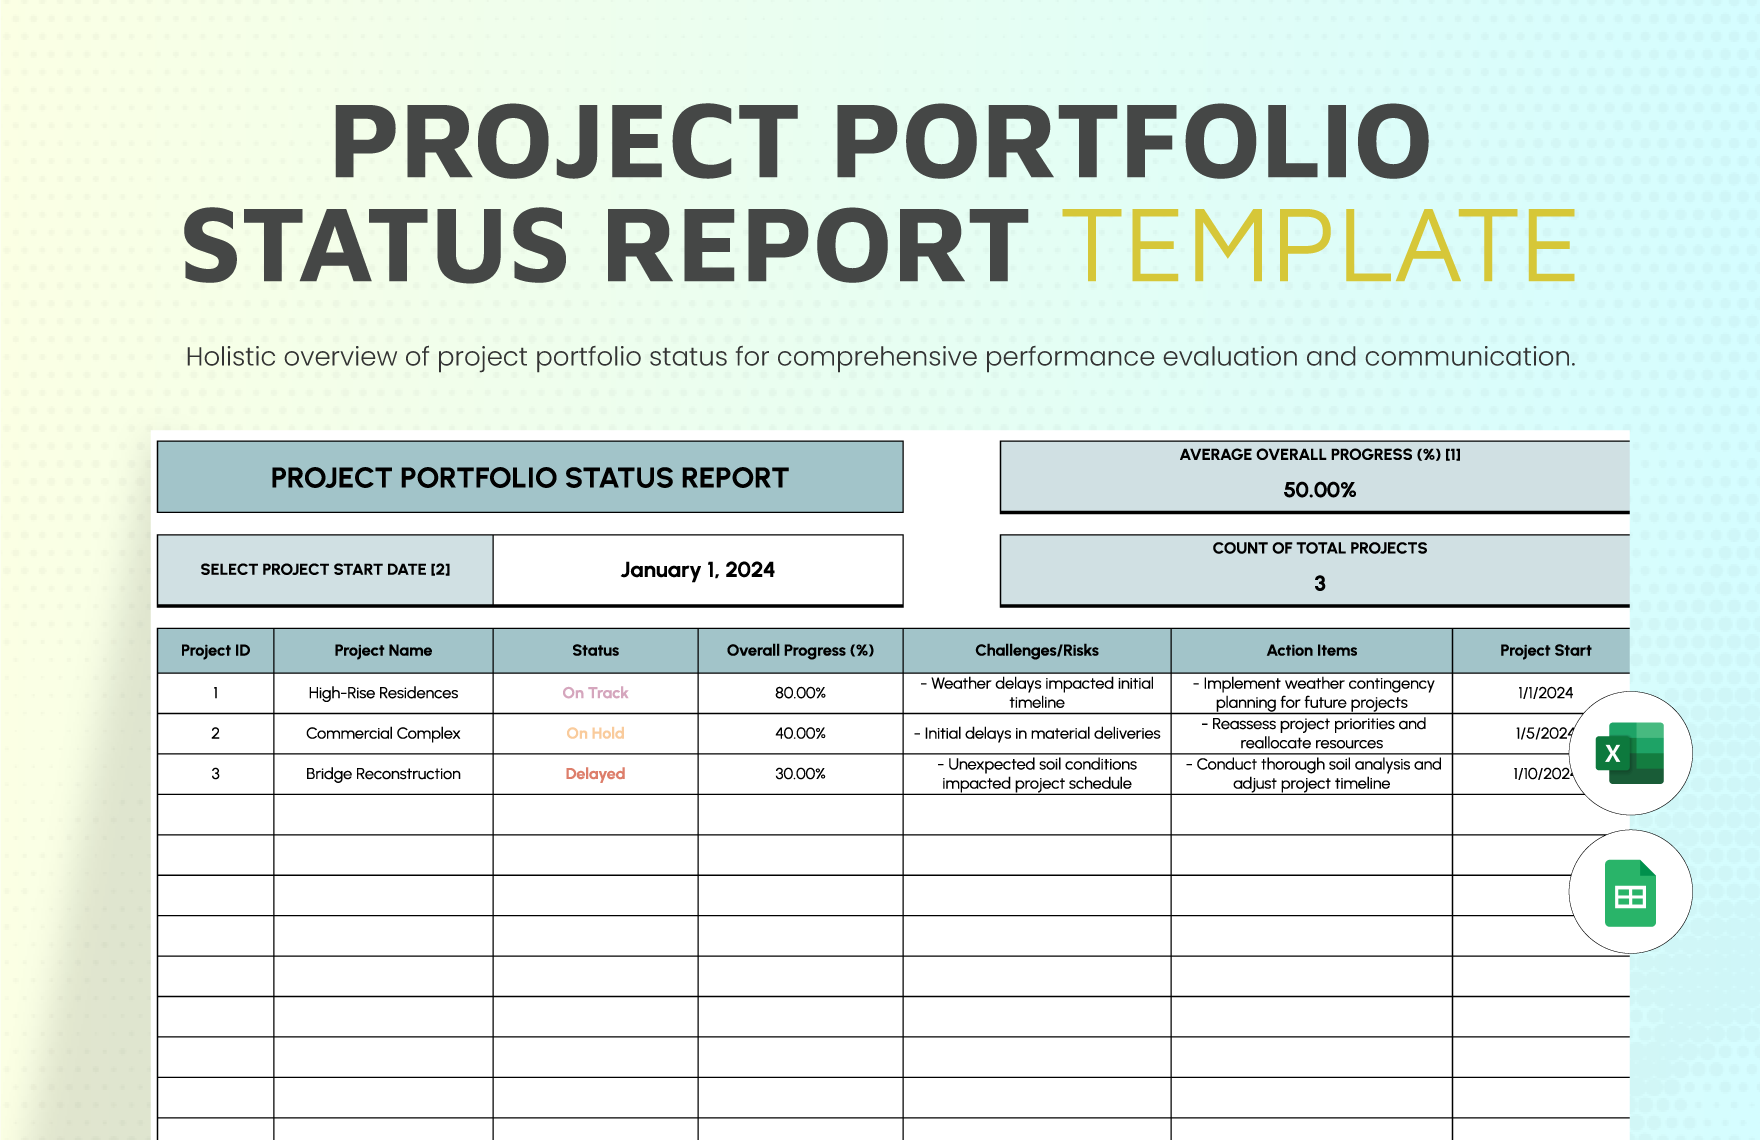
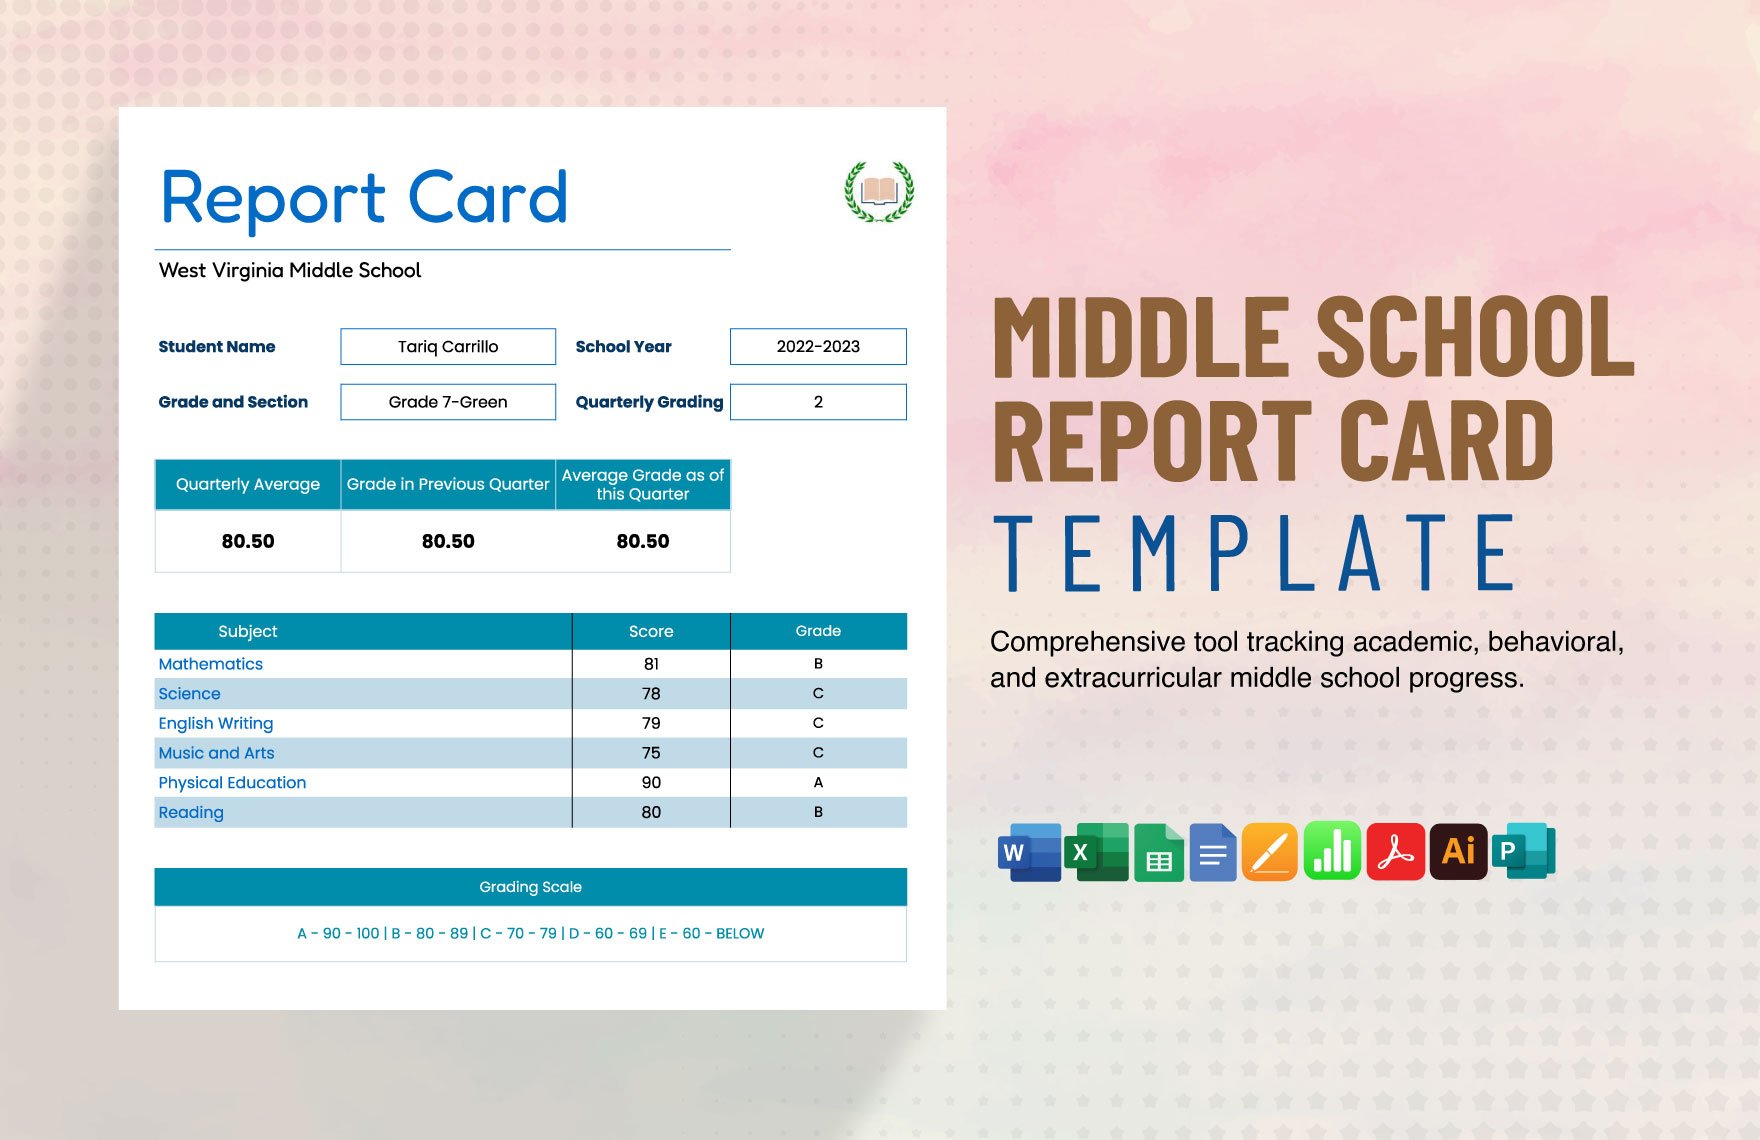
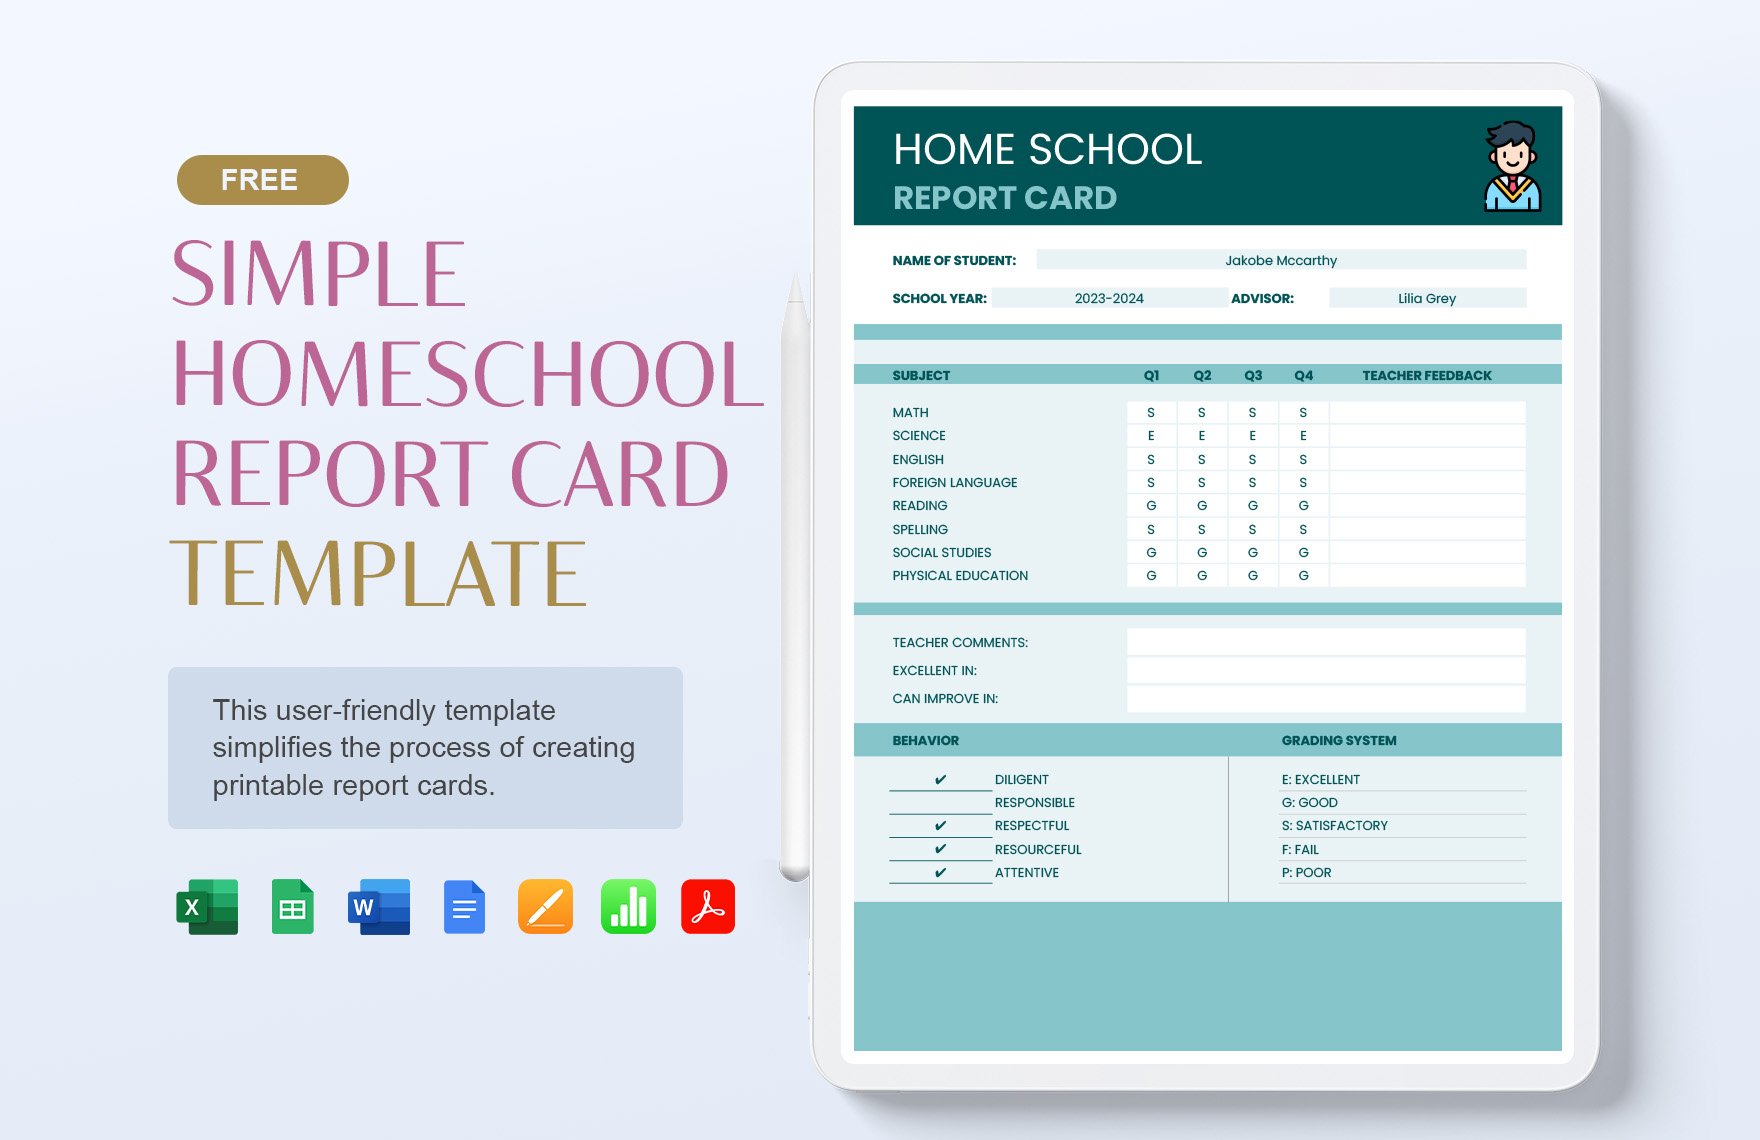
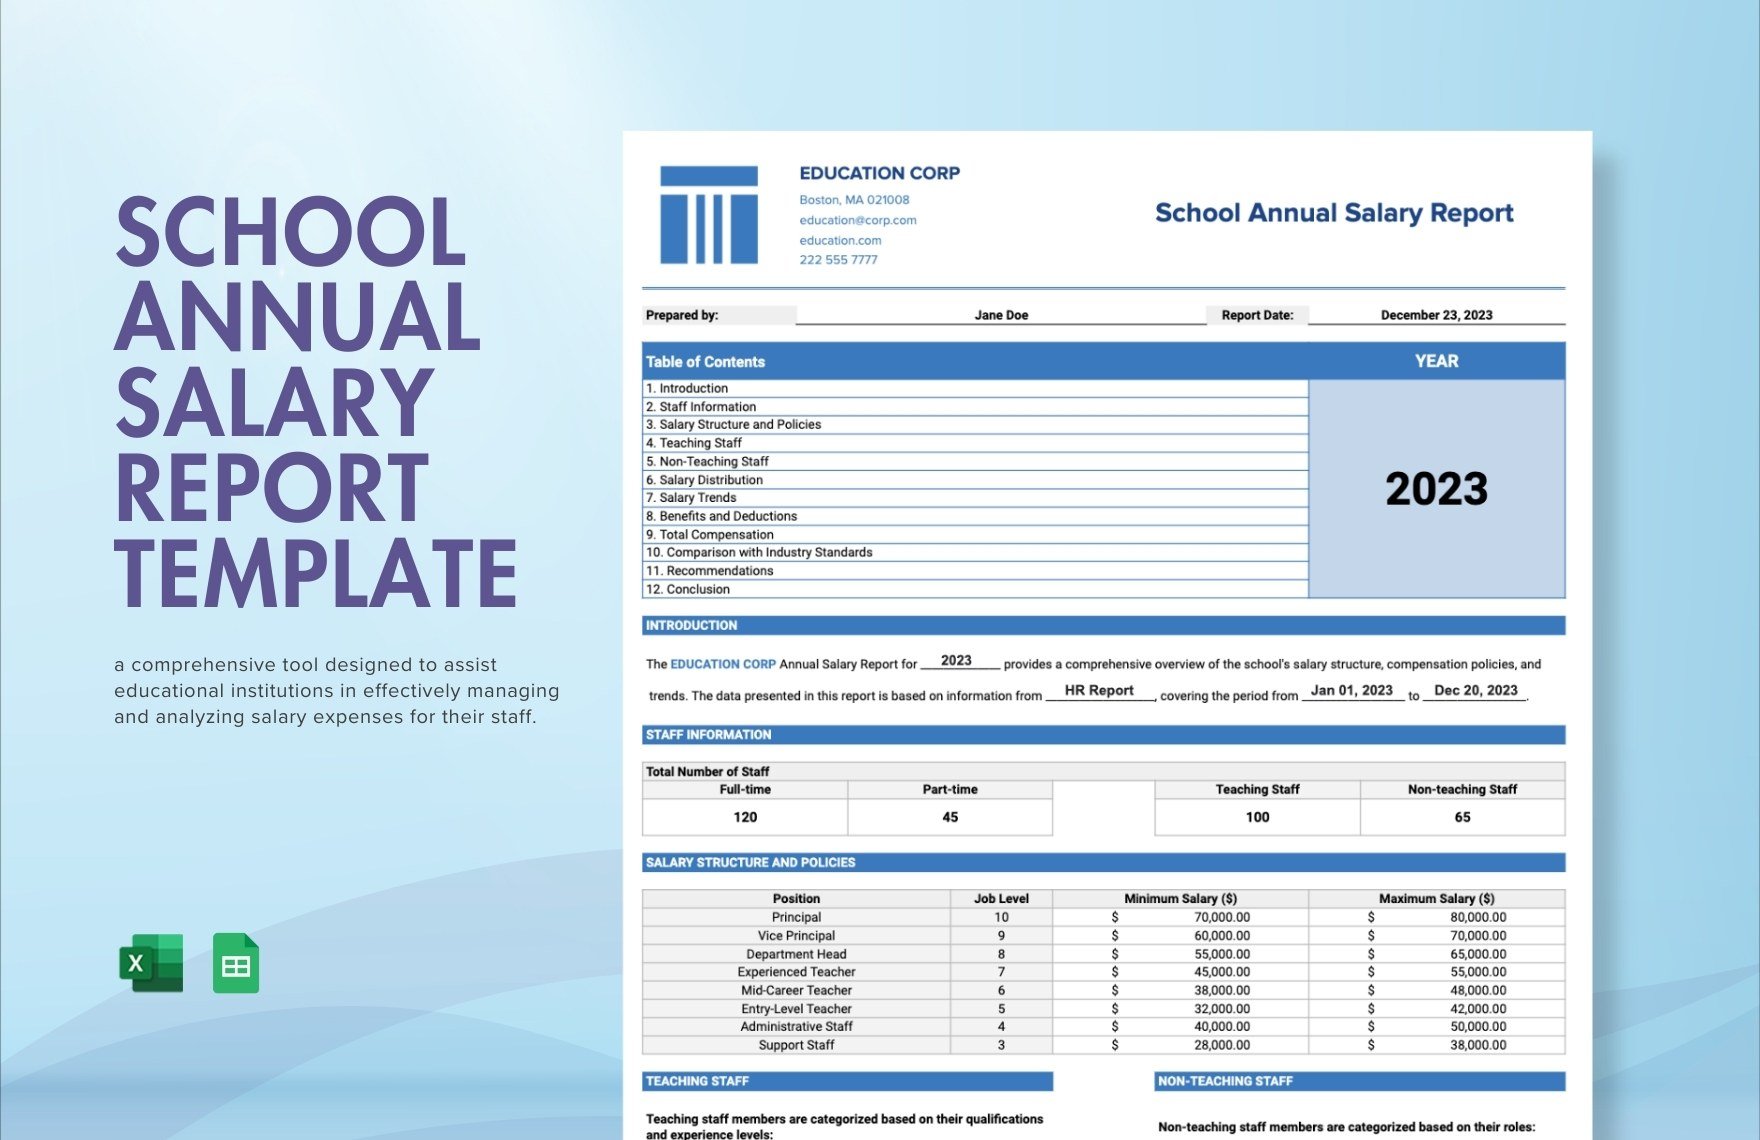
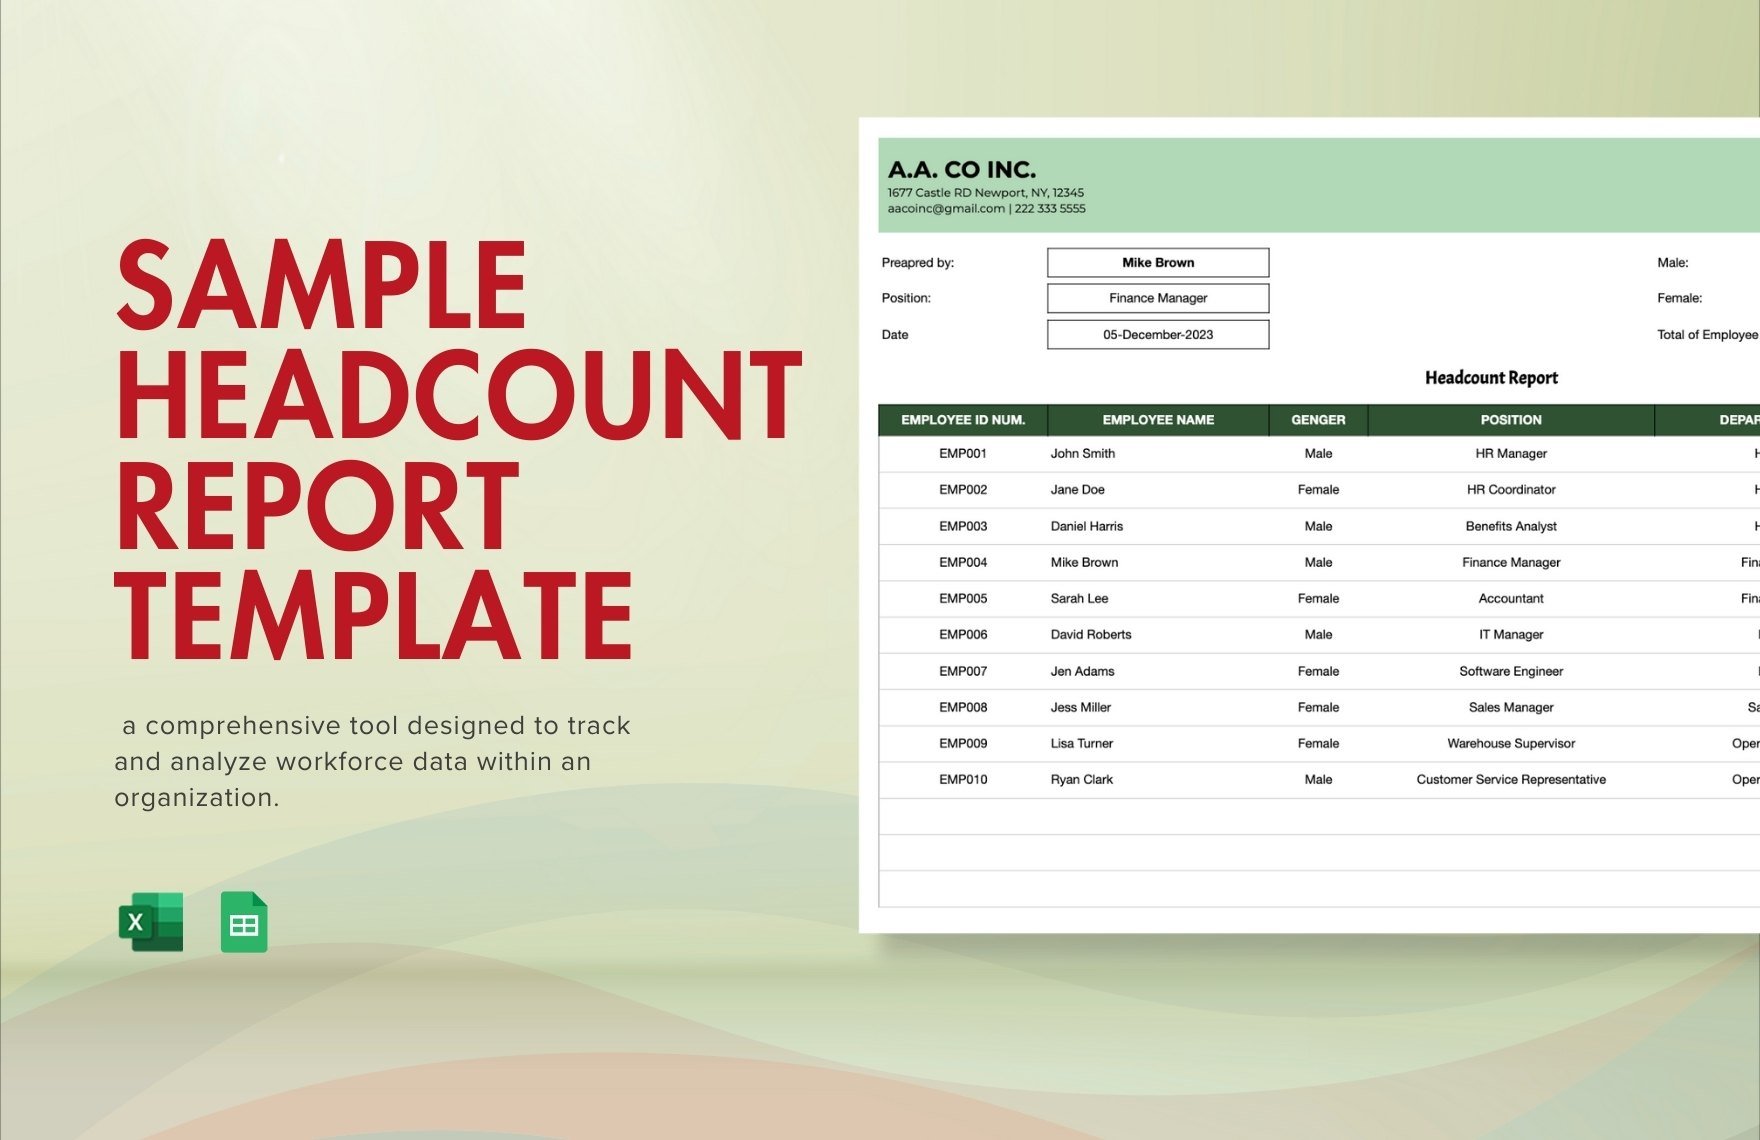
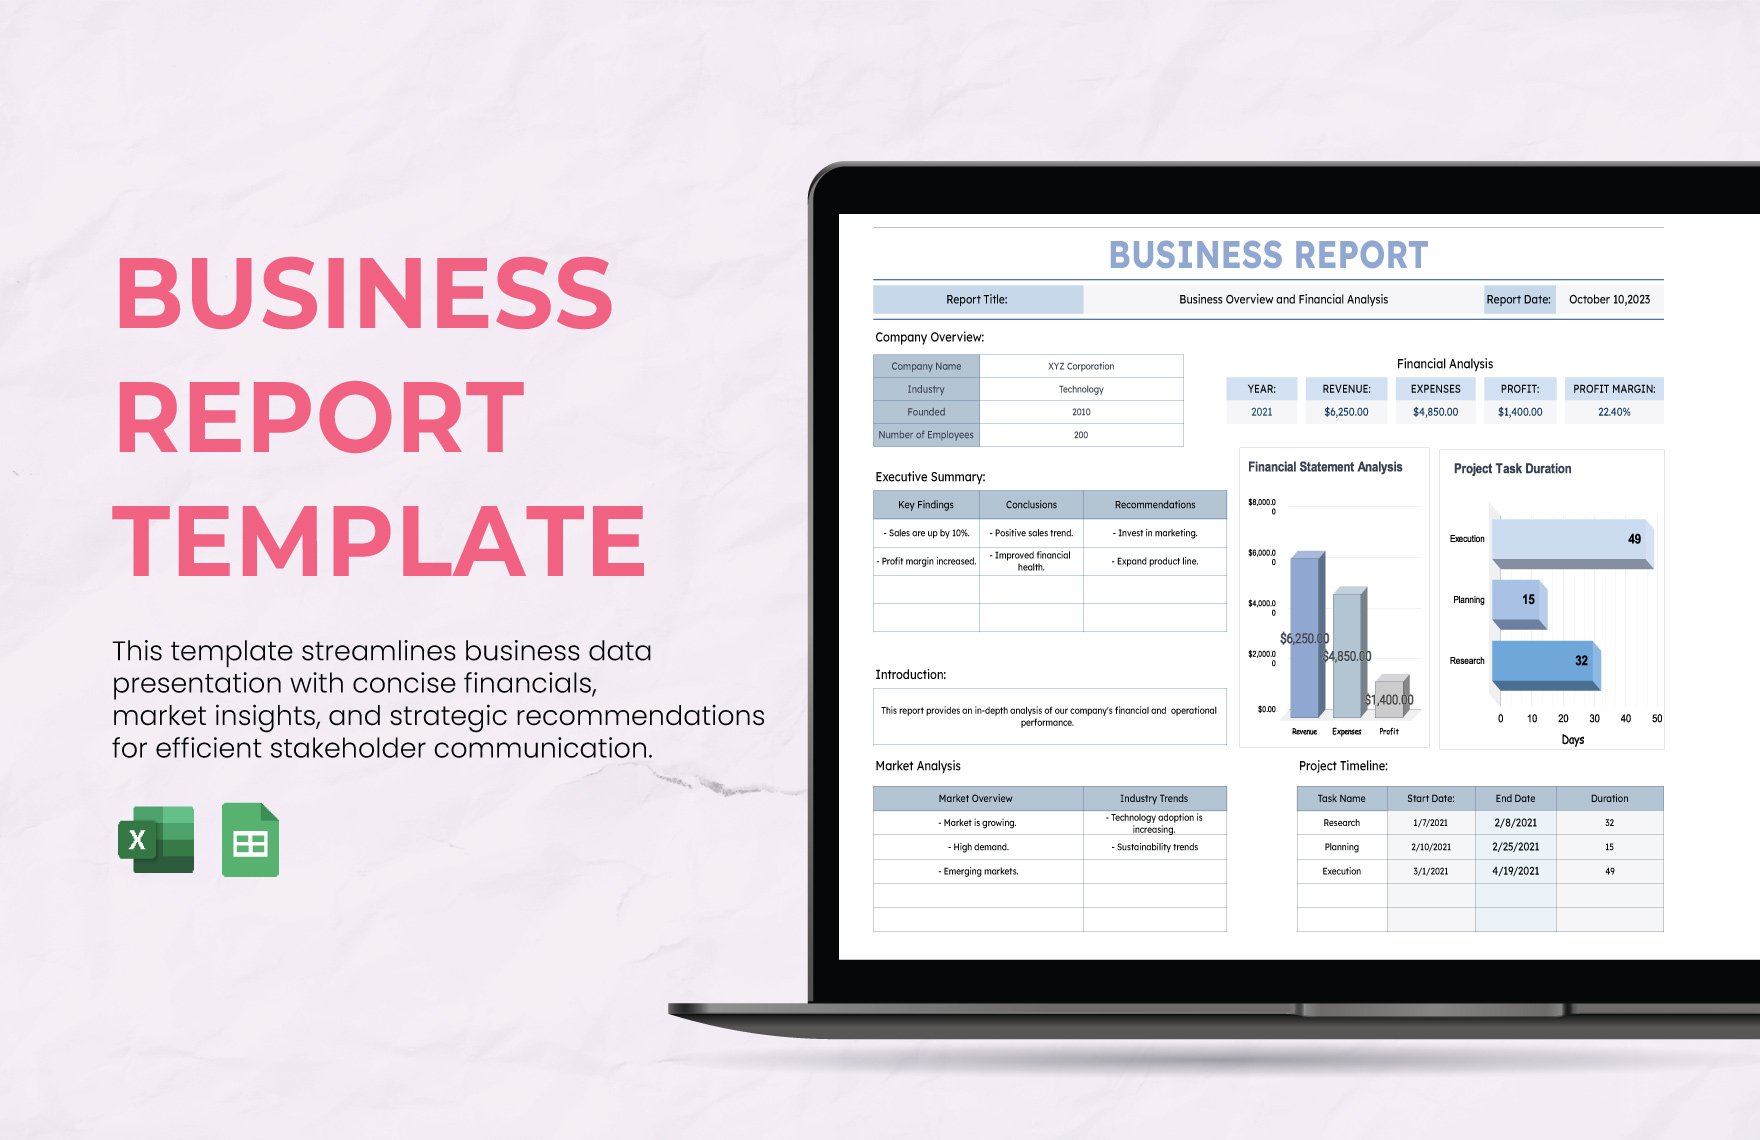
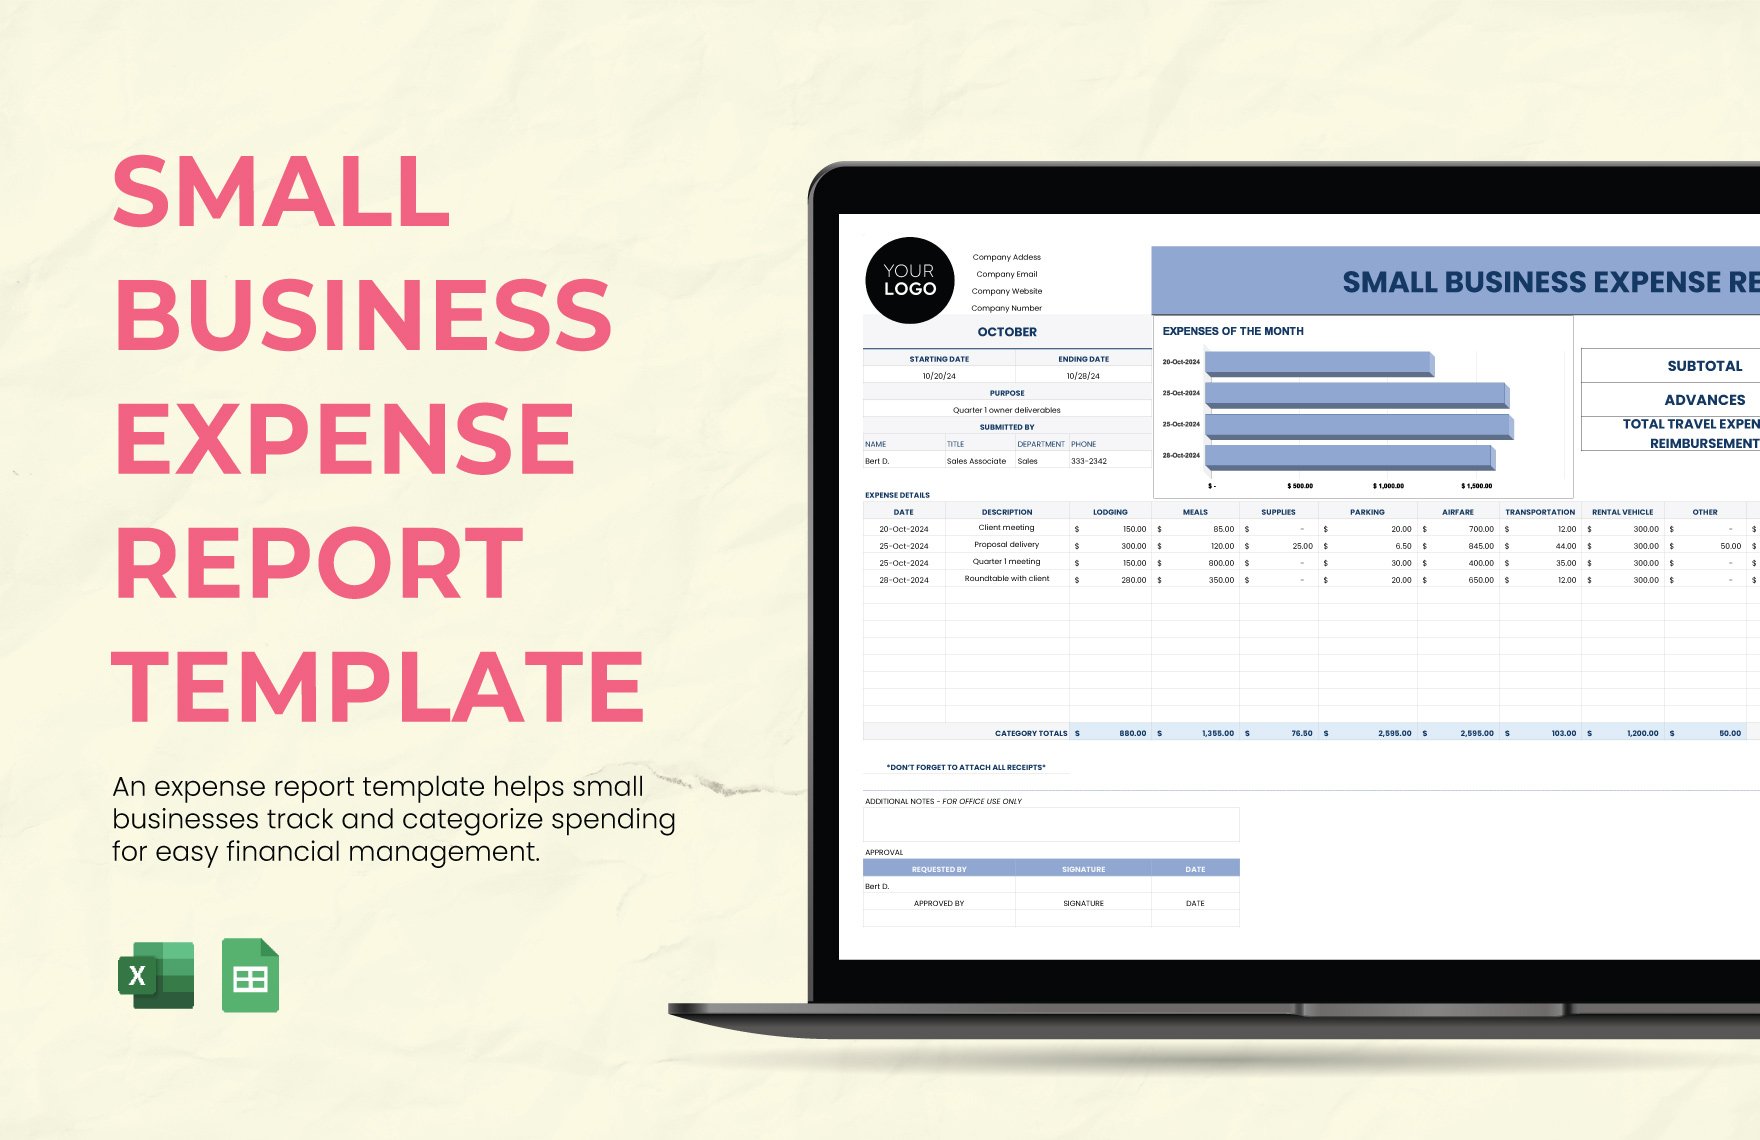
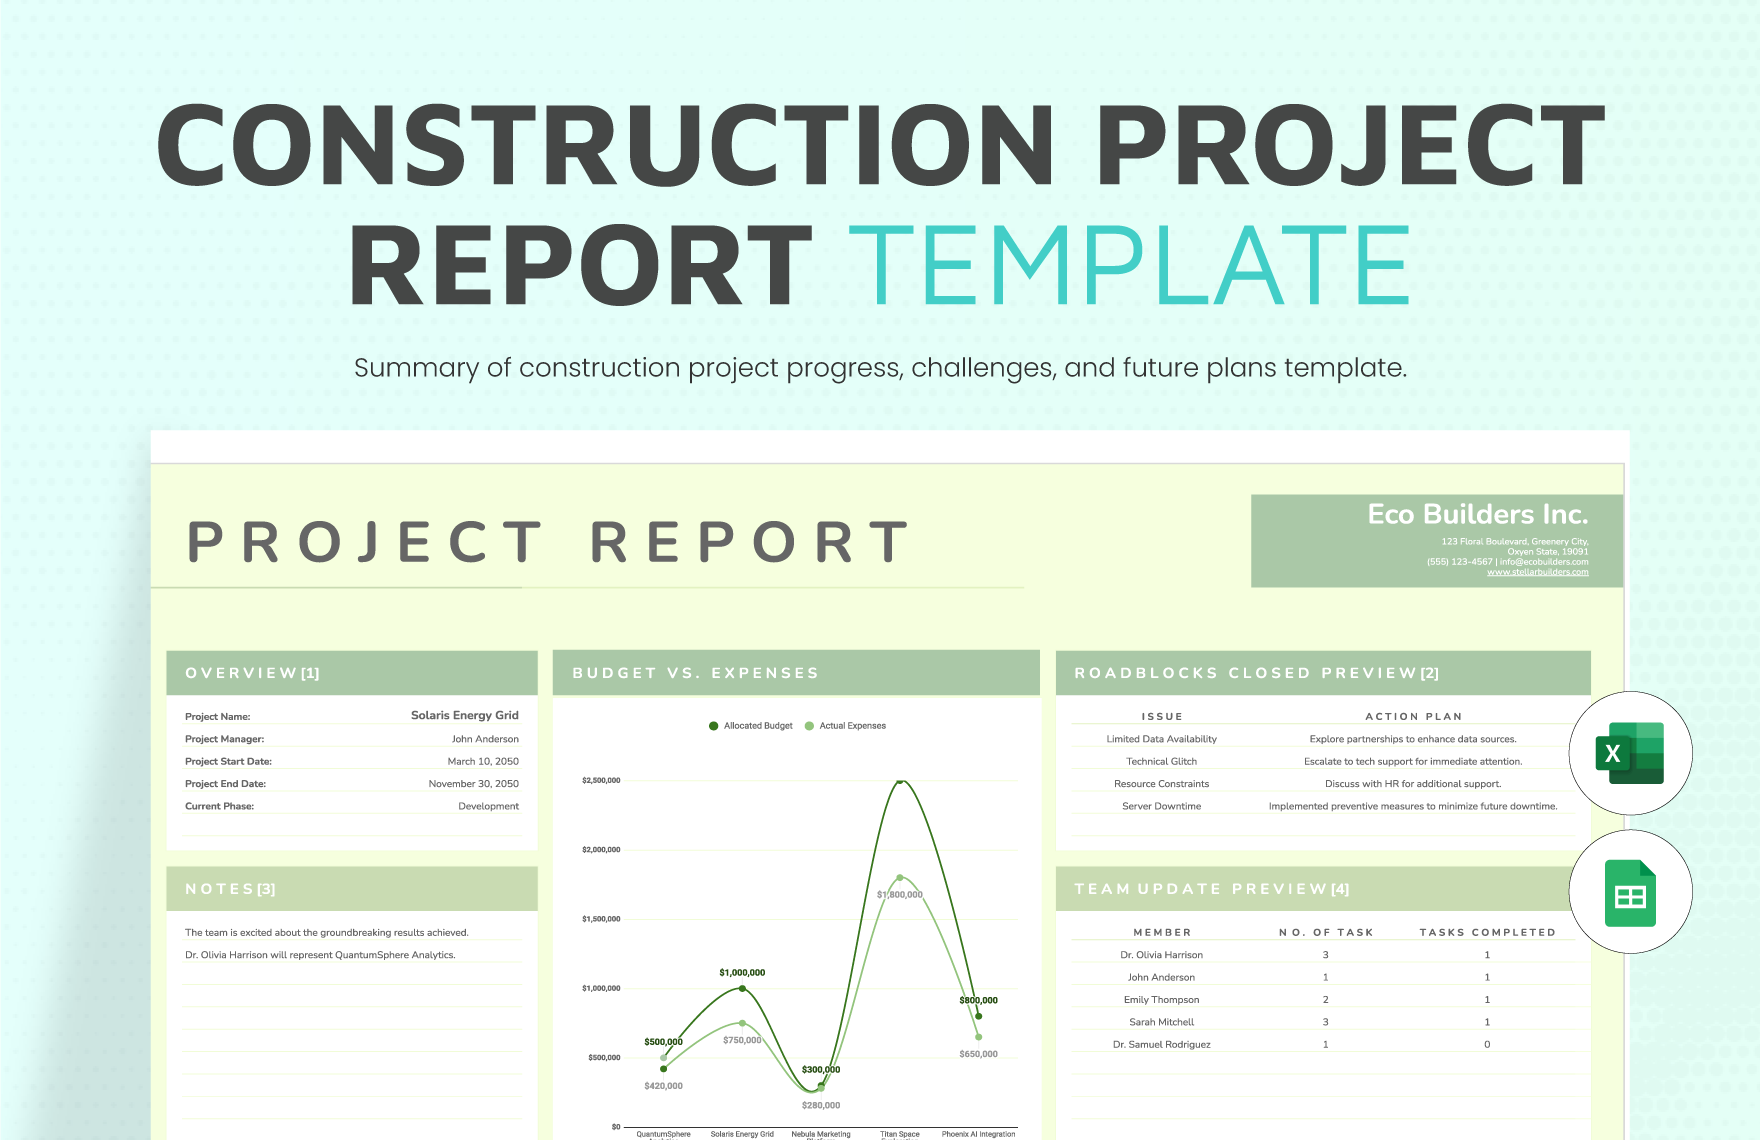
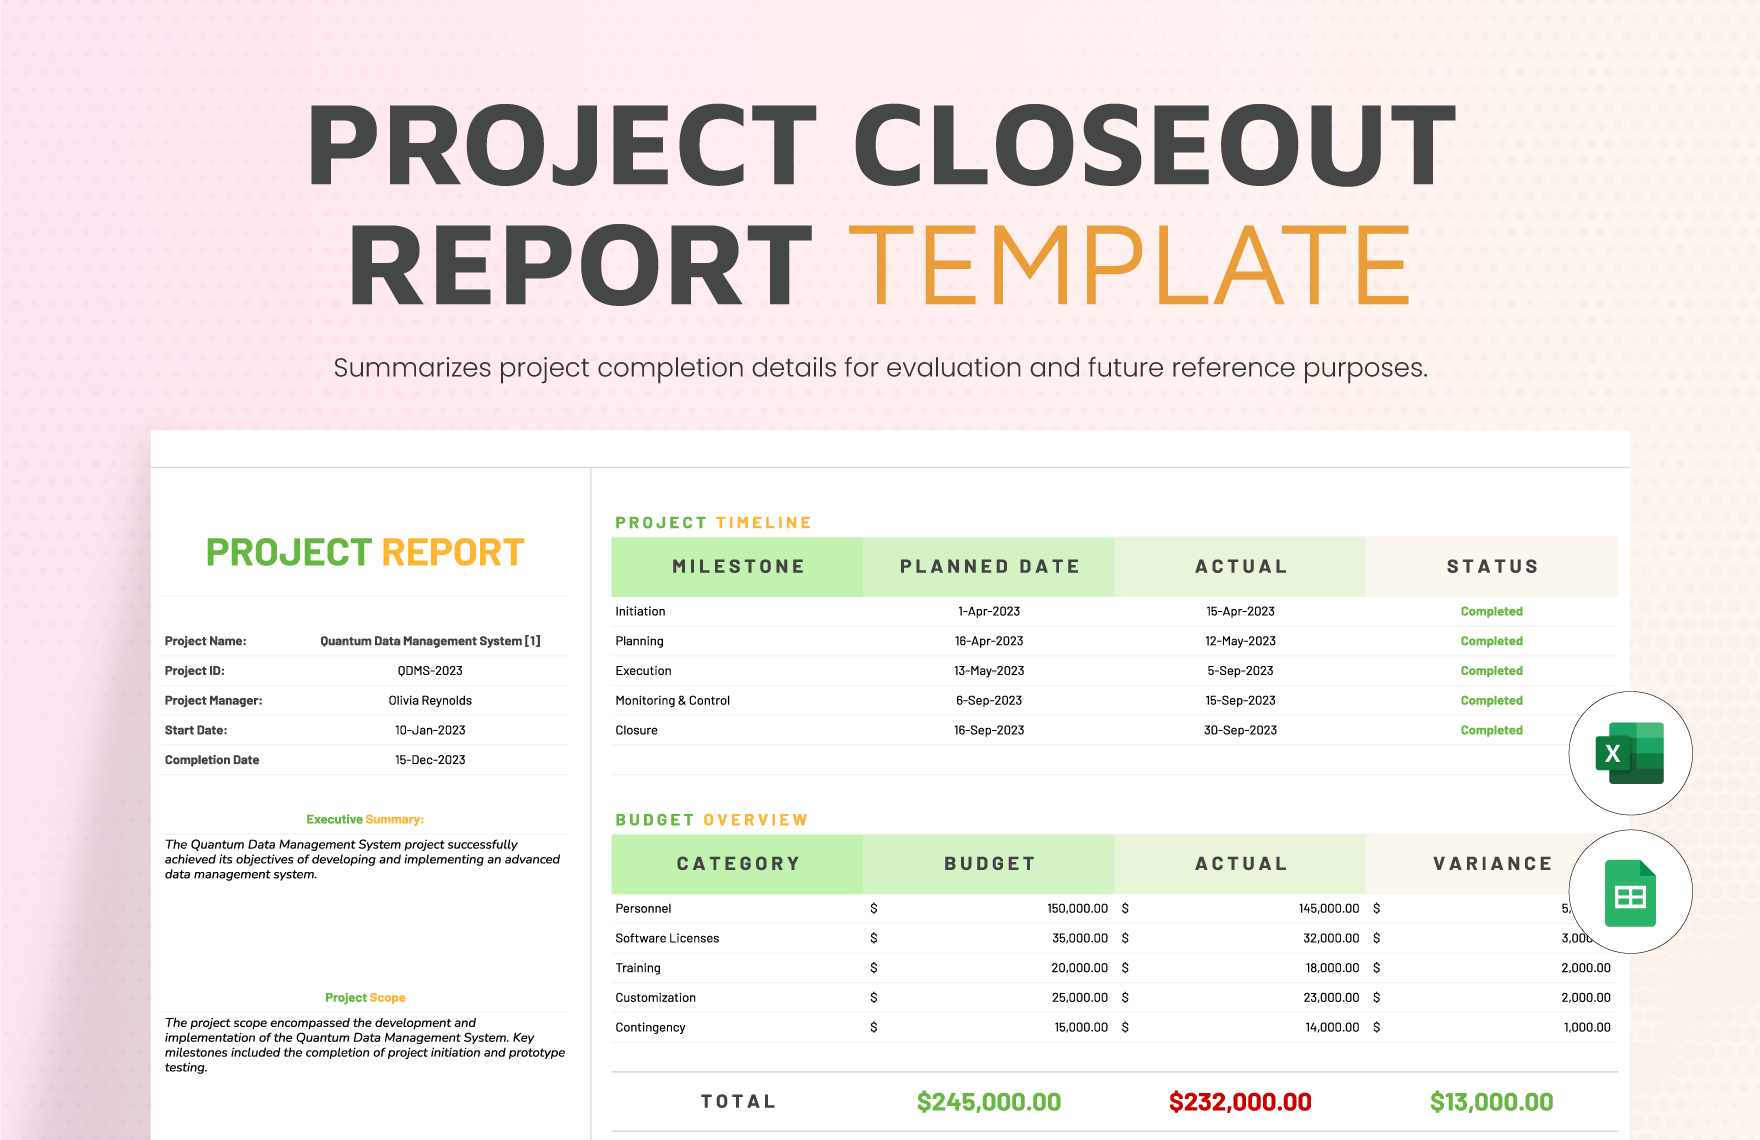
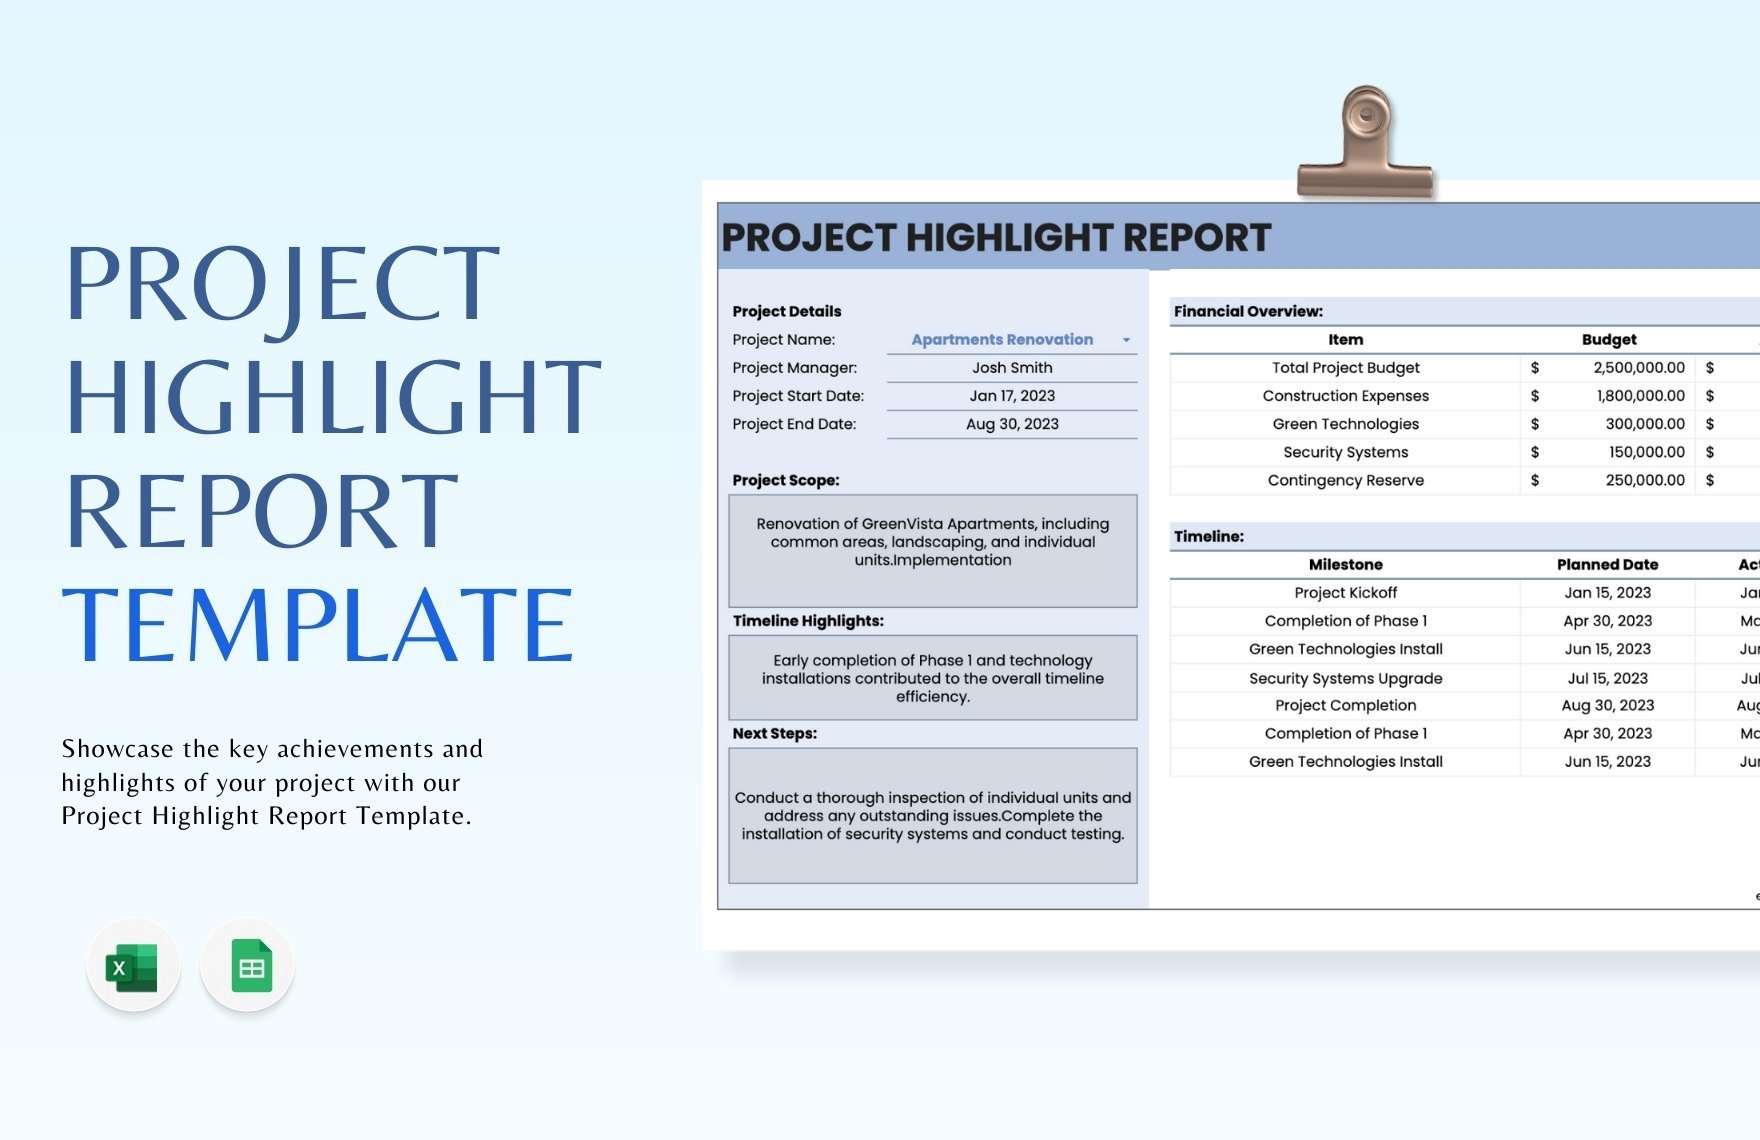
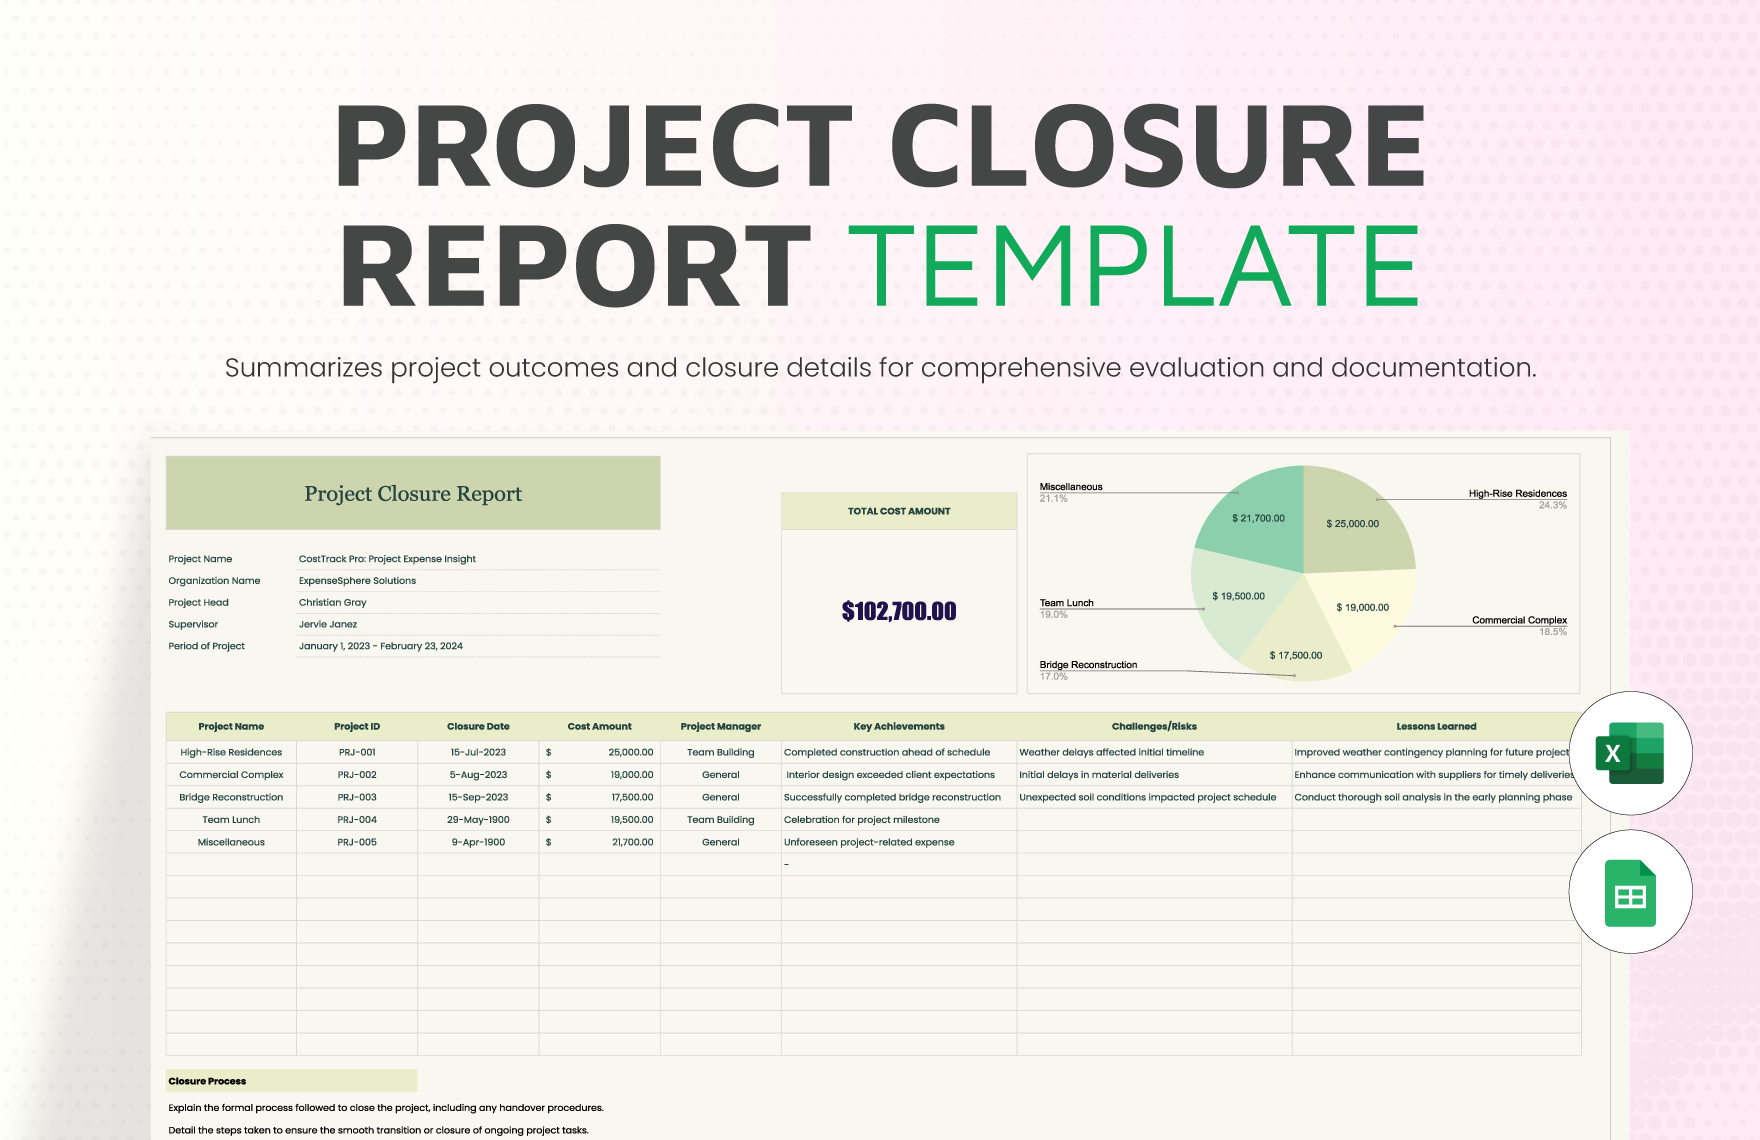
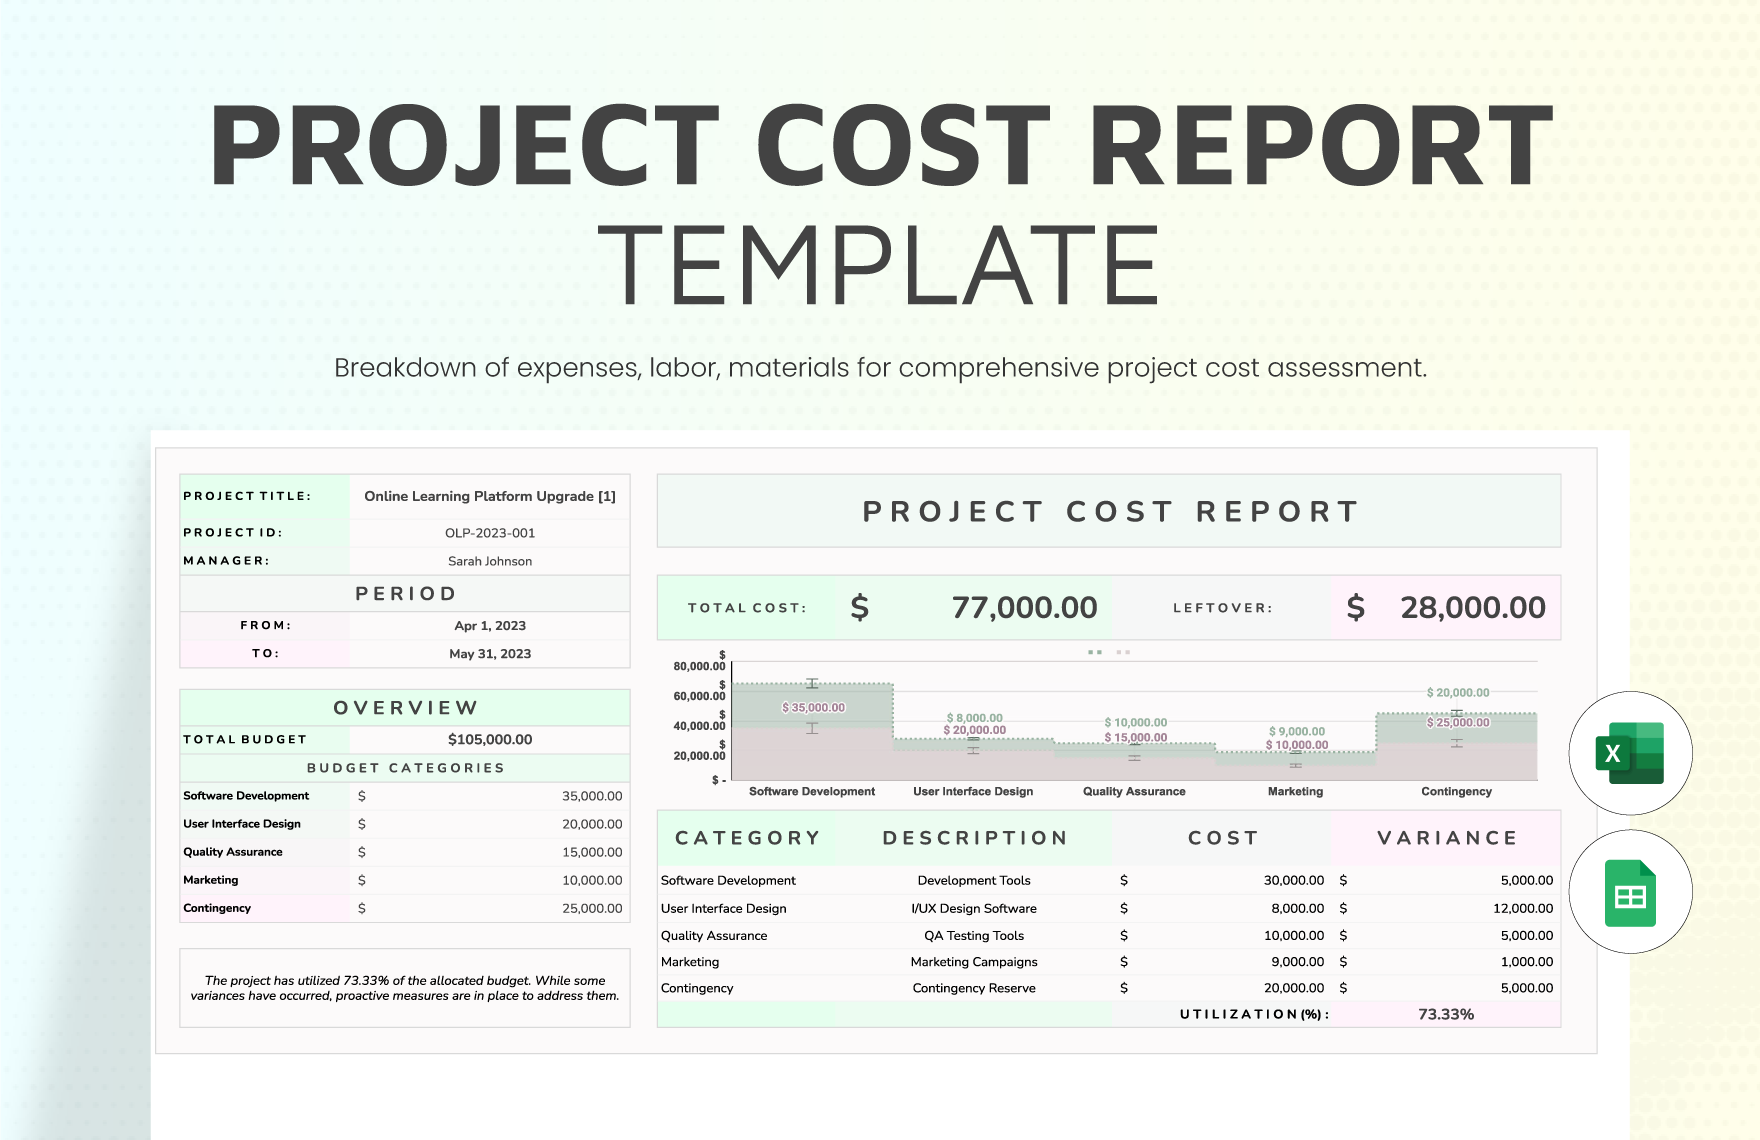
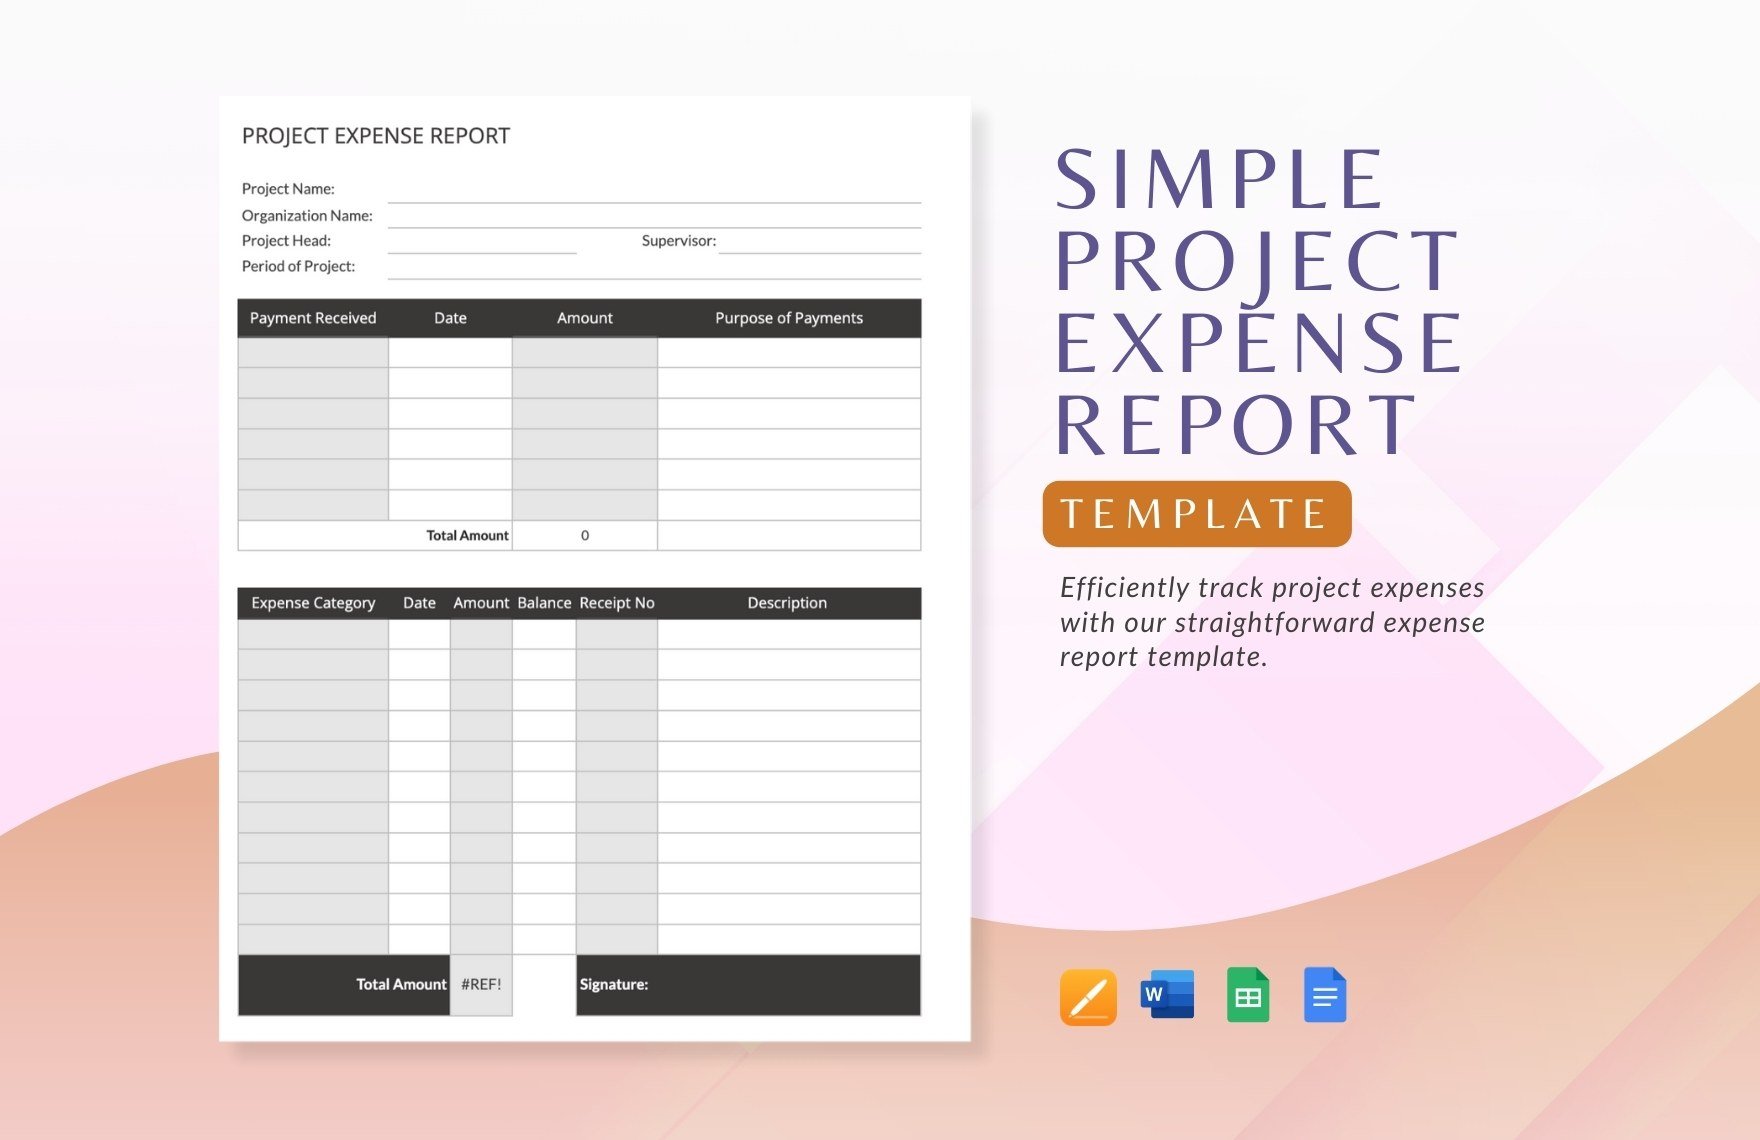
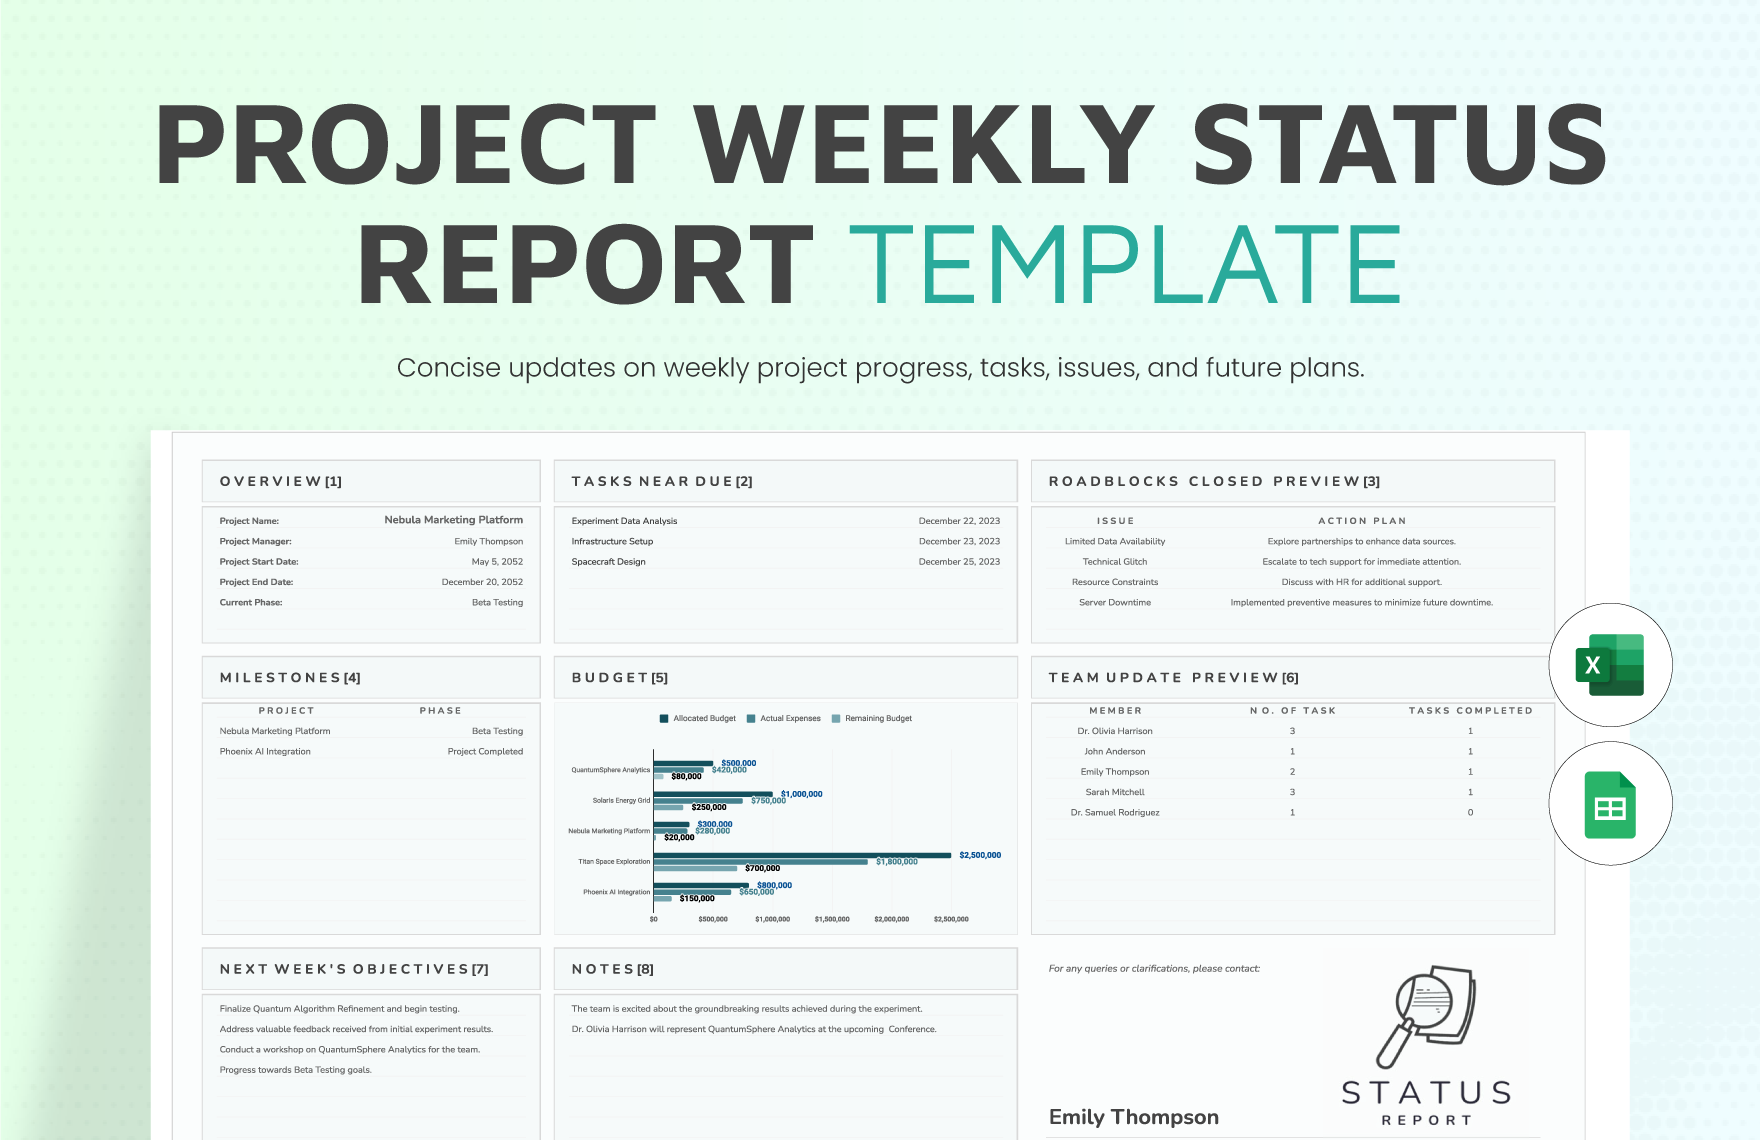
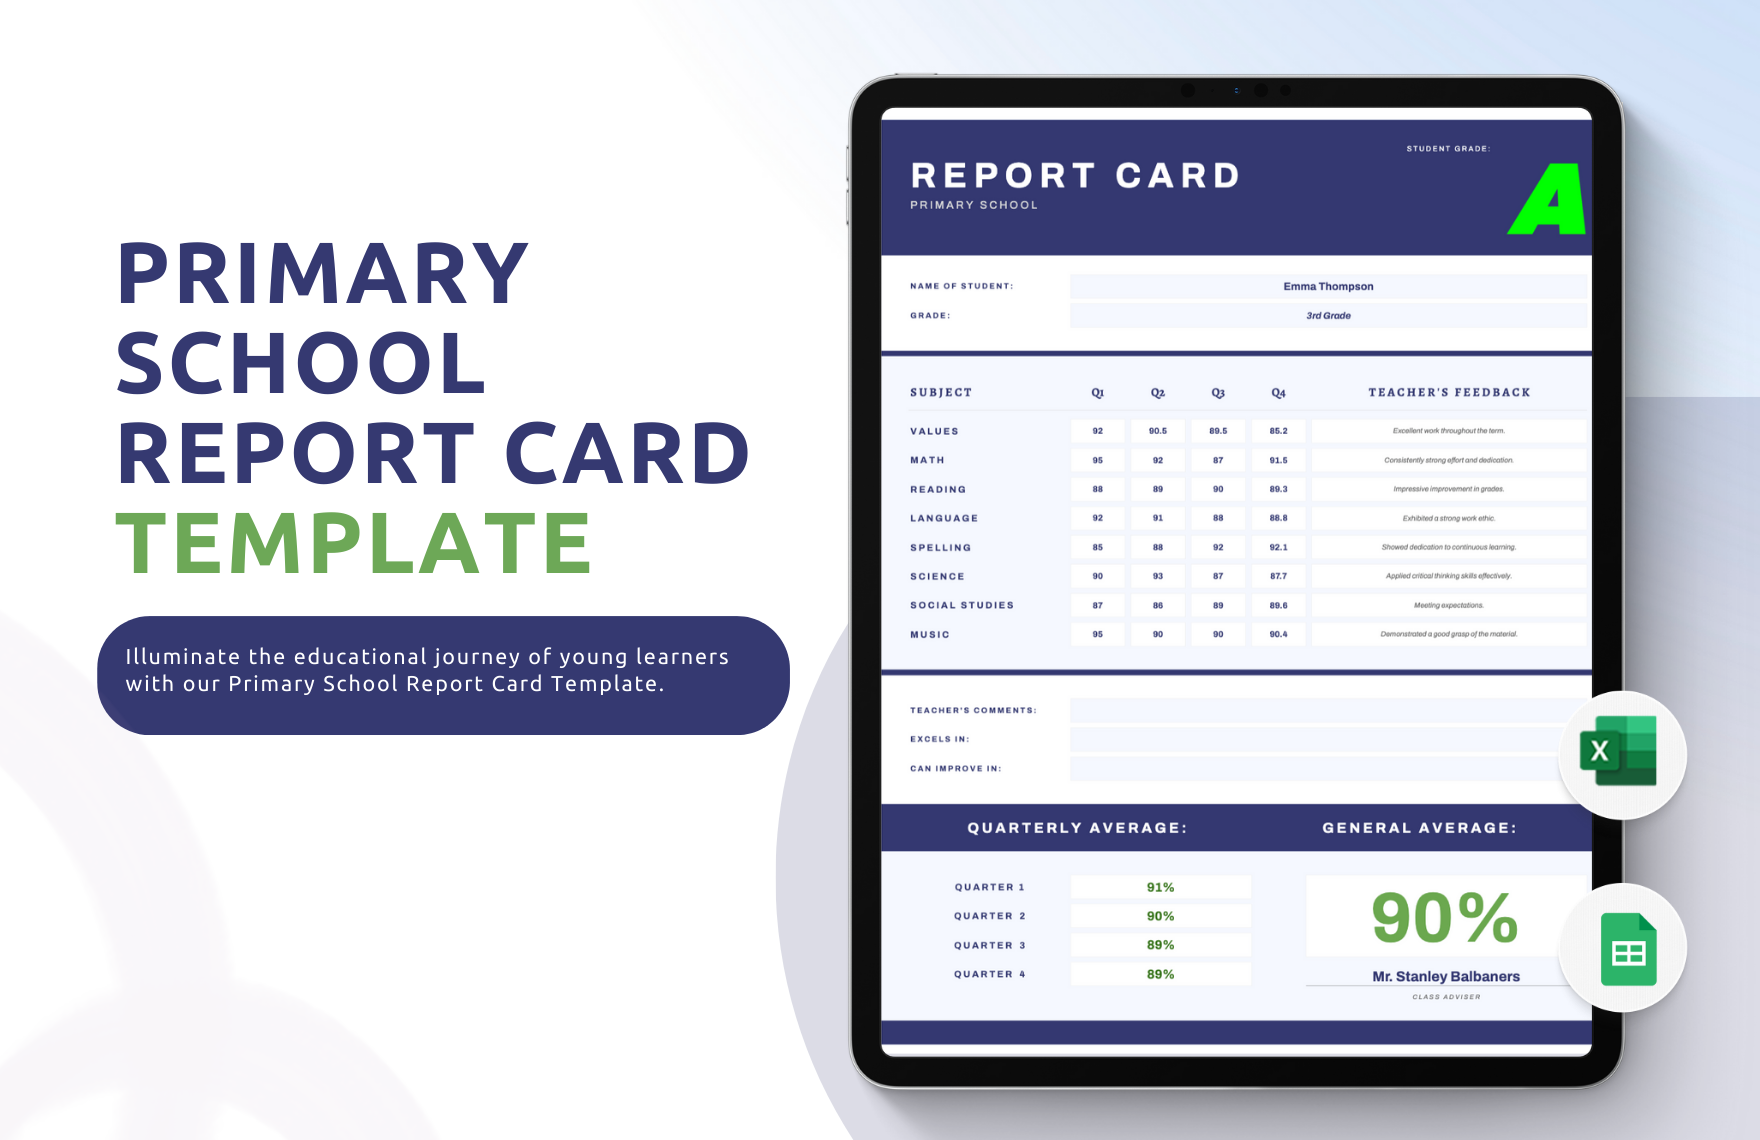
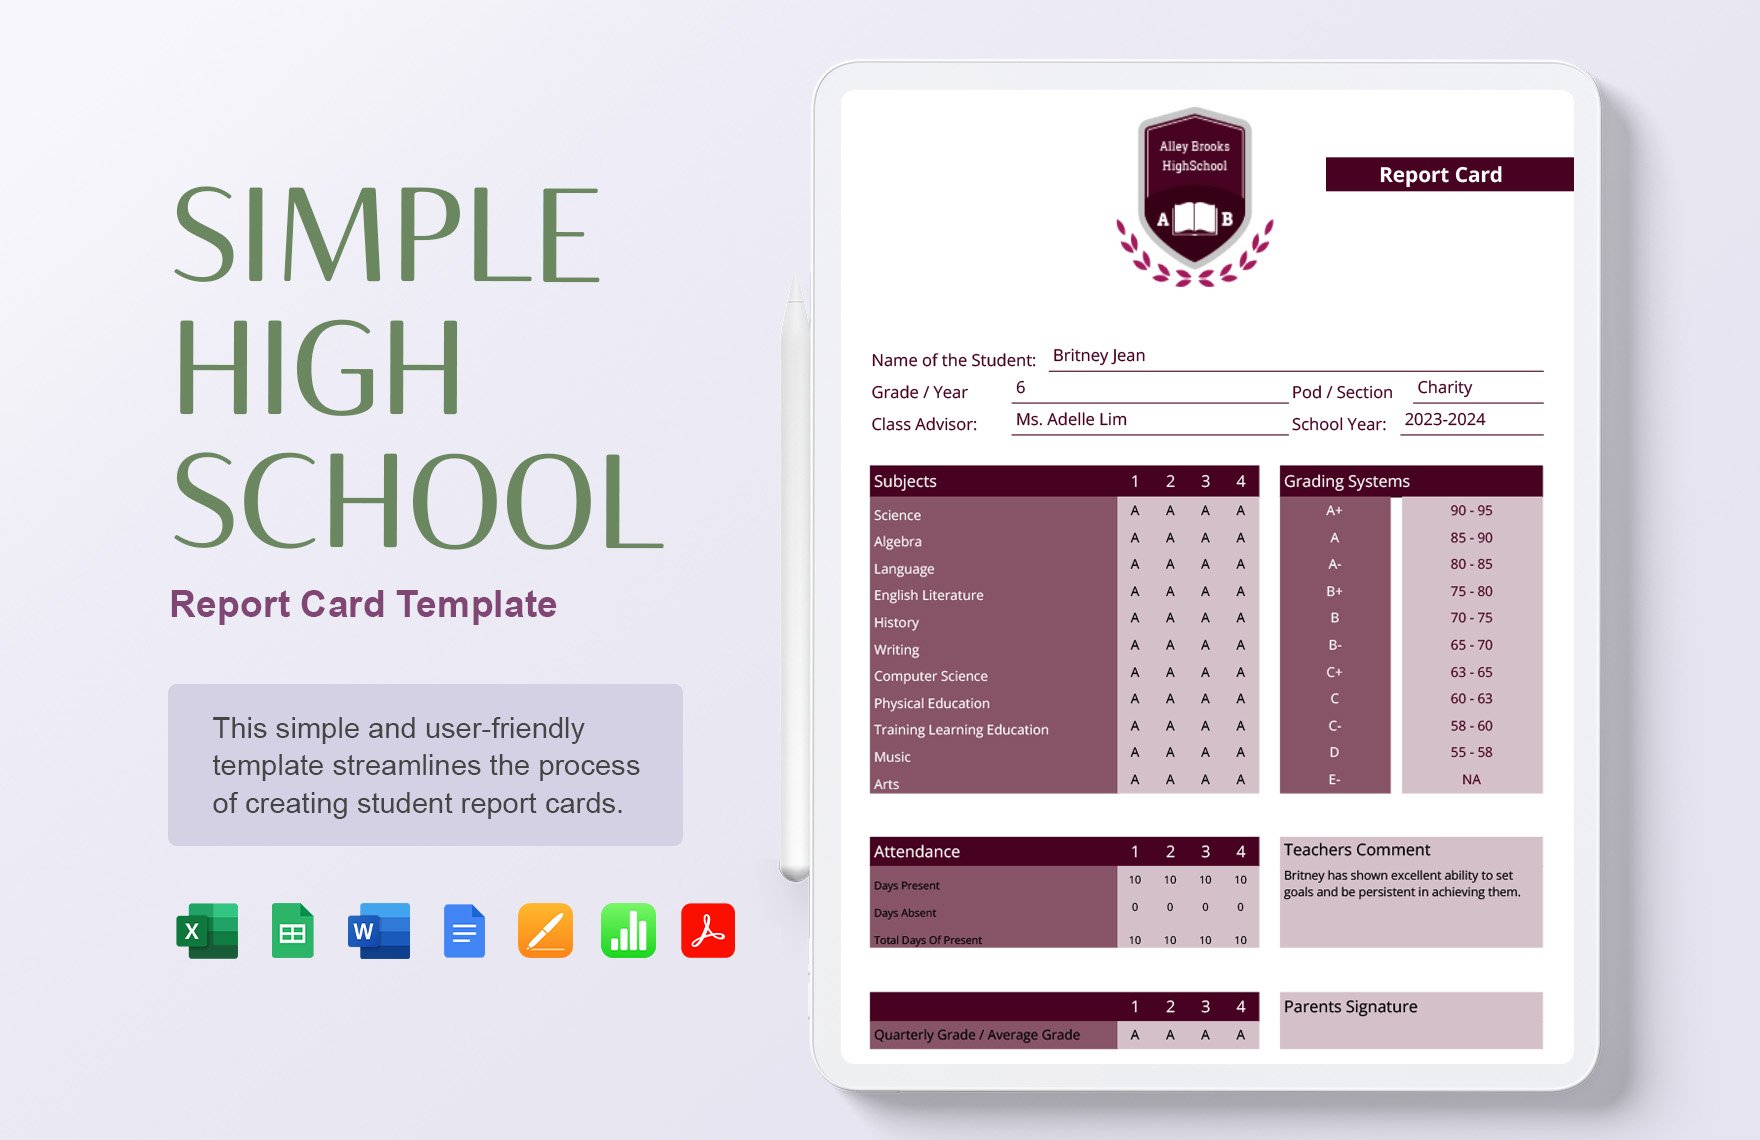
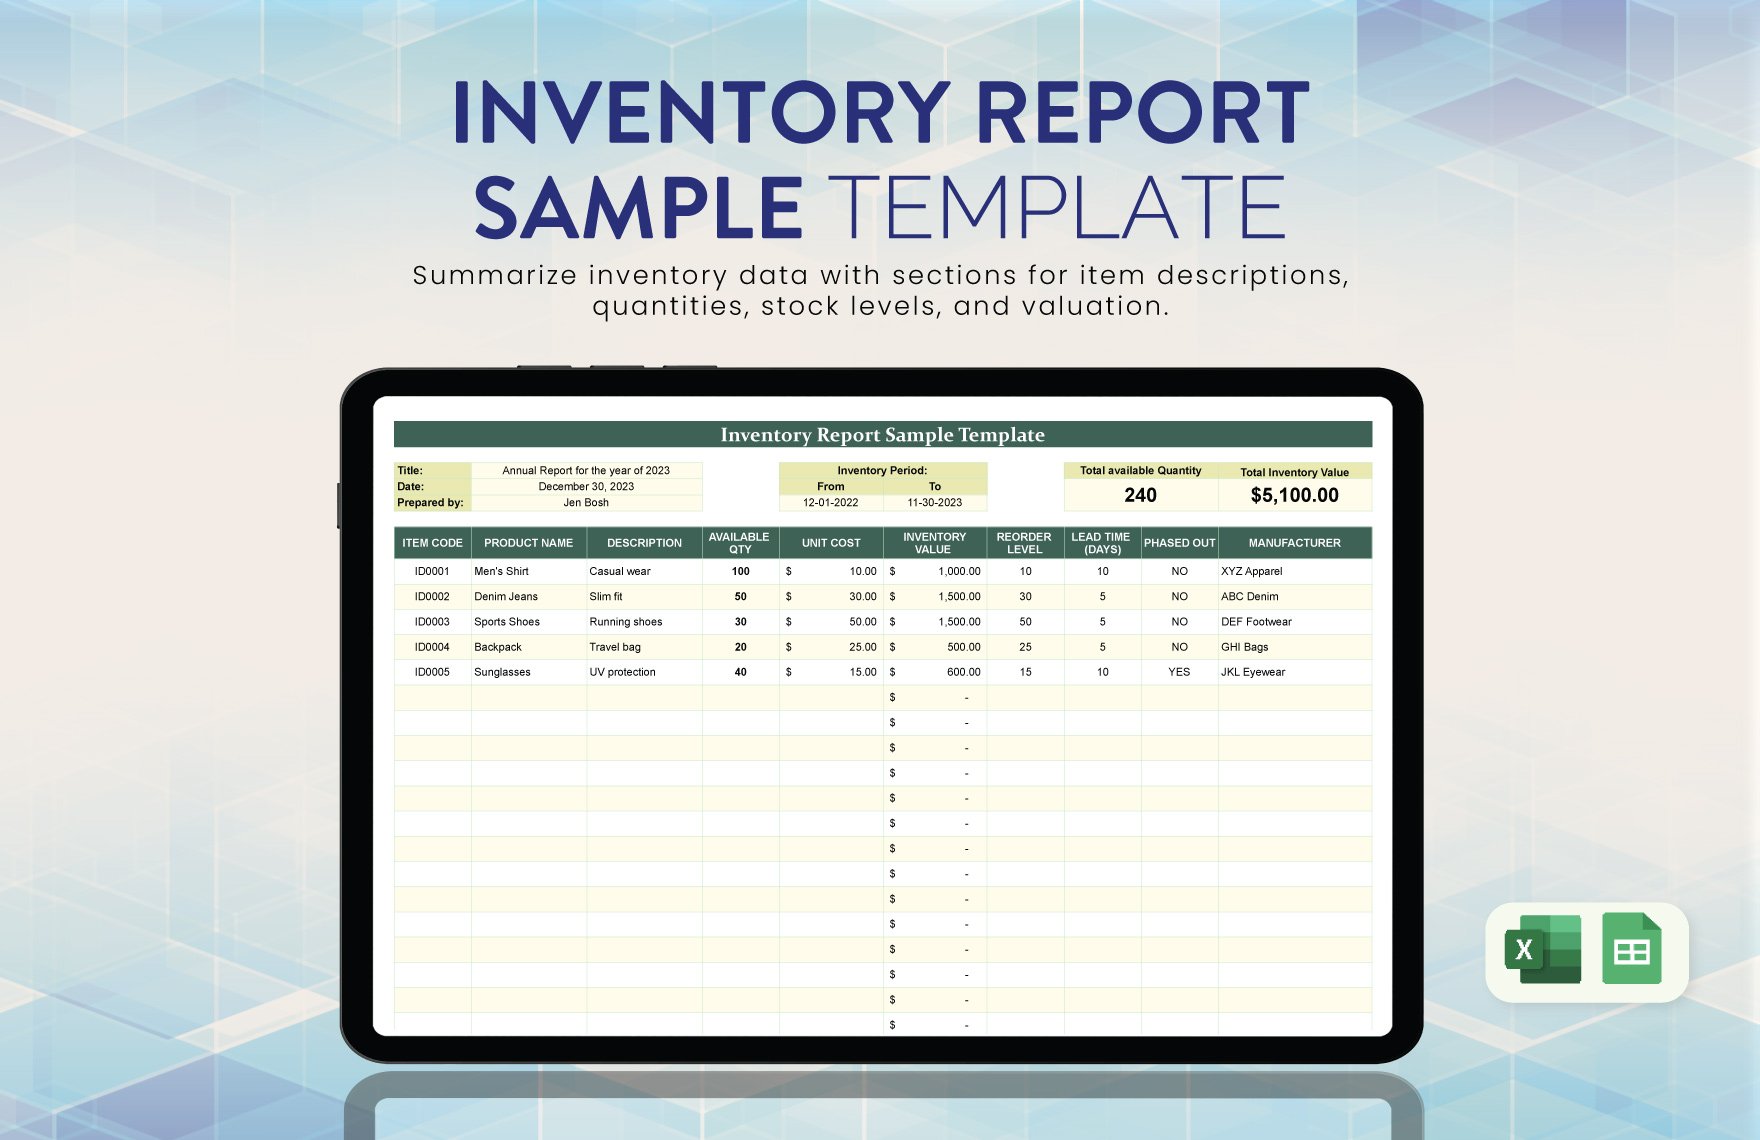
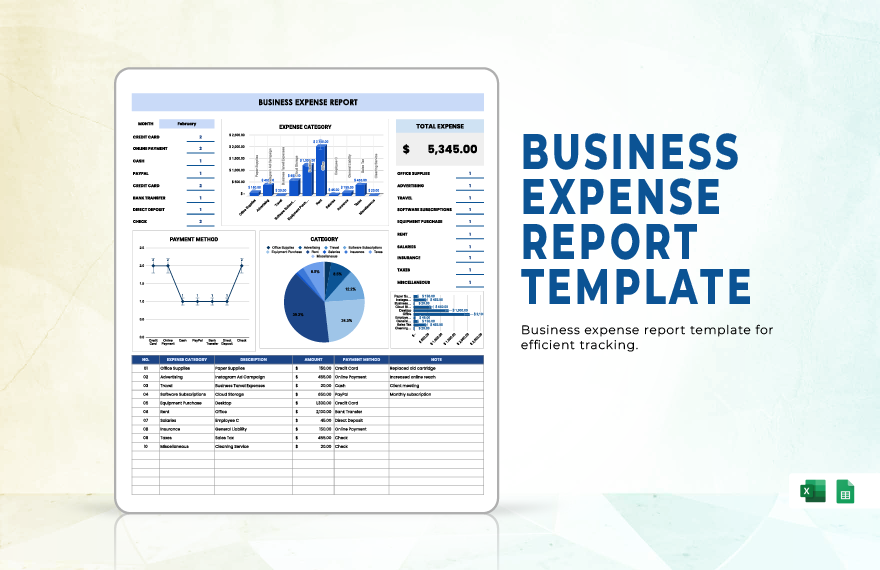
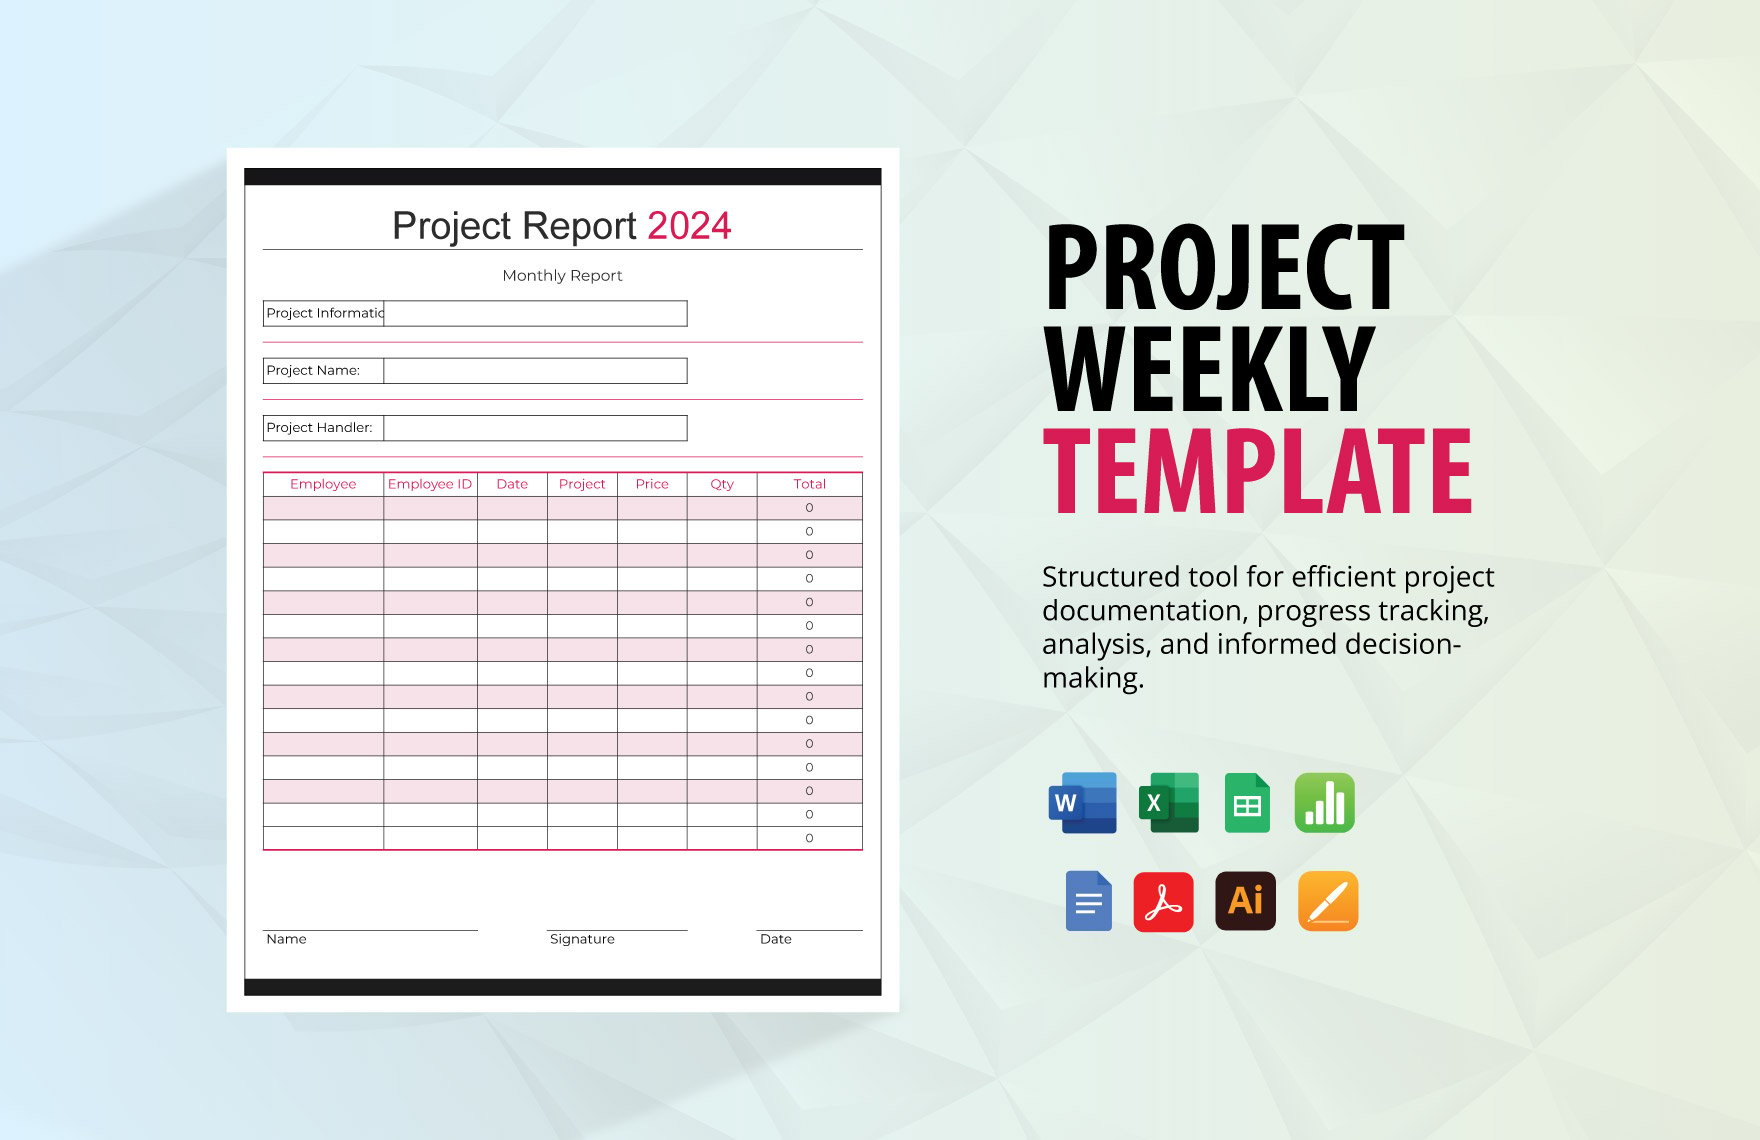
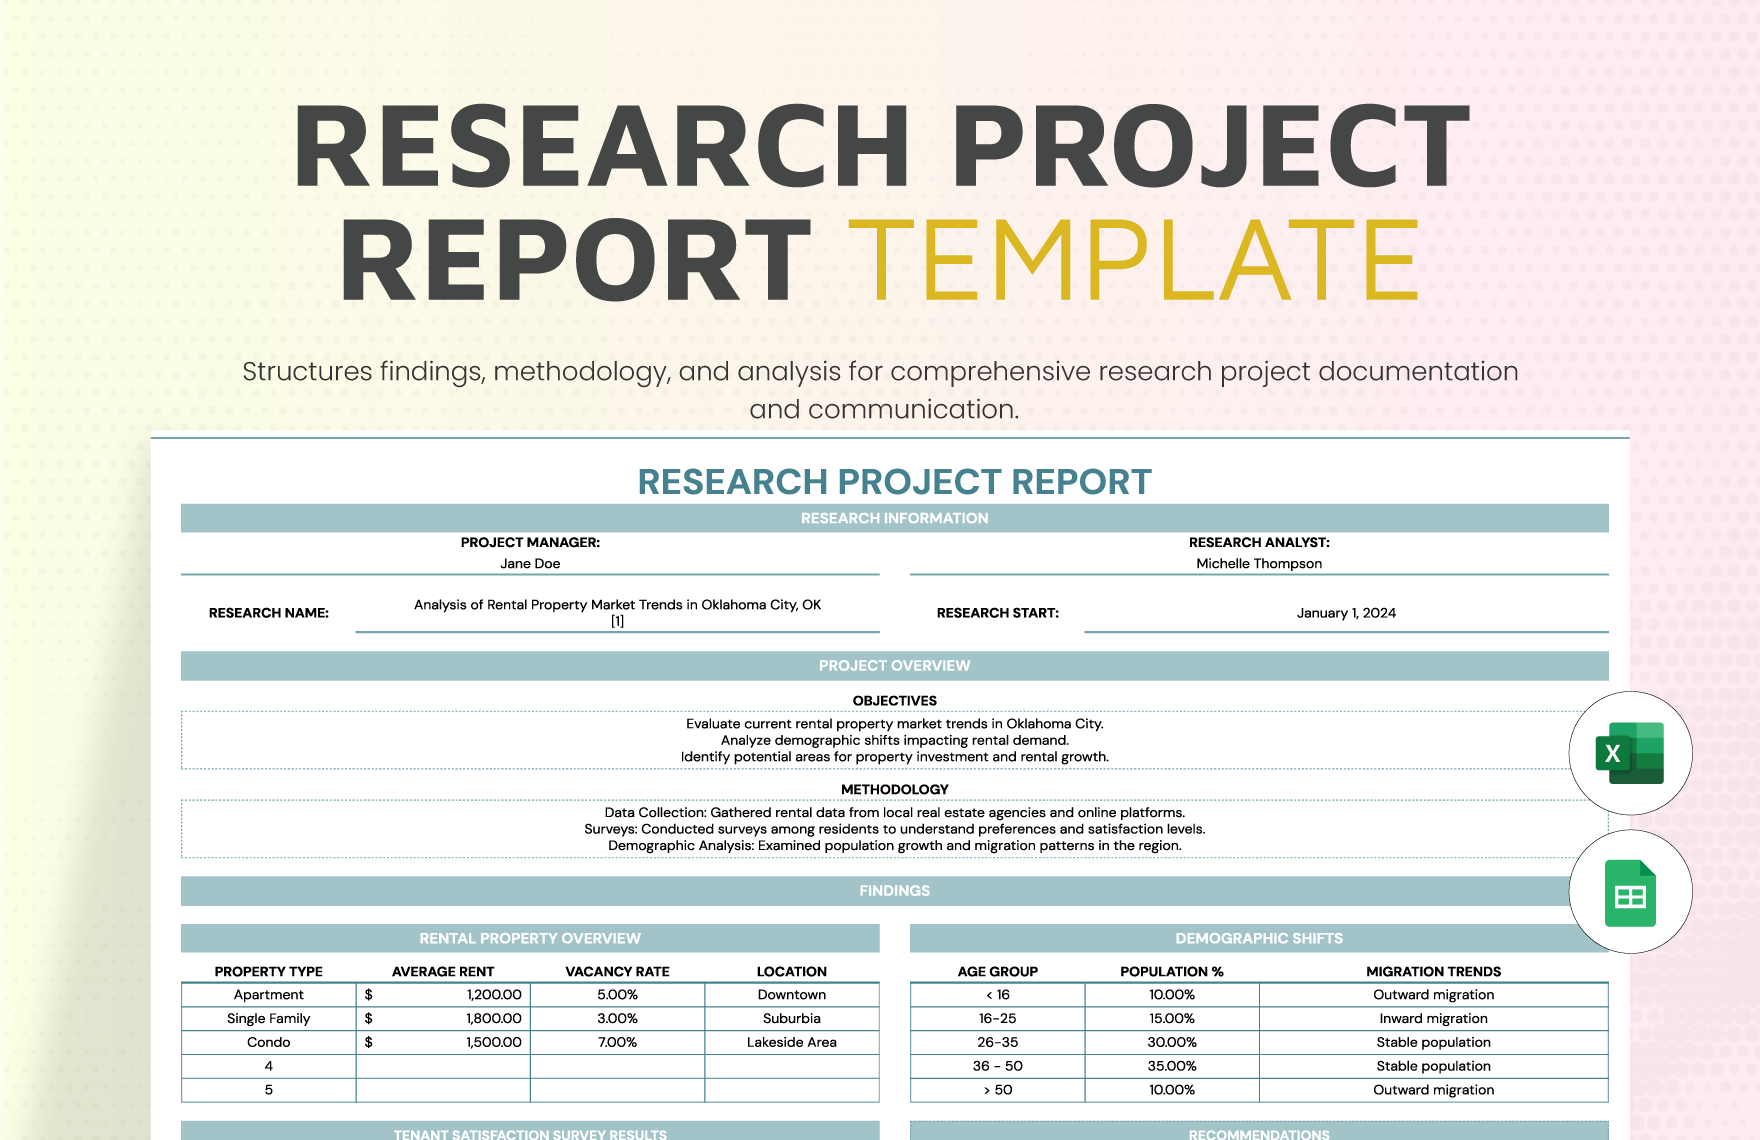
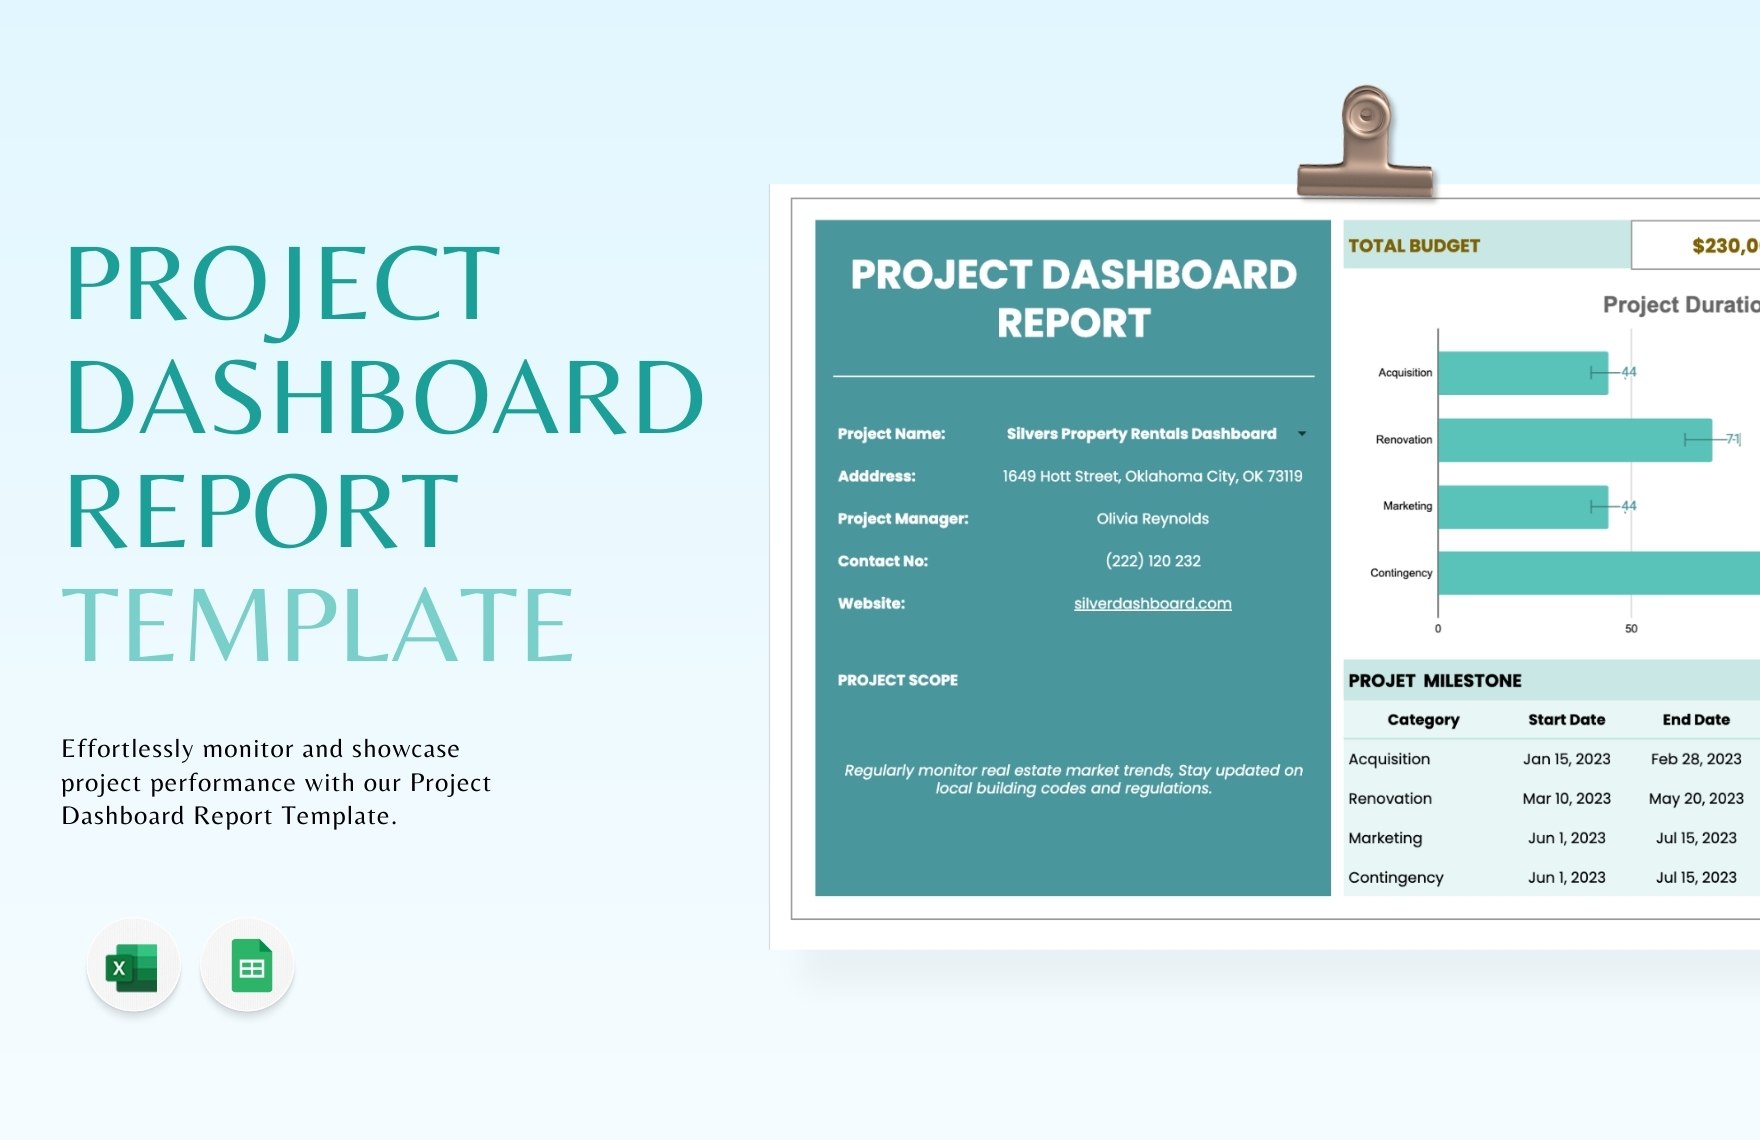
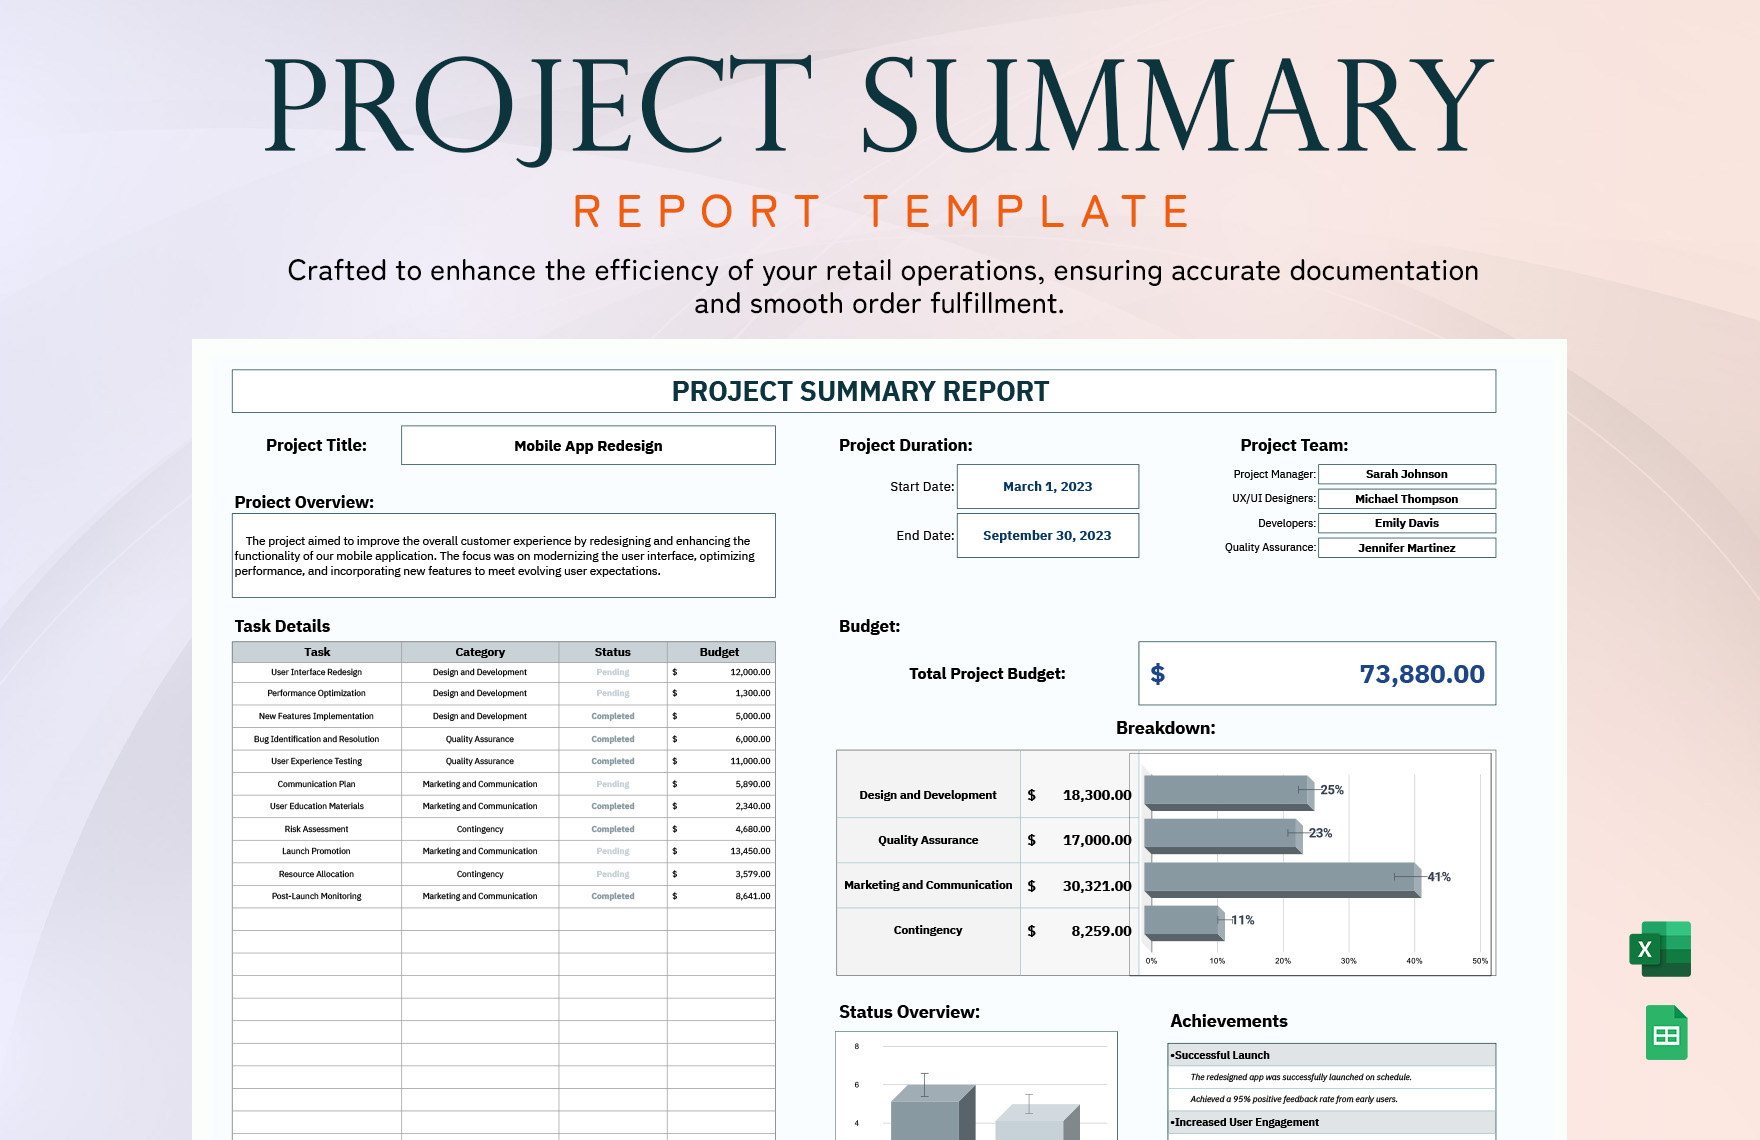
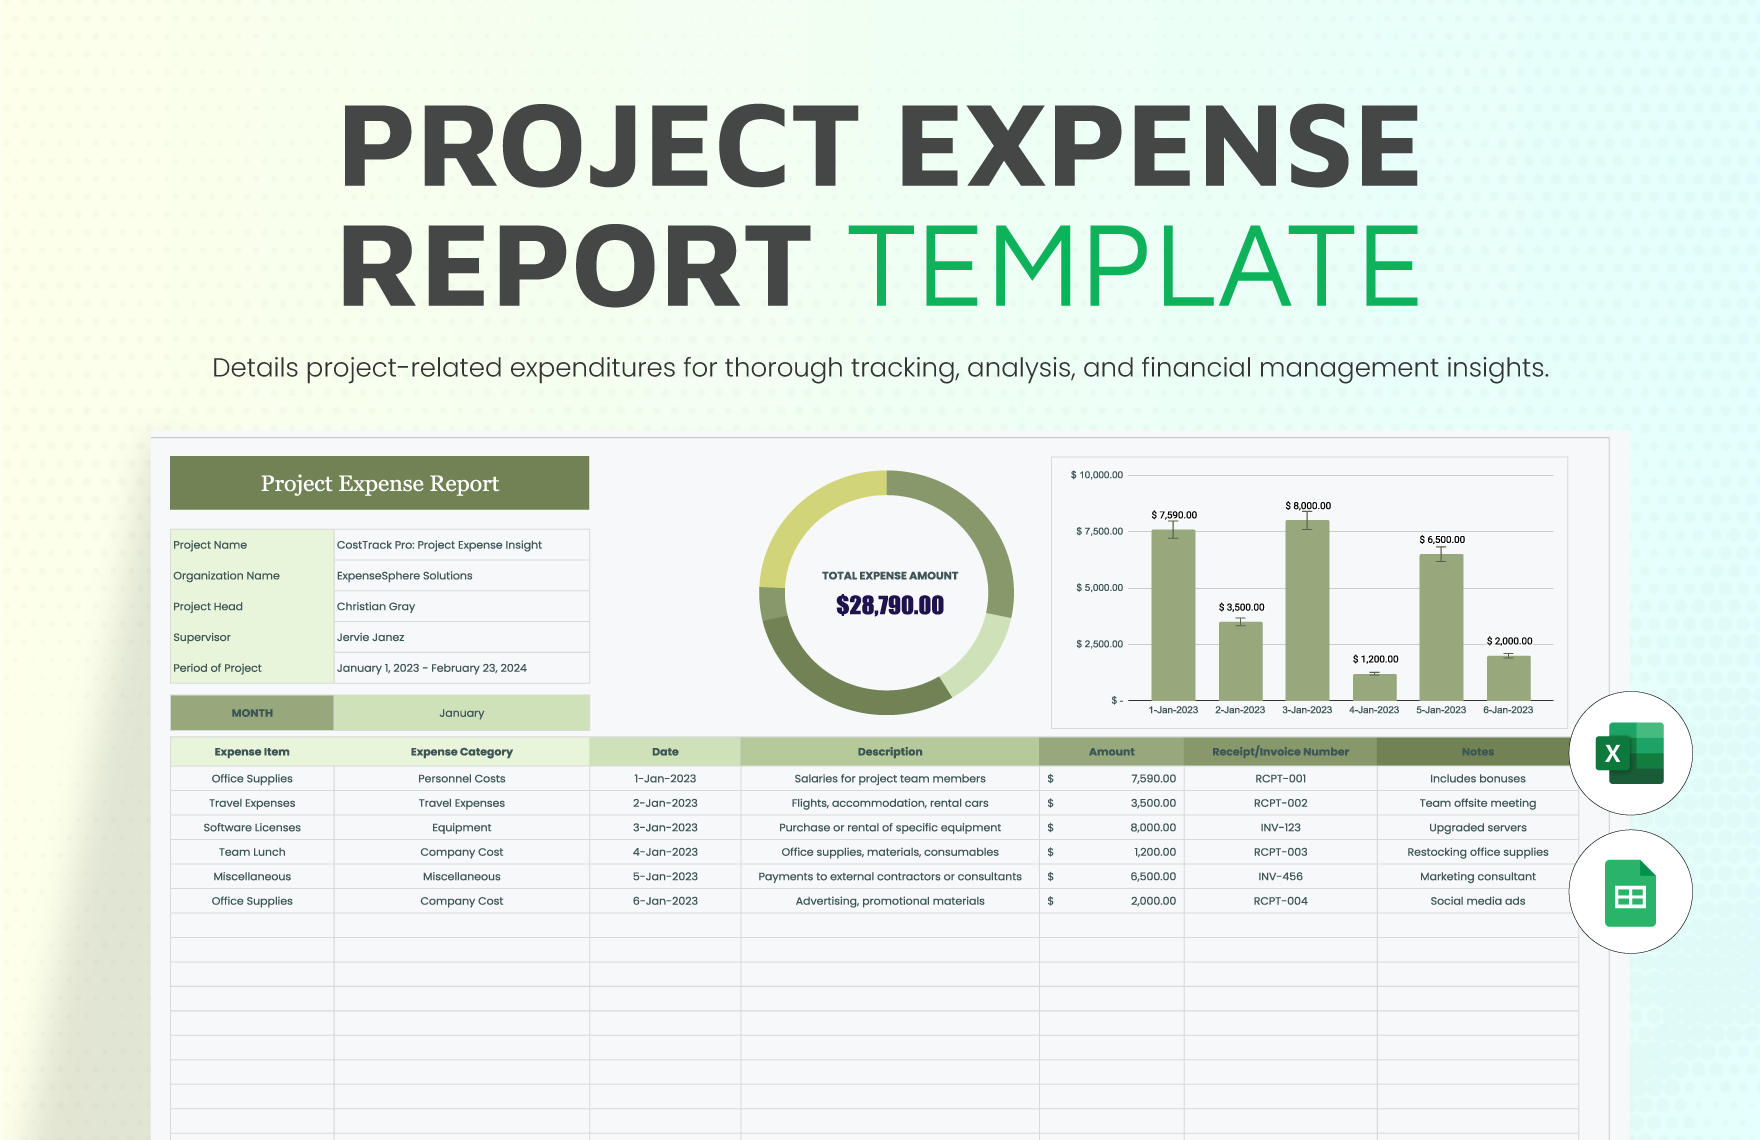
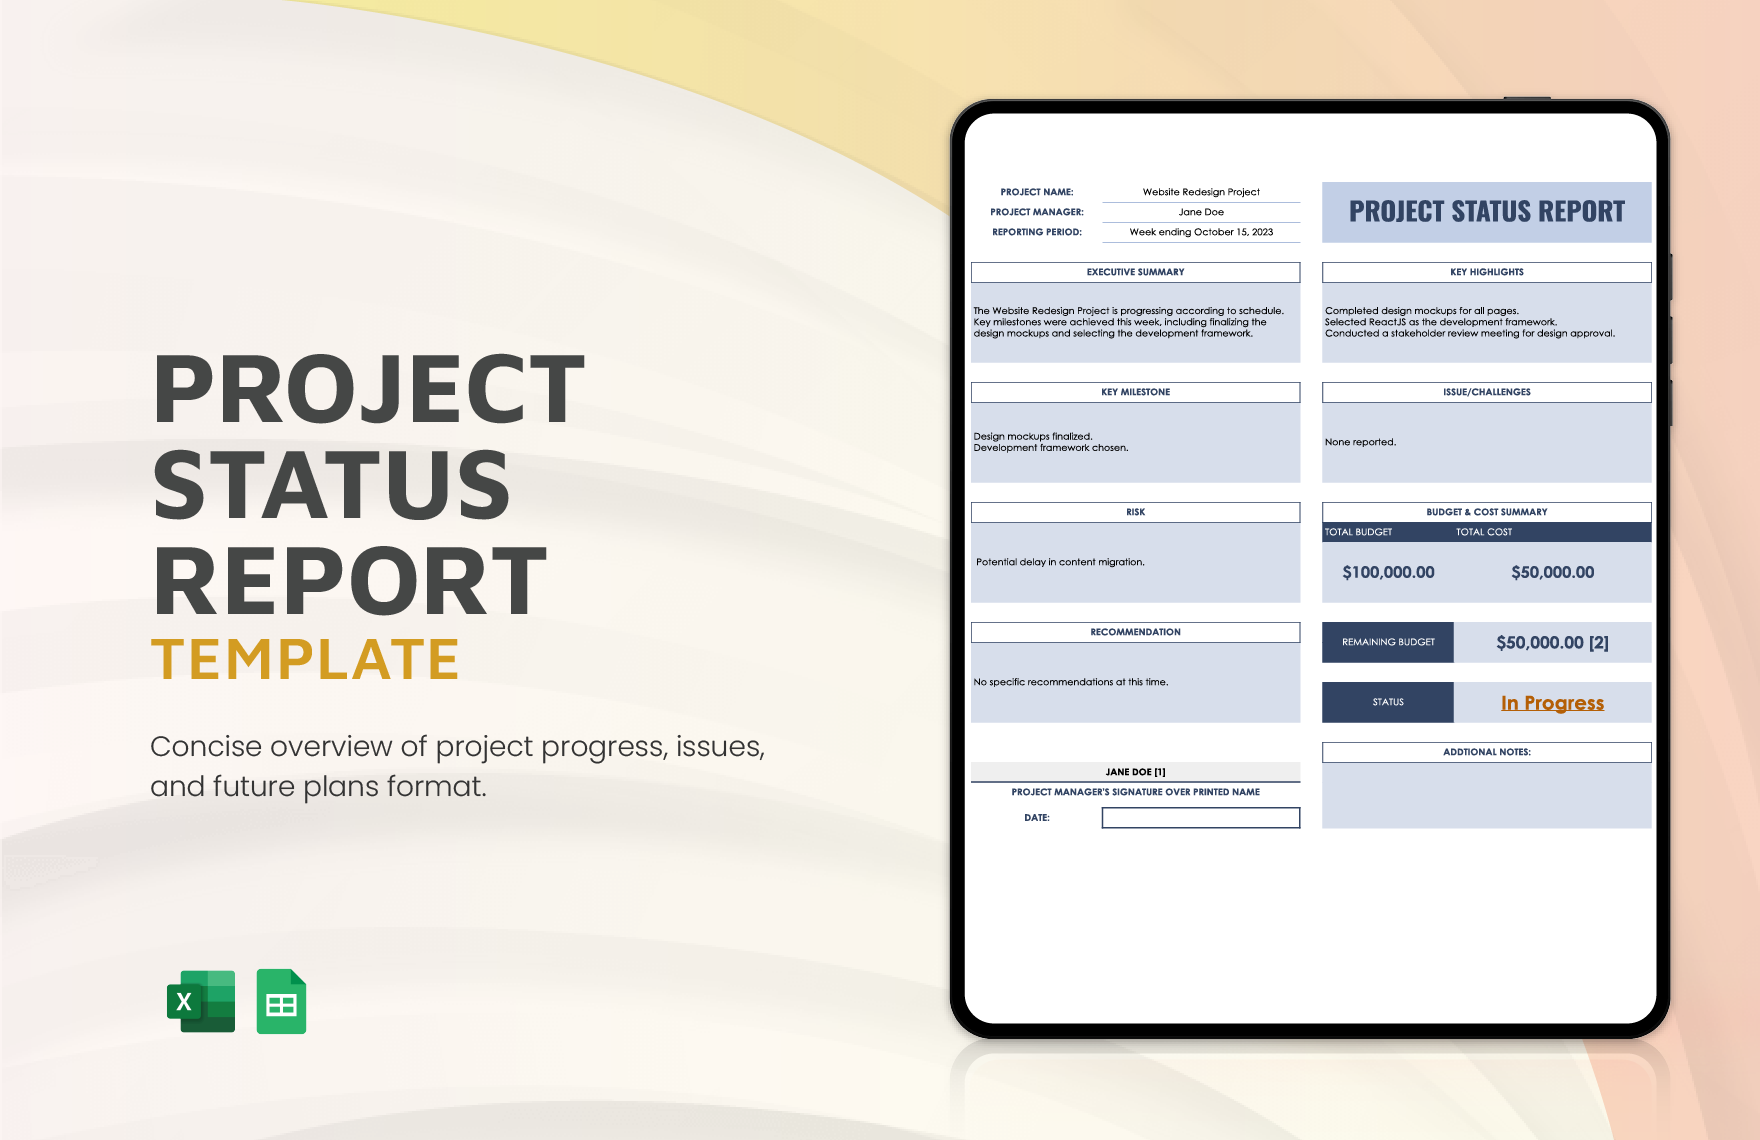
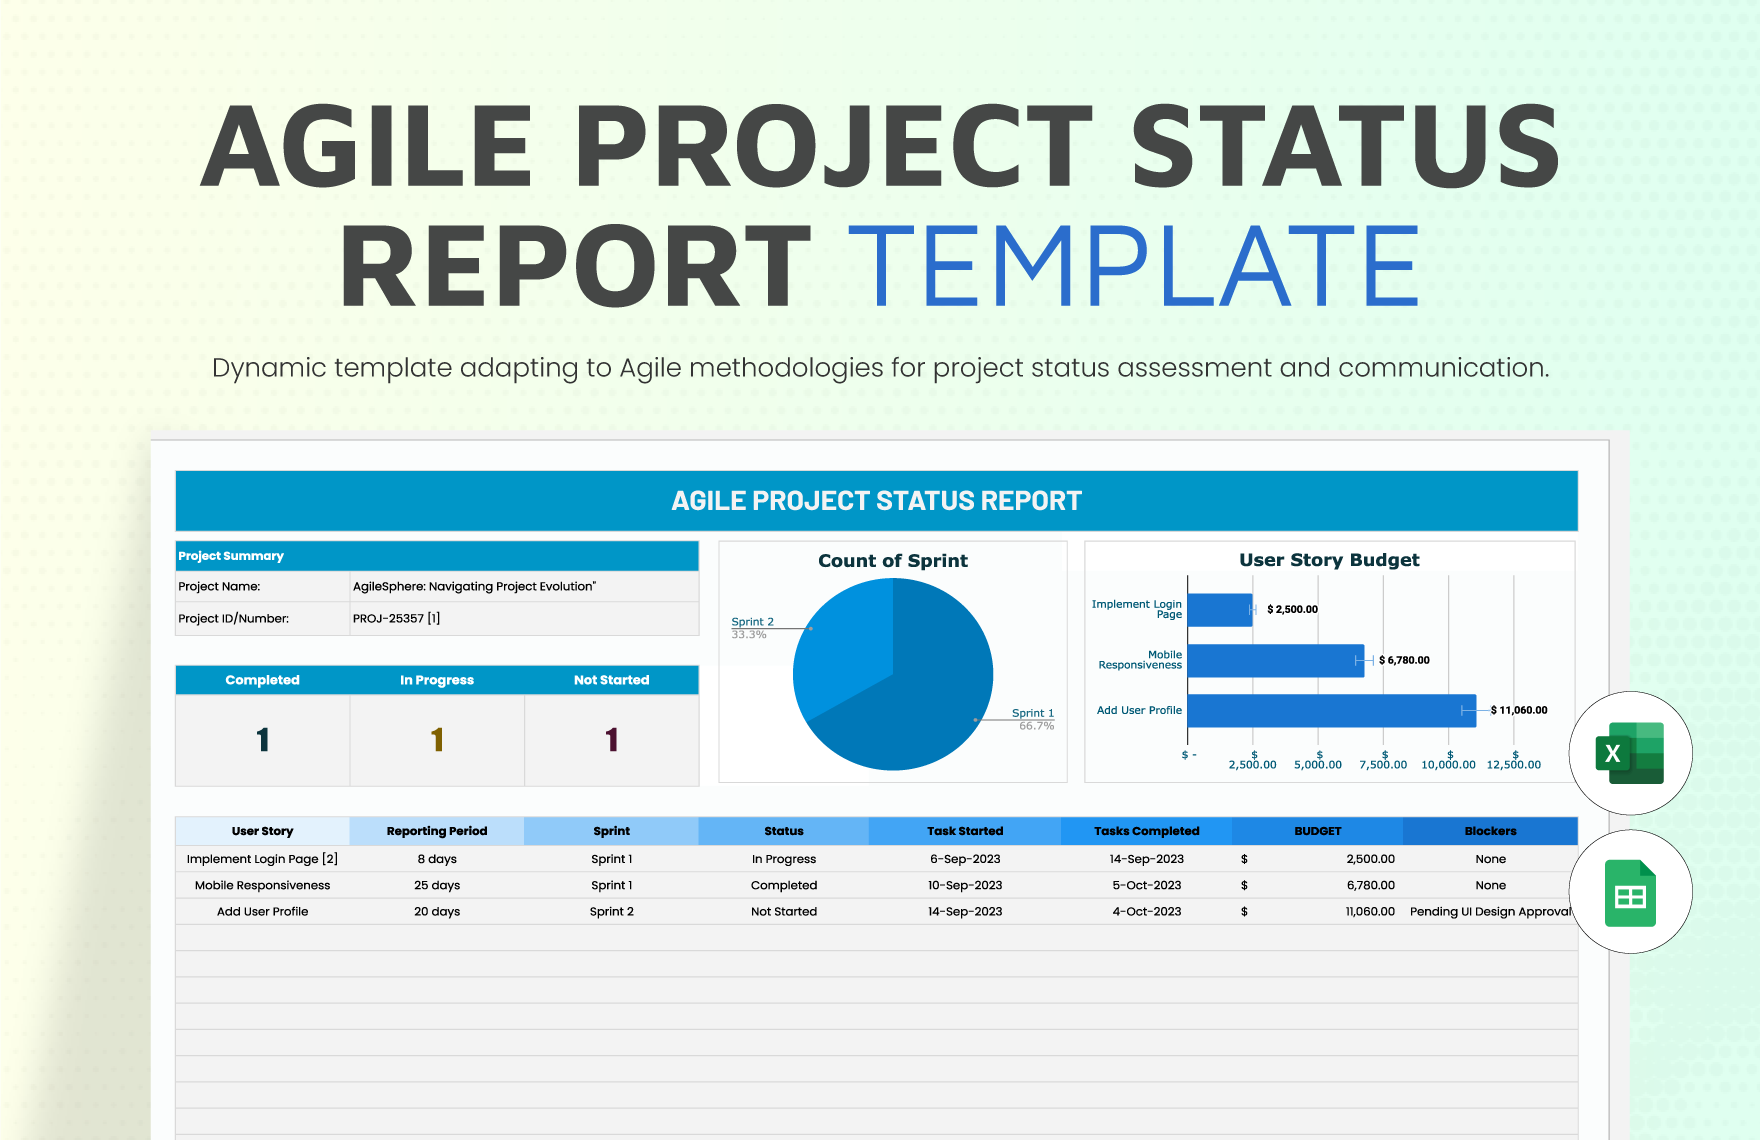
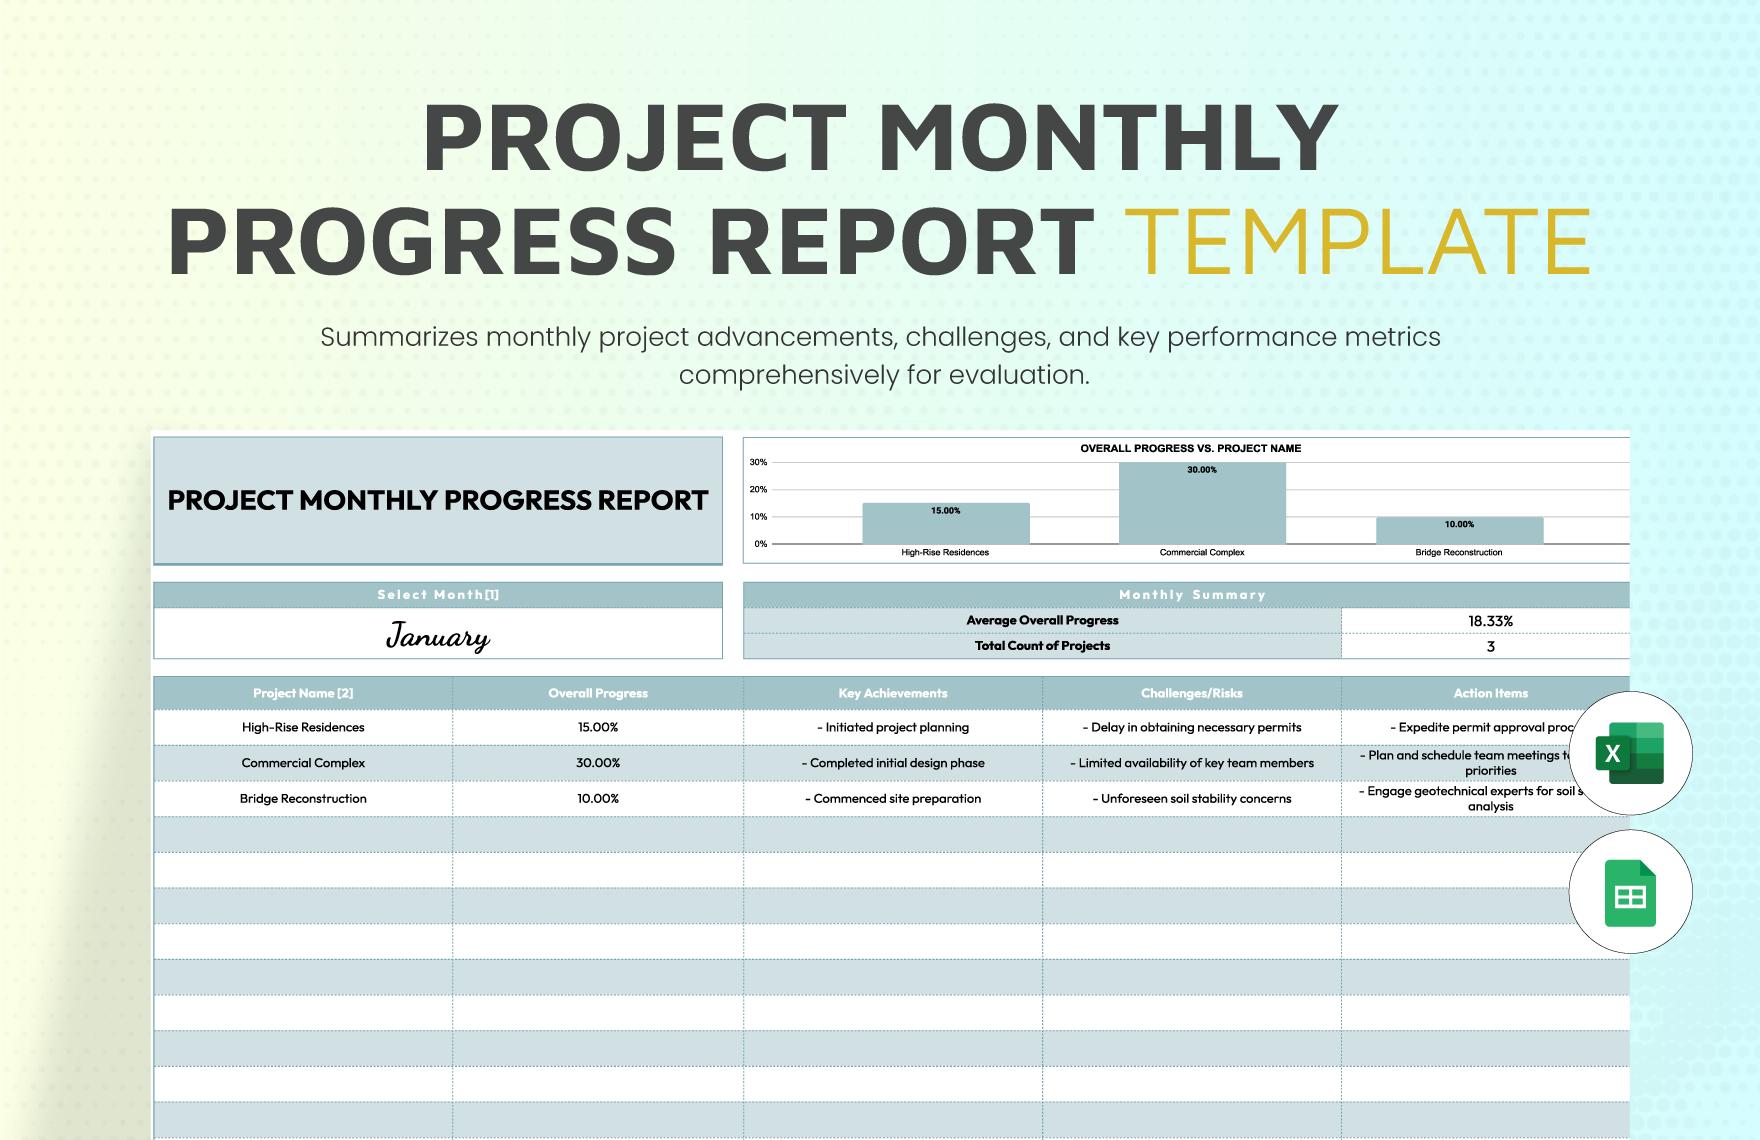
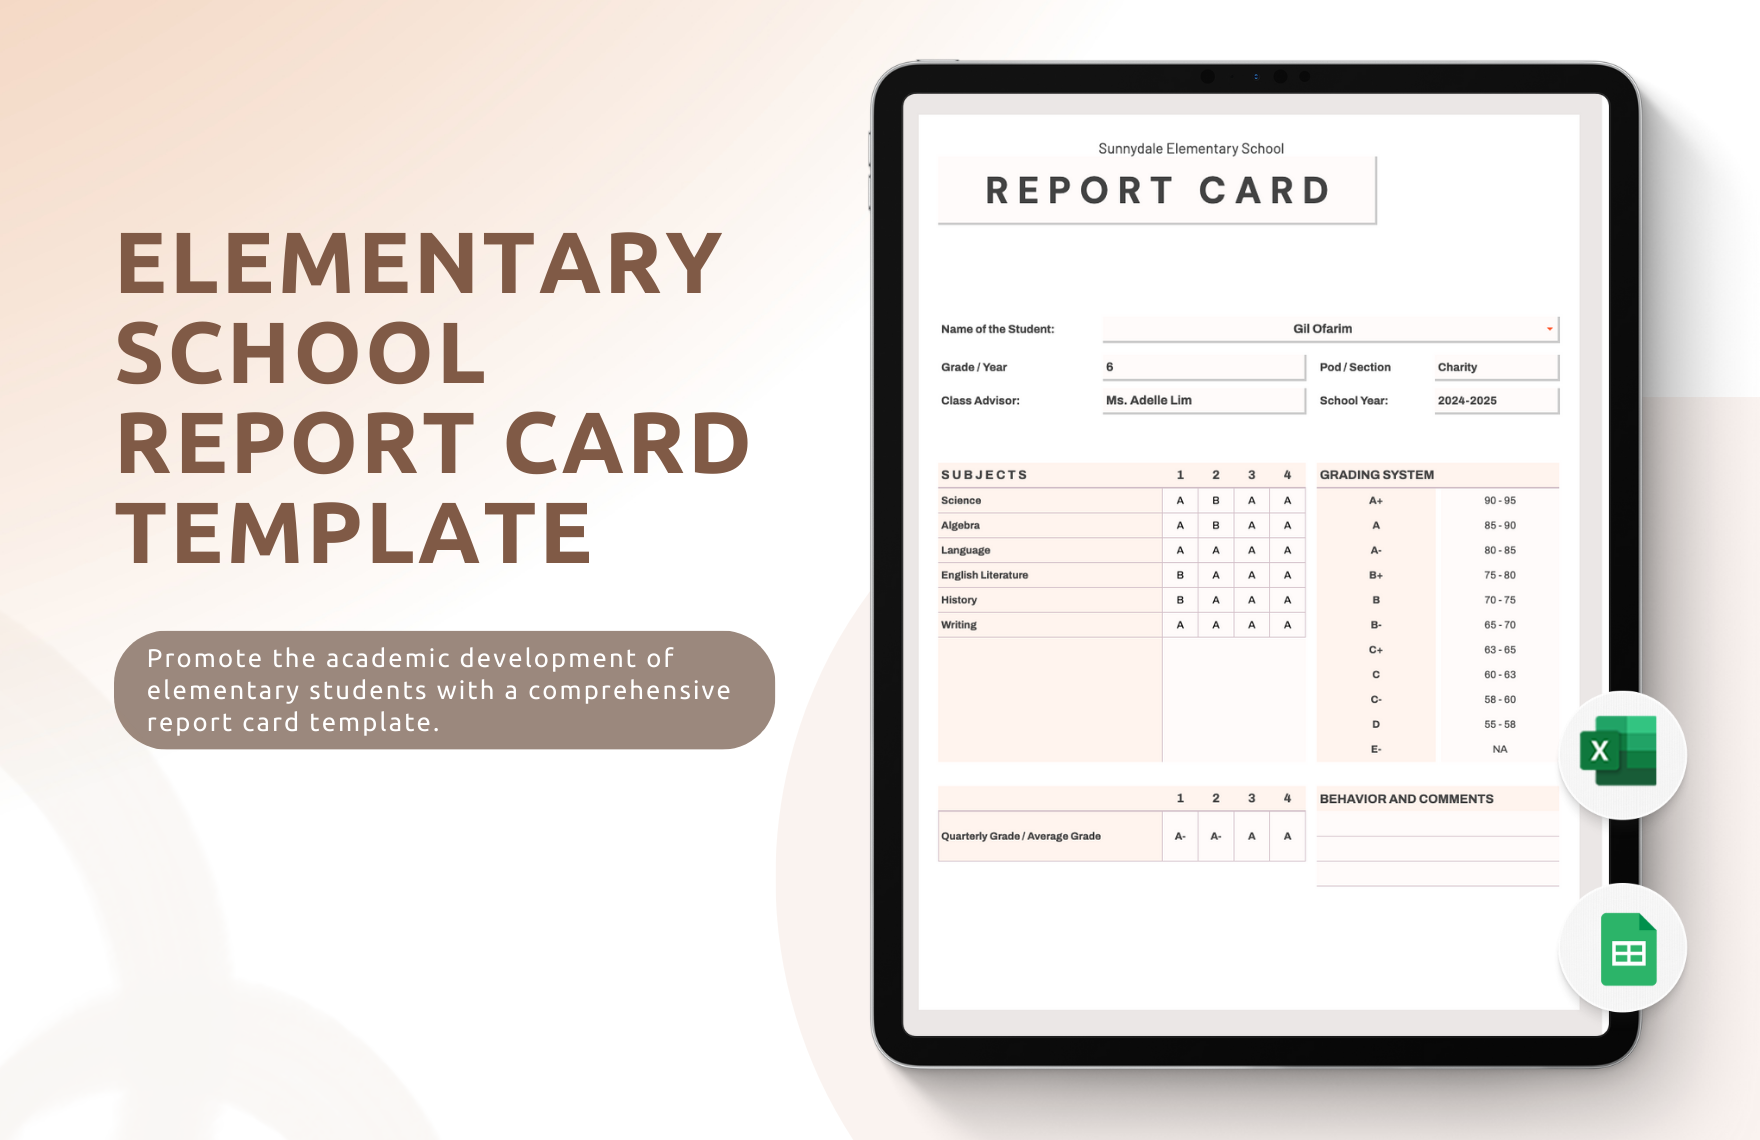
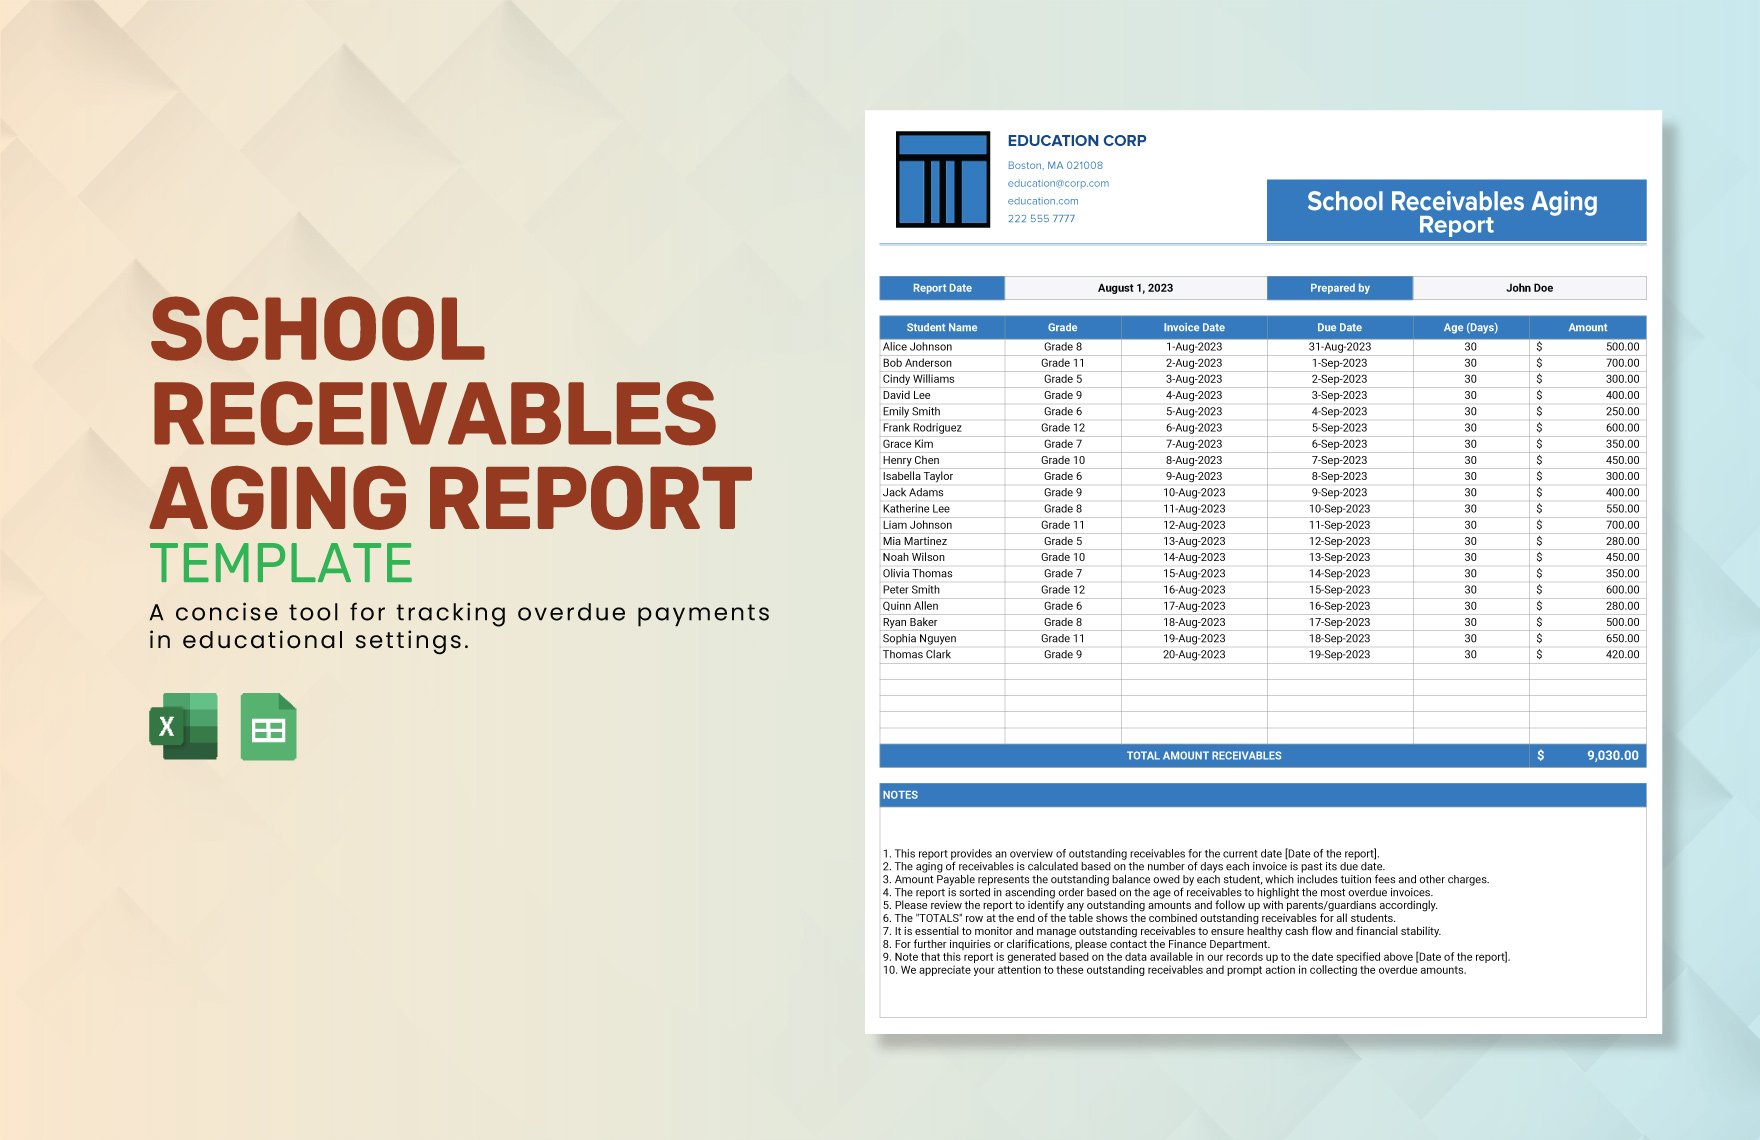
Businesses rely on sending and receiving information through reports. Almost all decisions done in the organizational level have corresponding reports. From an expense report, report card, project report, daily report, monthly report, sales report, weekly report, business and tax report, or management report, we have the files that can help you. We have a vast selection of printable and ready-made report templates that can help you in complying with your report needs. All the files are professionally made and are compatible with the online application, Google Sheets. Download now and create a well-formatted document that provides clear information organized in a narrative, graphic, or tabular form to a specific audience.
How to Create a Report in Google Sheets?
Reports are not only widely used in the academe. It also becomes a staple in the corporate setting. From monthly sales reports to budget and inventory reports, almost every action and decision done have corresponding reports with varying formats. Business reports, in particular, focus on giving solutions to problems within the organization. It contains measures on how to approach these problems and recommendations on how to improve the situation.
1. Know Your Audience
The information on the management report should be directed to a particular audience. Tailor-fit the language, format, and tone to the readers. To do so, you must orient yourself to the demographic. If they are managers, present it in a more formal, business-like, and rigid manner. If the audience are not familiar with the topic, make sure to serve the analysis in layman language. Also, make sure to explain entirely technical terms and jargon if there are any.
2. Present Background or Context
Reports need to convey information precisely and accurately. To do so, it should contain information explaining the entirety of the paper. In monthly reports, it is ideal to have a summary of the findings from the previous month to give a continuity of the data. As for academic reports by students, an overview starts the paper before diving into the specifics. The longer the gap of the reports, the longer the summary. The context somehow serves as a reminder of the decisions and ruling made during the previous meetings and presentations.
3. Provide Clear Objectives
Every project has underlying objectives. These objectives can also serve as the driving force of these projects and tasks. Present these goals to your audience clearly and concisely at the beginning of your annual report, proposal, or presentation. It is ideal to keep these objectives grounded and realistic by adding time restraints and measurable variables. These goals can also set the expectations of your listeners on how your presentation will go.
4. Present Data and Analysis
It is vital to present the analysis of the paper comprehensively and understandably. These serve as the body of the document. Citing the data is the most critical part of the report. The presentation should be clear to the target audience. To make it as thorough as possible, you can make use of tables, graphs, charts, and other diagrams. These visual representations show relationships of the variable in the report, on how one affects the other. Also, do not forget to use appropriate language and format.
5. Include Supplementary Documents if Needed
A report can be a summary of other forms and documents. It is best to include these supplementary documents to back up the data presented in the paper. You can also add a list of reference materials that is useful for the target audience. Do not limit yourself to these traditional reference materials. In reports for social media marketing, you can include the raw data for the engagement analytics as supporting data to the drawn conclusion in the business document.


