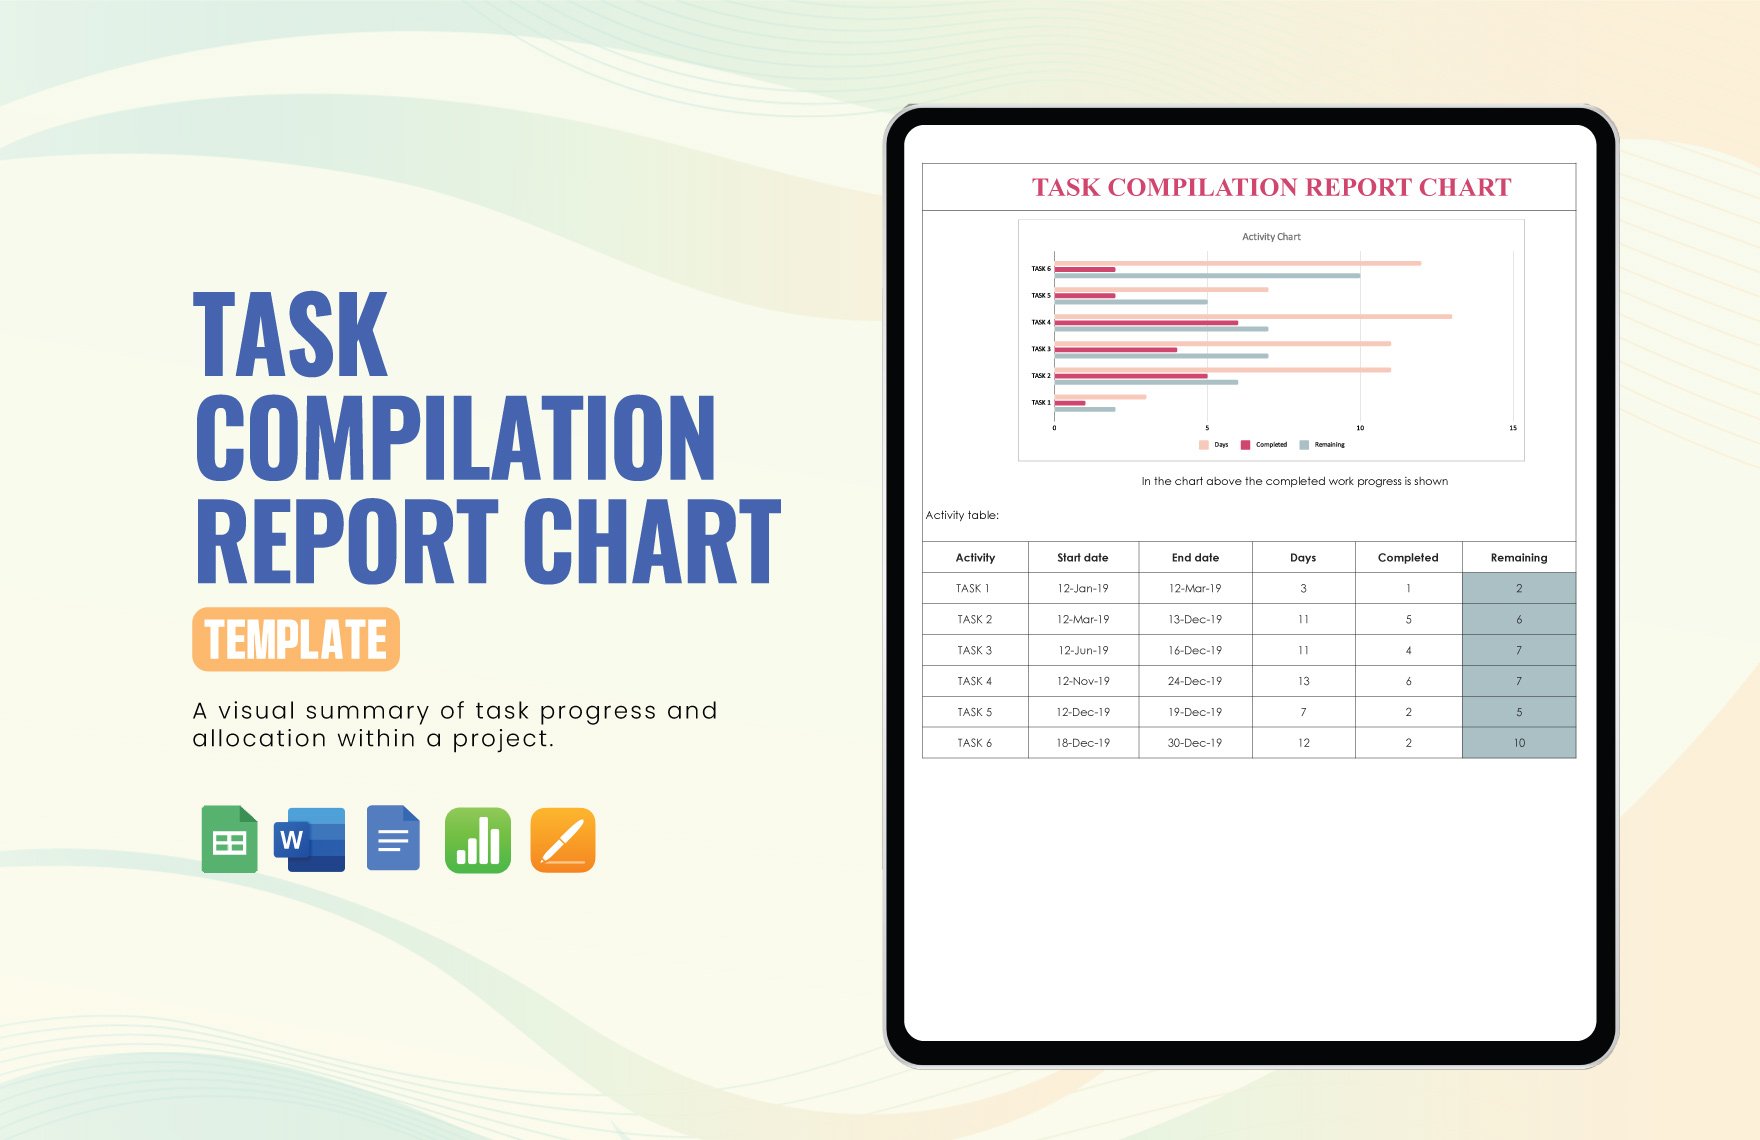
Get to choose from one of our premium templates to create a high-quality document report that provides records of sales data that is then analyzed to predict where your company’s success lies and determine where to improve based on the sales results. Our Sales Report Templates are ready-made and free to download in Apple Numbers format anytime, anywhere, at any Mac device. They are professionally-written with the users in mind, making use of original and suggestive content that can be modified to suit the user’s preferences. The templates can be used with all versions of Apple Numbers and also available in A4 and US paper sizes. Do not hesitate and download our Sales Report Templates now!
How To Create A Sales Report In Apple Numbers?
A sales report is a document crucial for any business to determine the marketing status of the sales. It is a summary of your daily, weekly, monthly, quarterly, or annual inventory of sales. The advantage of making a sales report is that you can determine if there are gaps or problems that you face in your sales. You can also make a sale analysis report for the compilation of the improvement of your business.
1. Focus On Your Audience
As a sales manager, before beginning your sales report, consider your target and what would they want to read in a sales report. It must mirror your target audience as they are the sole responsible for judging and evaluating it. For this reason, if you are in a customer service company and your marketing president would like to know the status of the social media marketing plan of your service, then you need to provide its statistics and standing. This personal perspective will guide you as to what data you will need in making one.
2. Nitpick Involved Information
You cannot produce a sturdy sales report without reliable information. After identifying the recipient of your sales report, you need to provide them accurate data that would give them an idea as to what is the current sales status. Usually, the data is composed of sales goals, the revenue vs. expenses, and the difference between daily sales reports. Then, add the products or services that are bestsellers, not meeting the expectations, sales forecasts for the next timeframe, and the critical area for opportunities and challenges. Some of this information may not apply to all of the sales reports, especially if you are reporting for a single department but having a comprehensive sales report is better. It may seem to be laborious but it will be for the common good.
3. Format Your Report
After the audience and essential information you need to attach, you can now format your report. You need to determine whether you will make a daily, weekly, or monthly report and include it to the title together. Equally important is the audience's name, such as the department or individual name. You also need to add the timeframe of the report. Afterward, you need to divide your body into digestible contents. Sort your data into its specifications and group them accordingly. All in all, you can write the overall summary of the report for the sake of the convenience of your audience.
4. Choose The Right Visual Interpretations
There are circumstances wherein words cannot sufficiently convey the message you wanted. With so, you can add infographics such as bar graphs for the gross of your sales or pie charts for how the product contributes to the overall percentage of sales. It will not only help to the visual impact of your report but instead making the information engaging and understandable.
