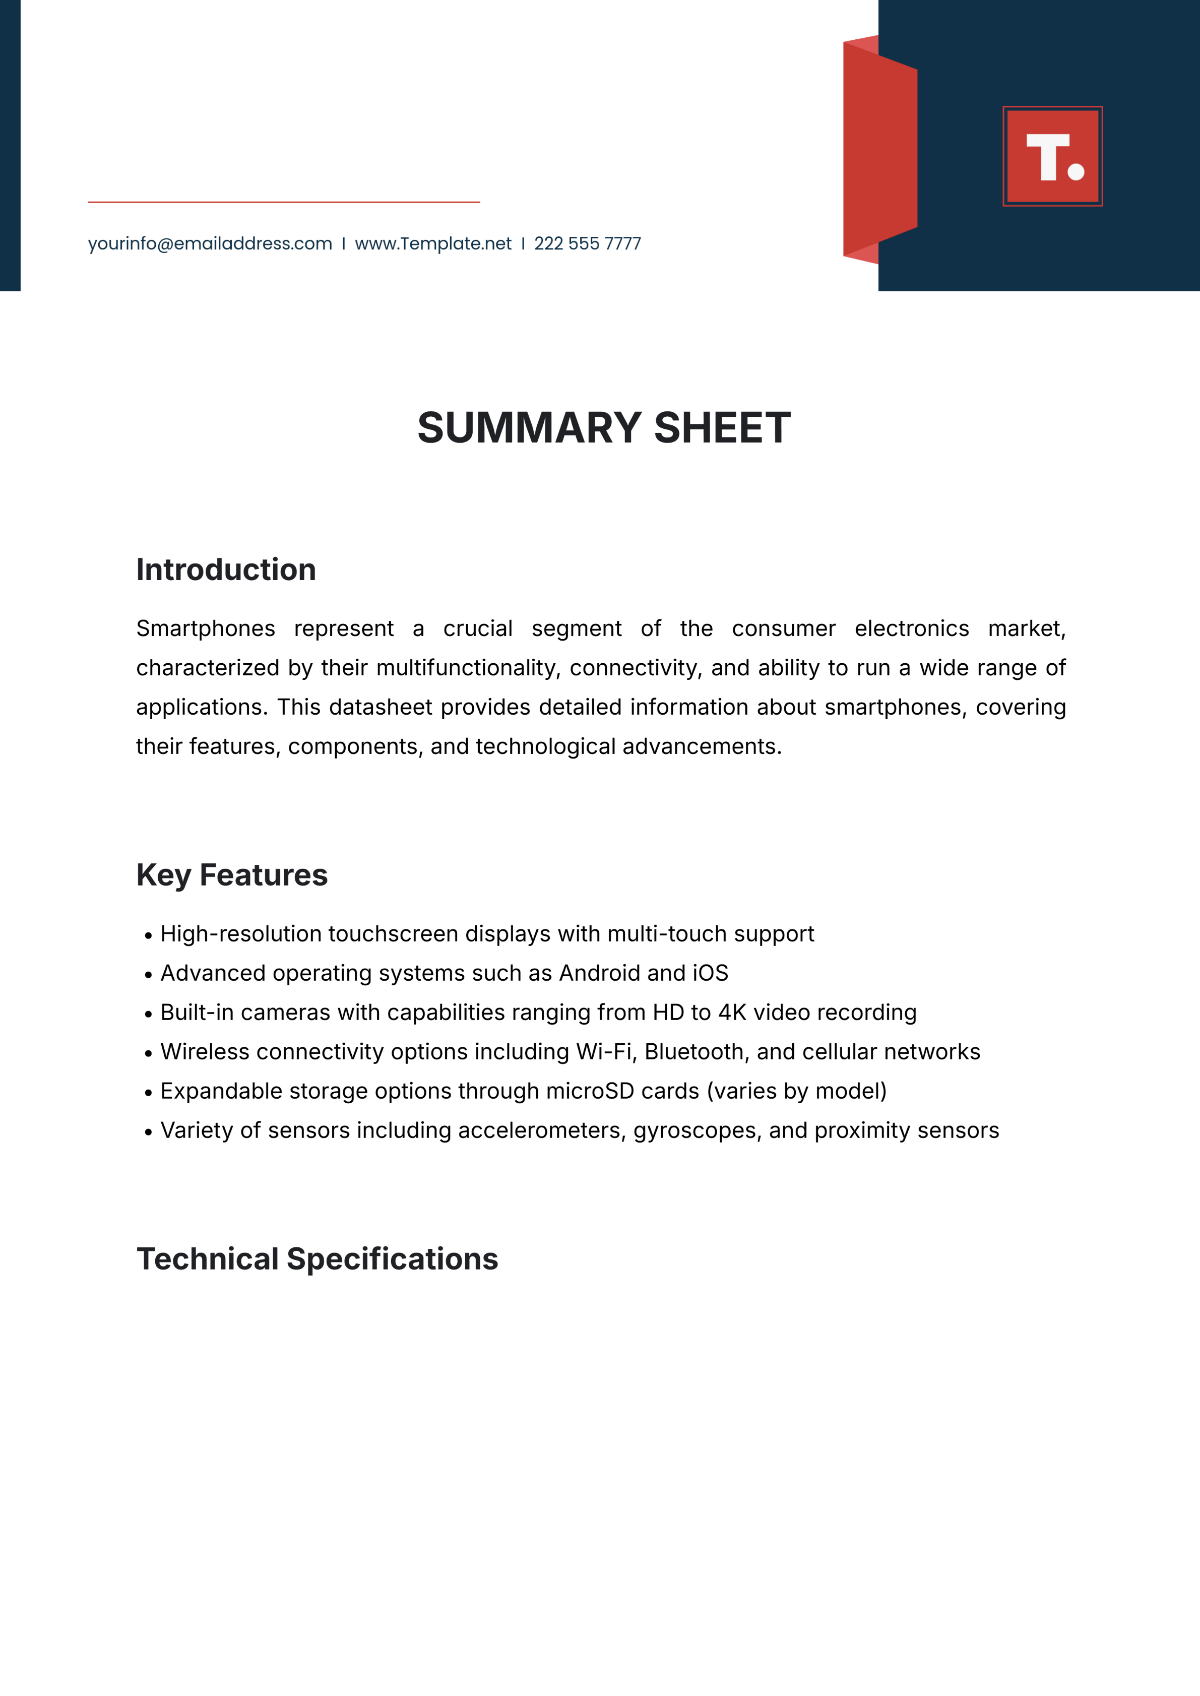
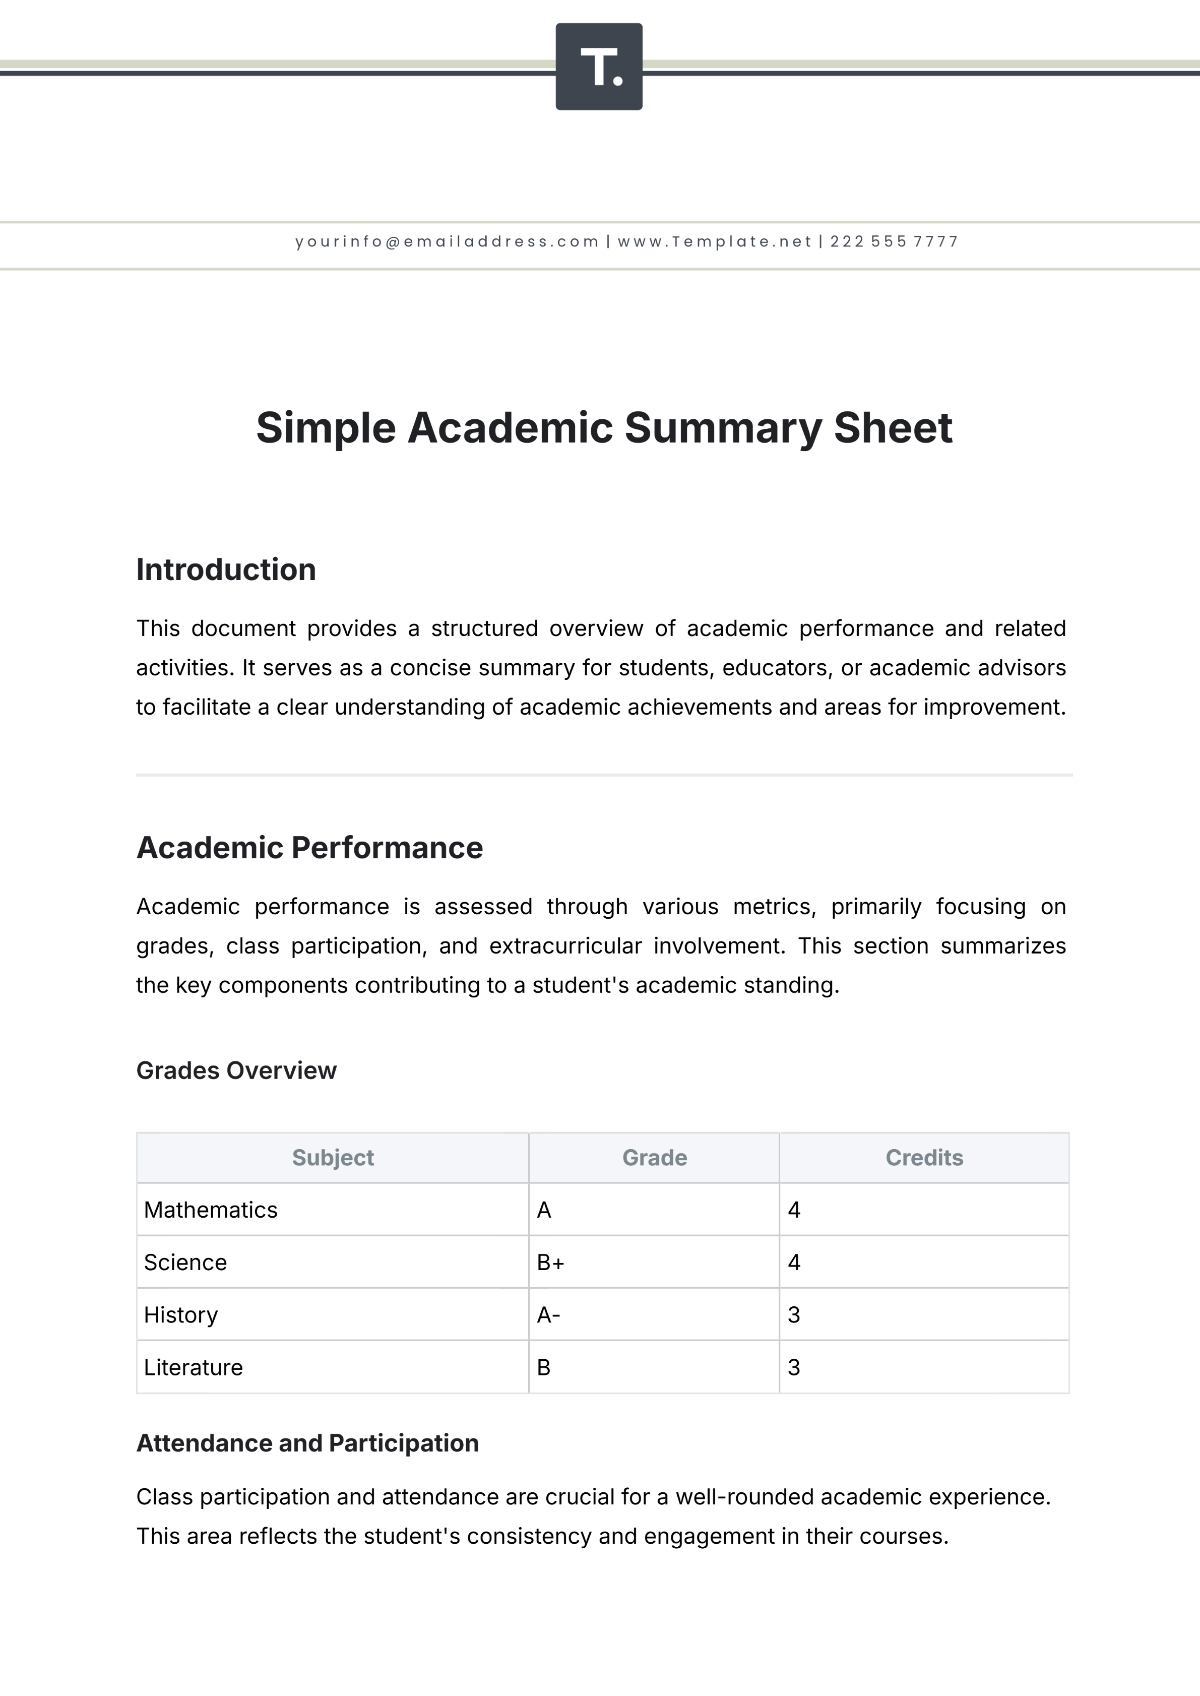
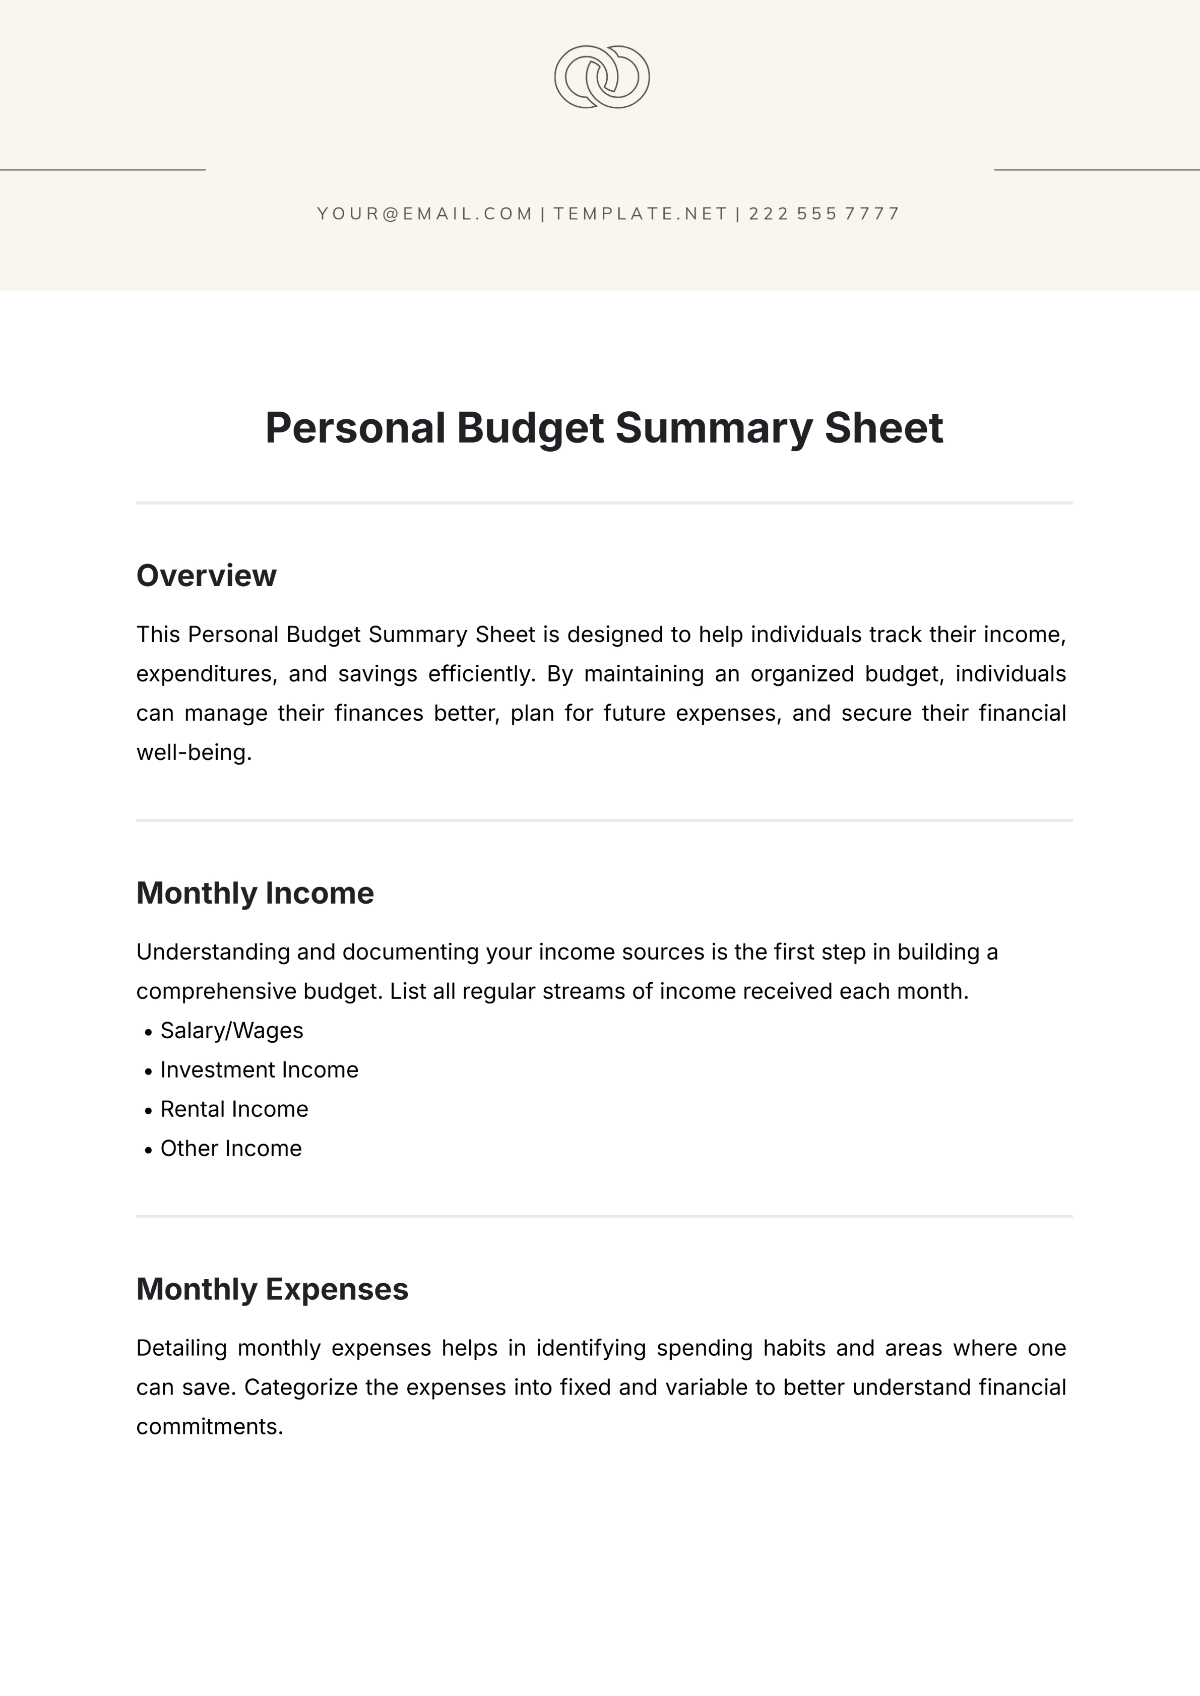
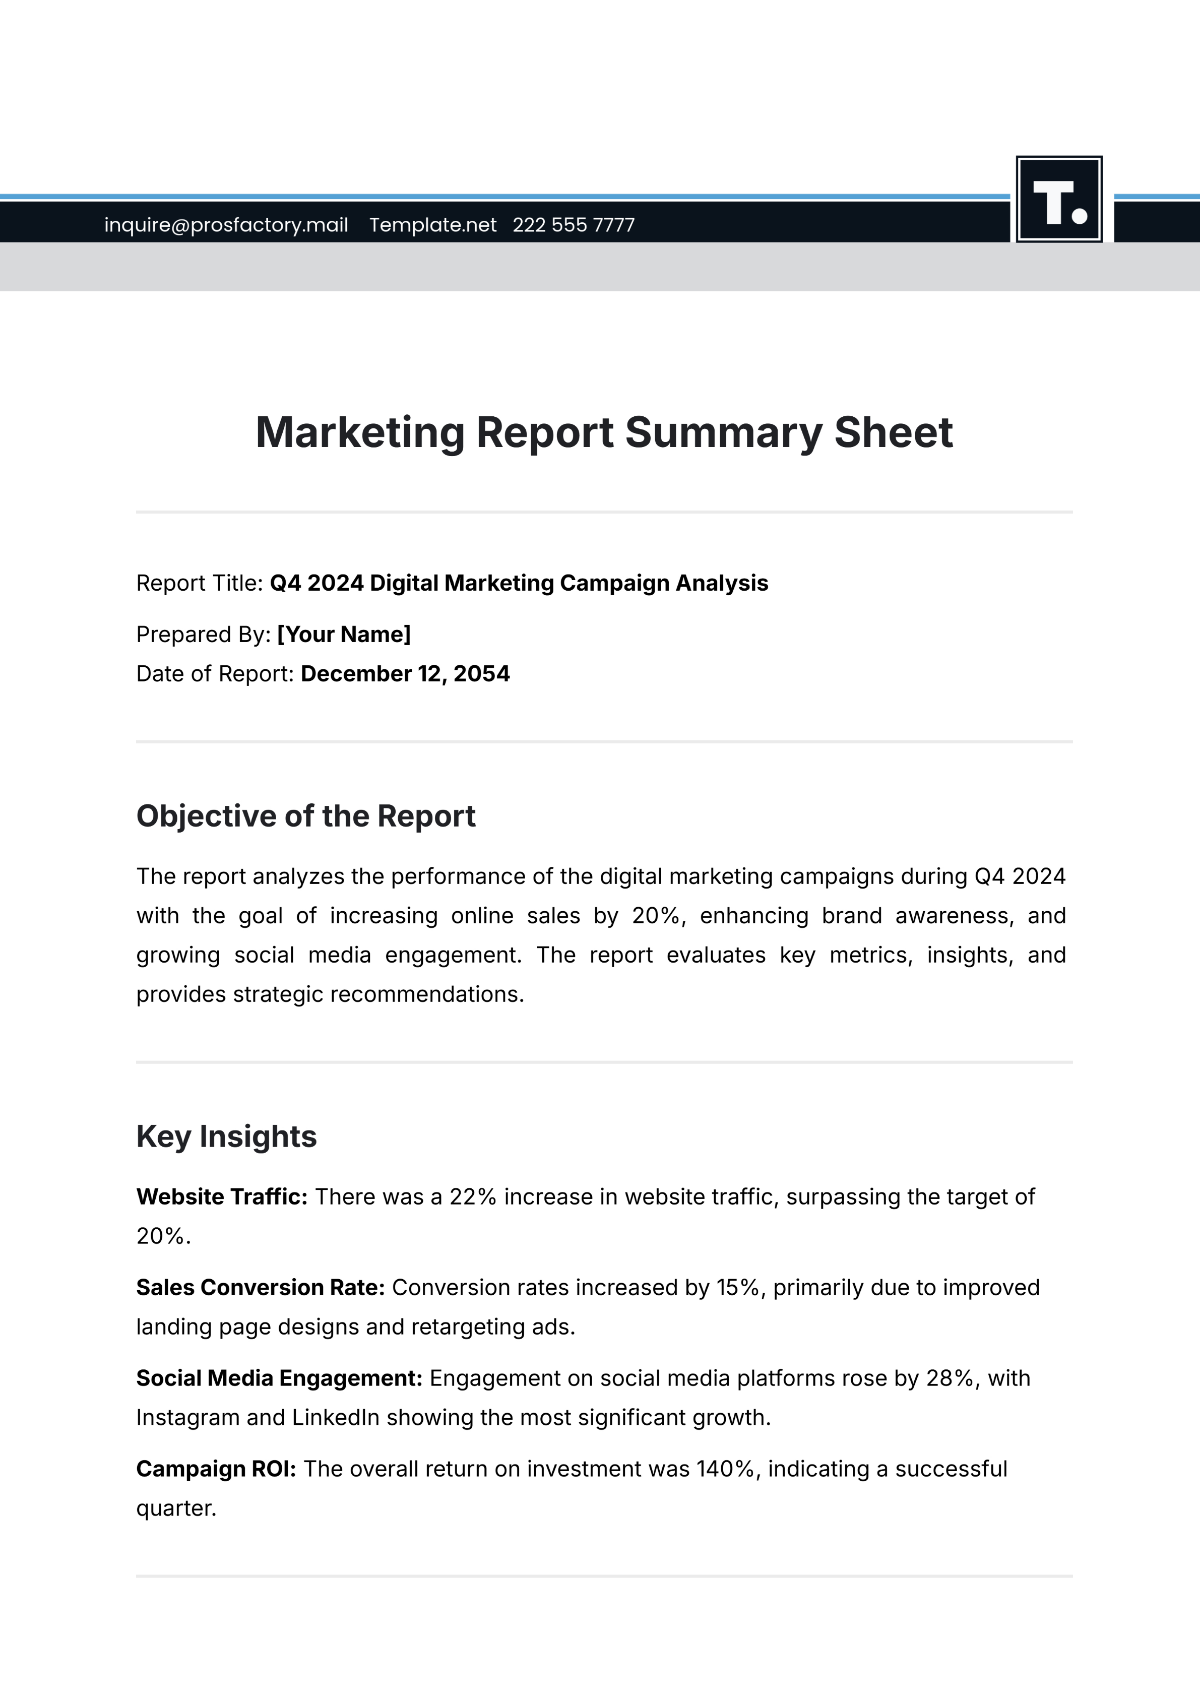
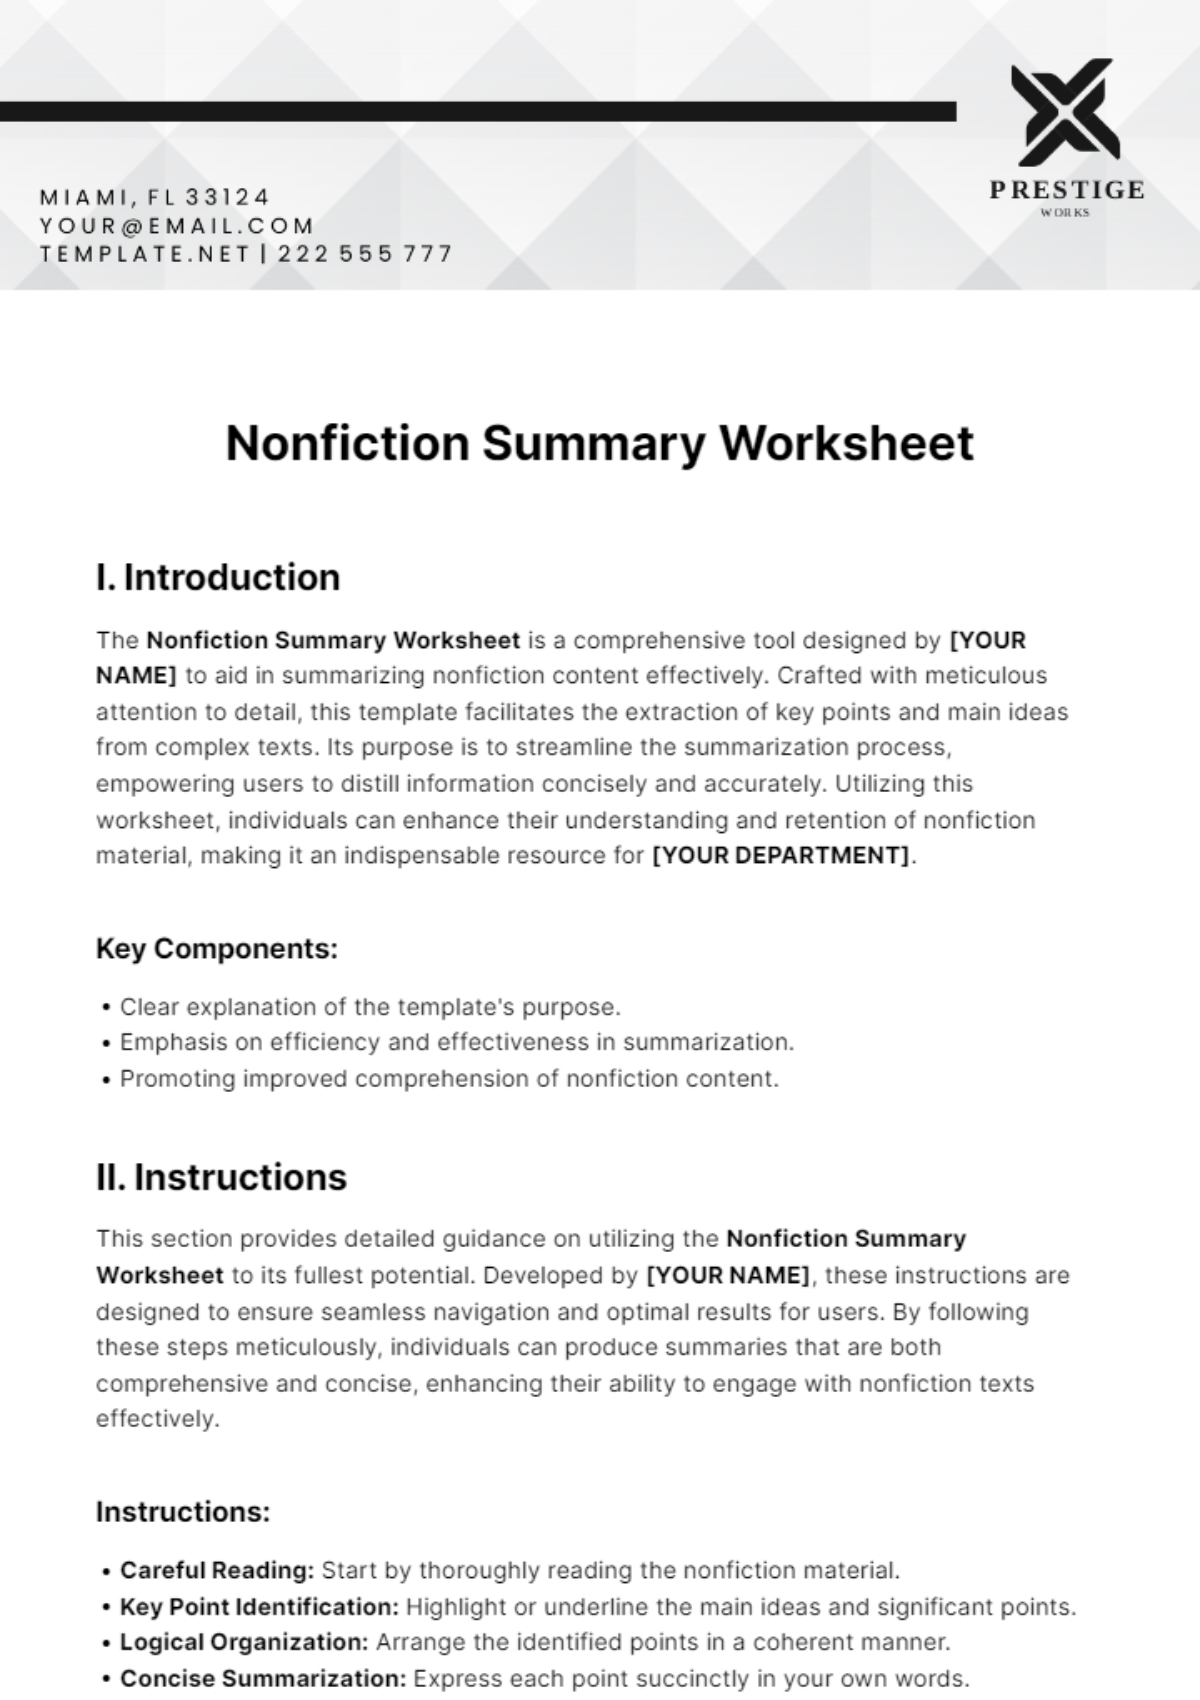
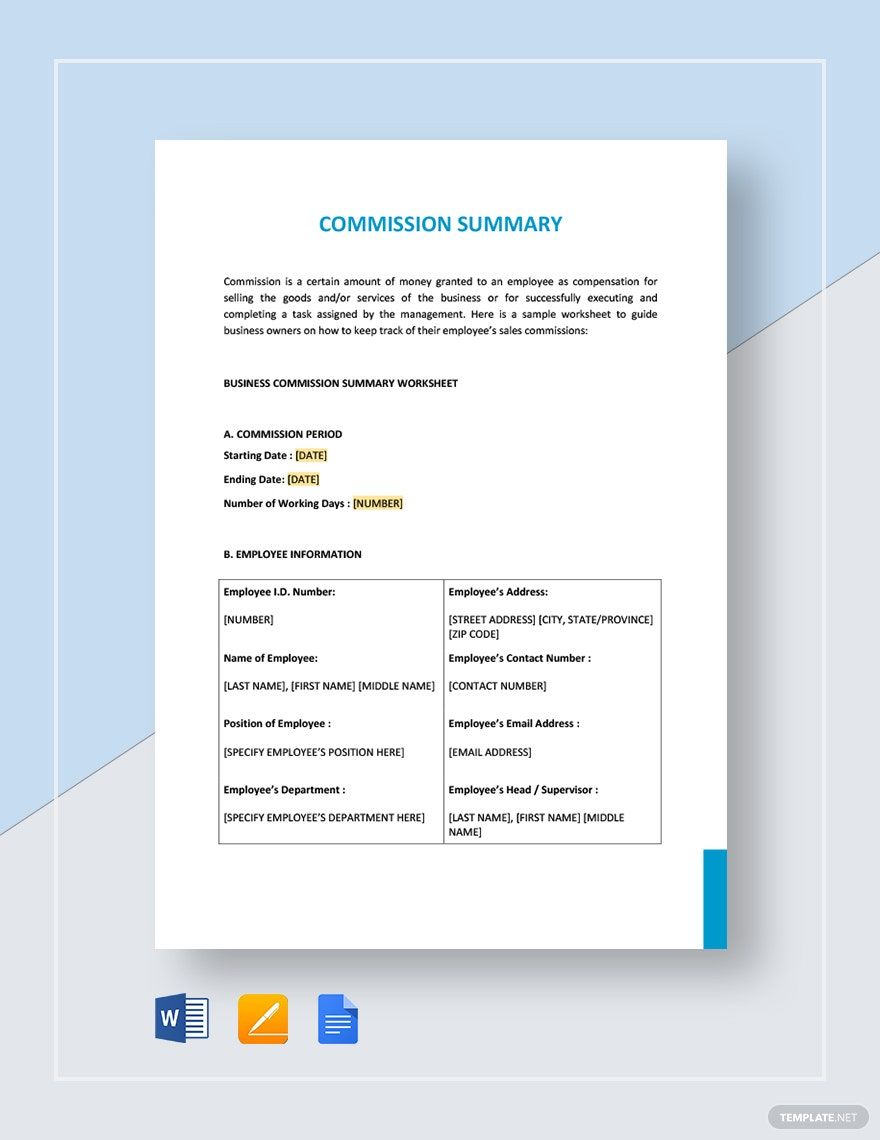
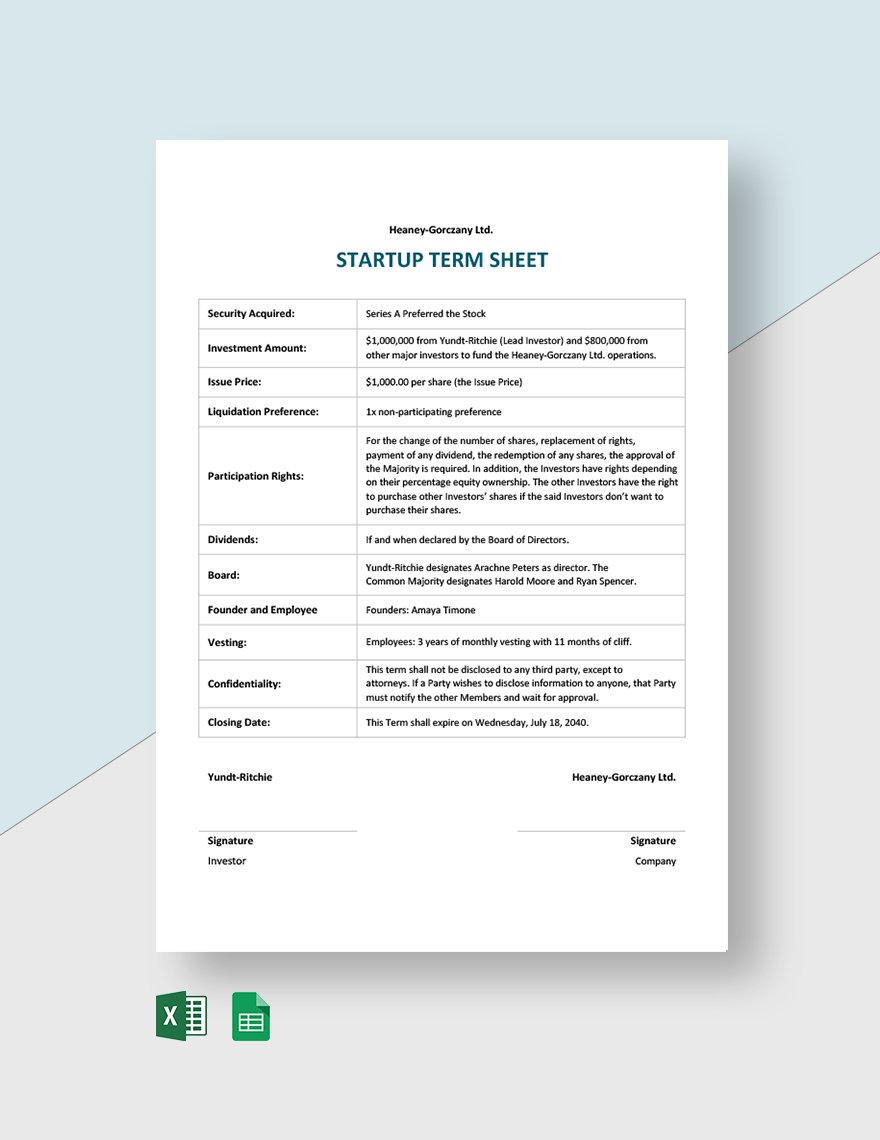
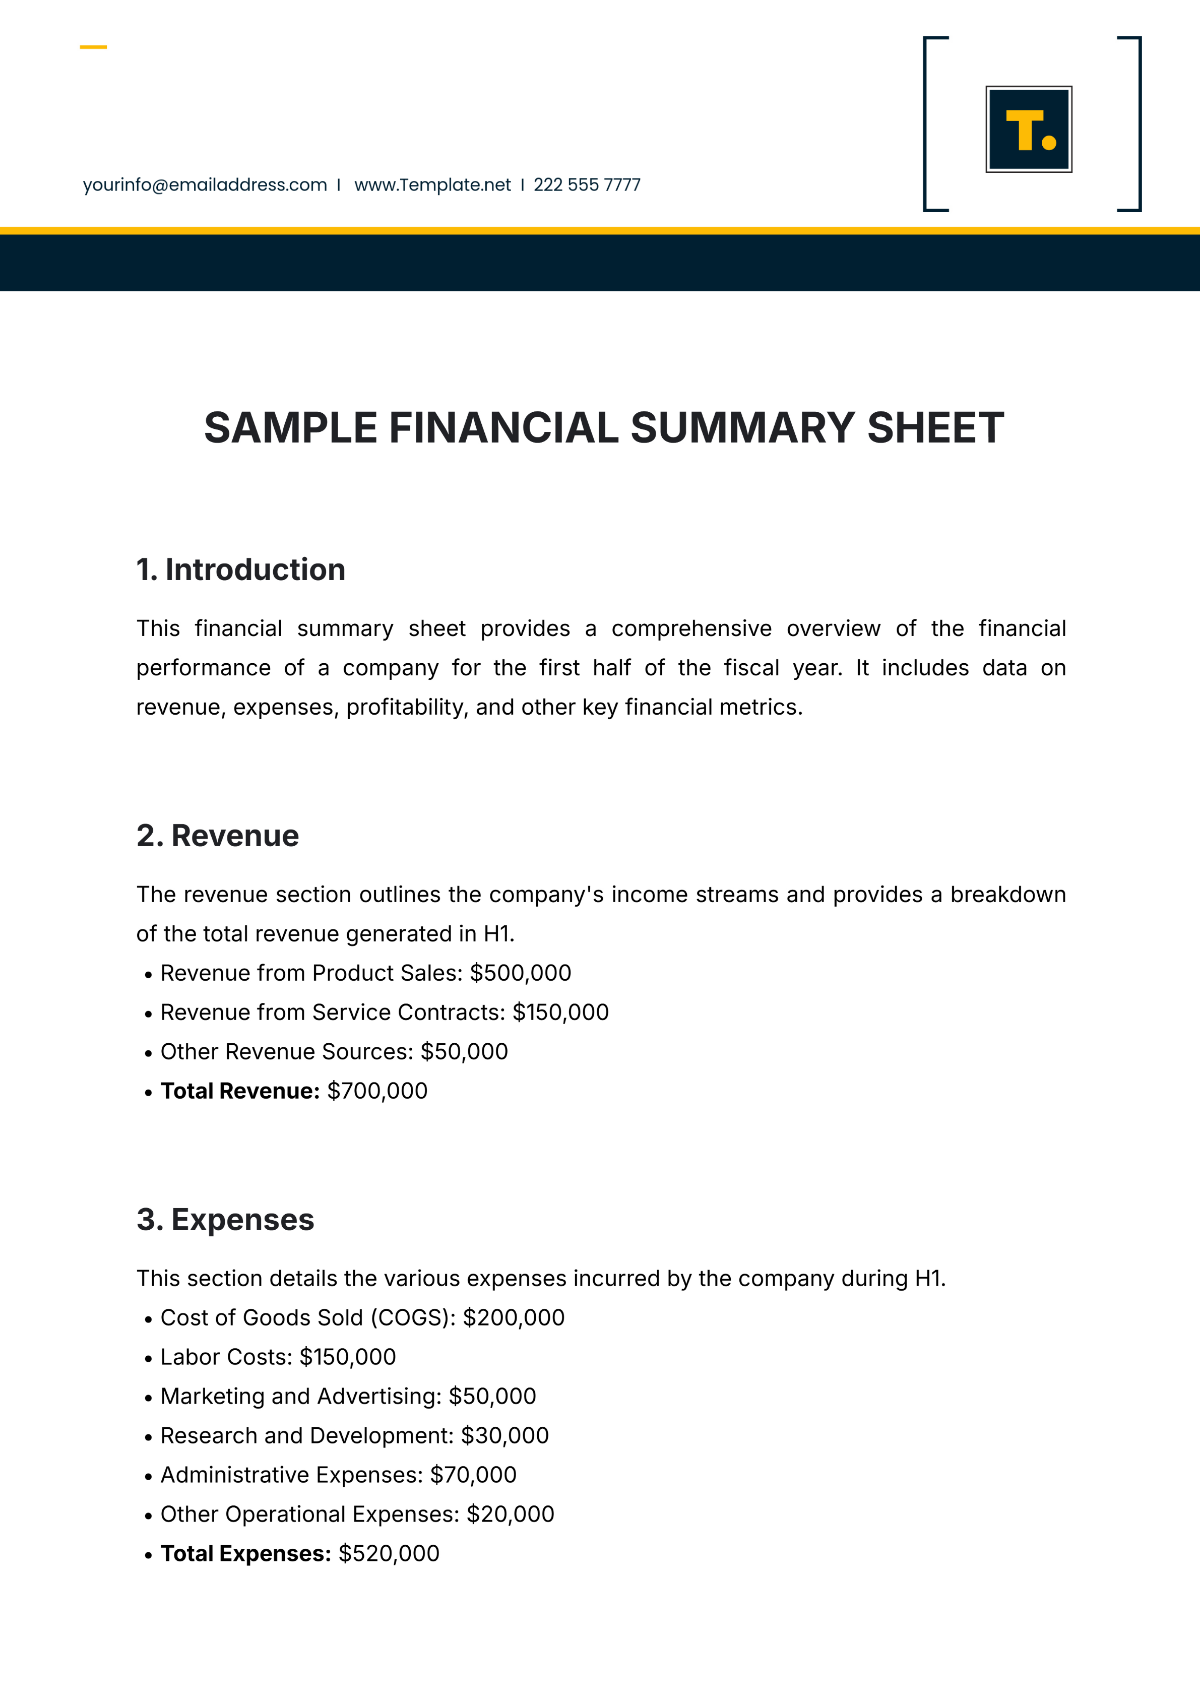
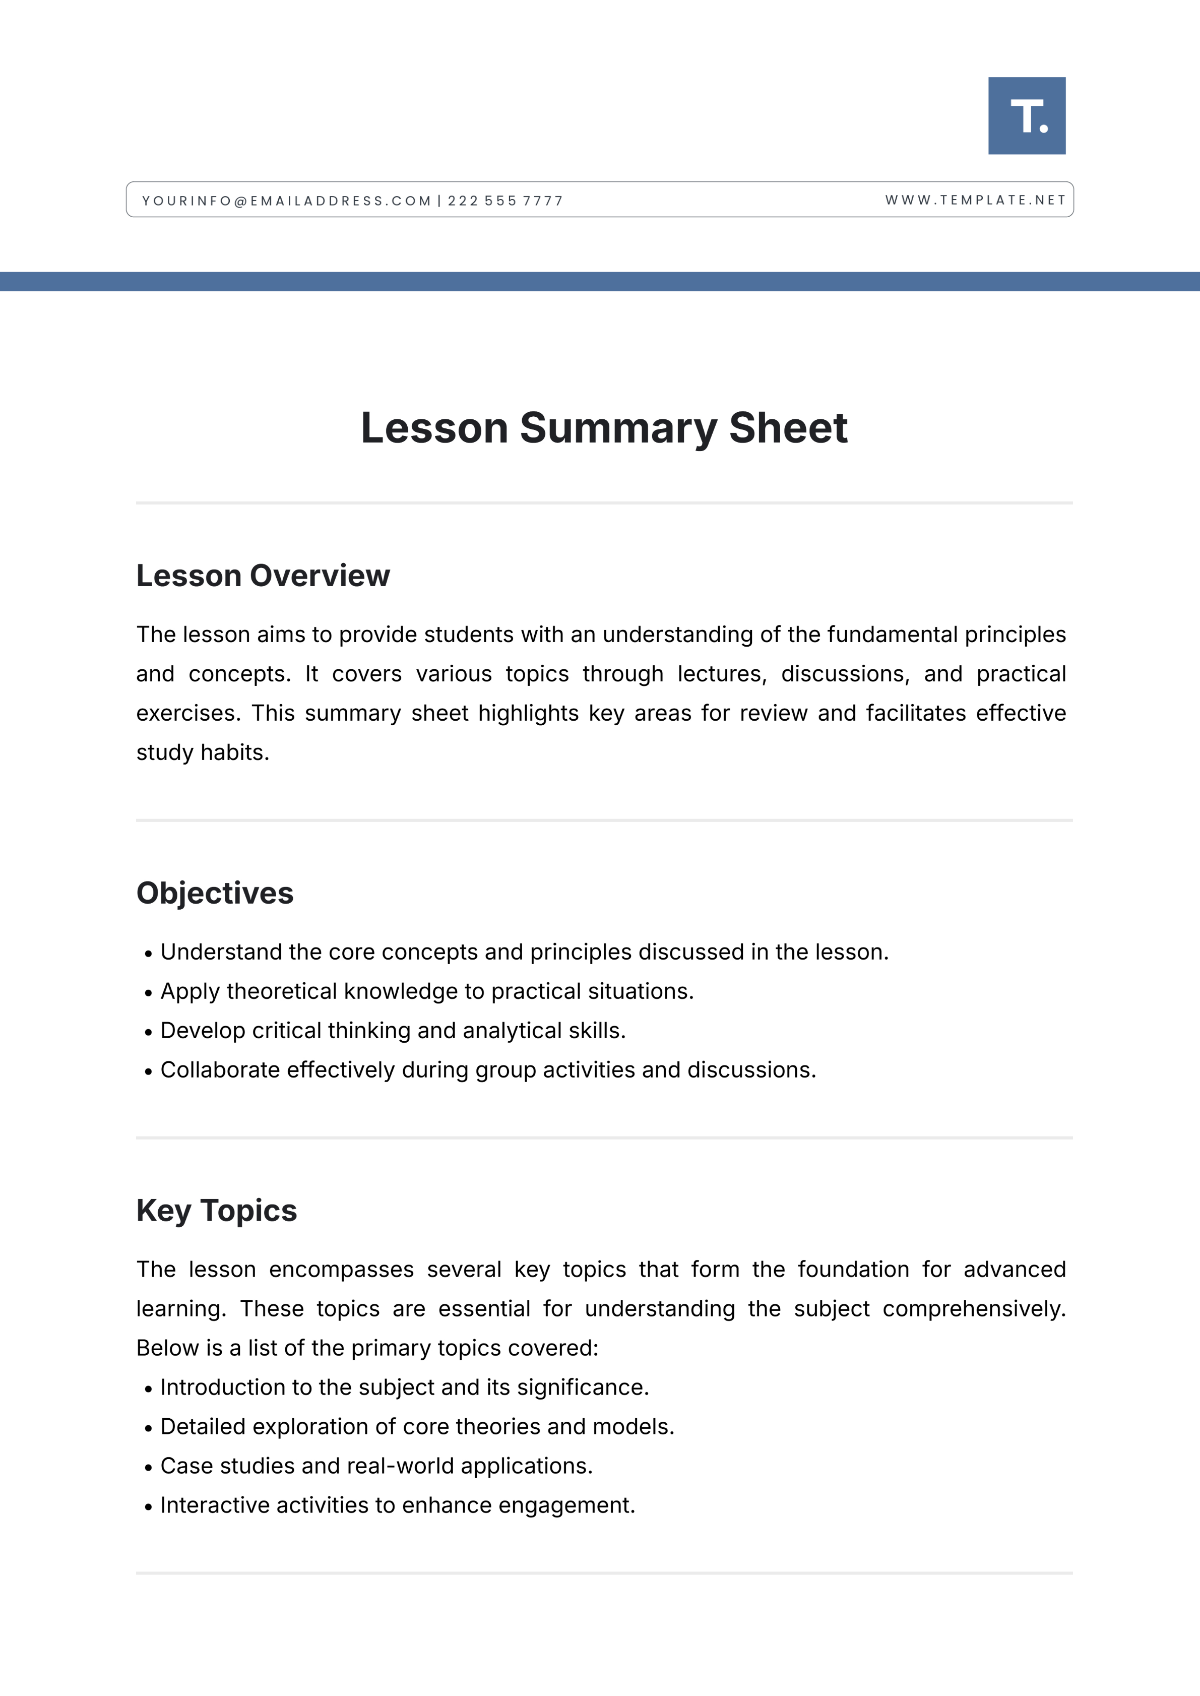
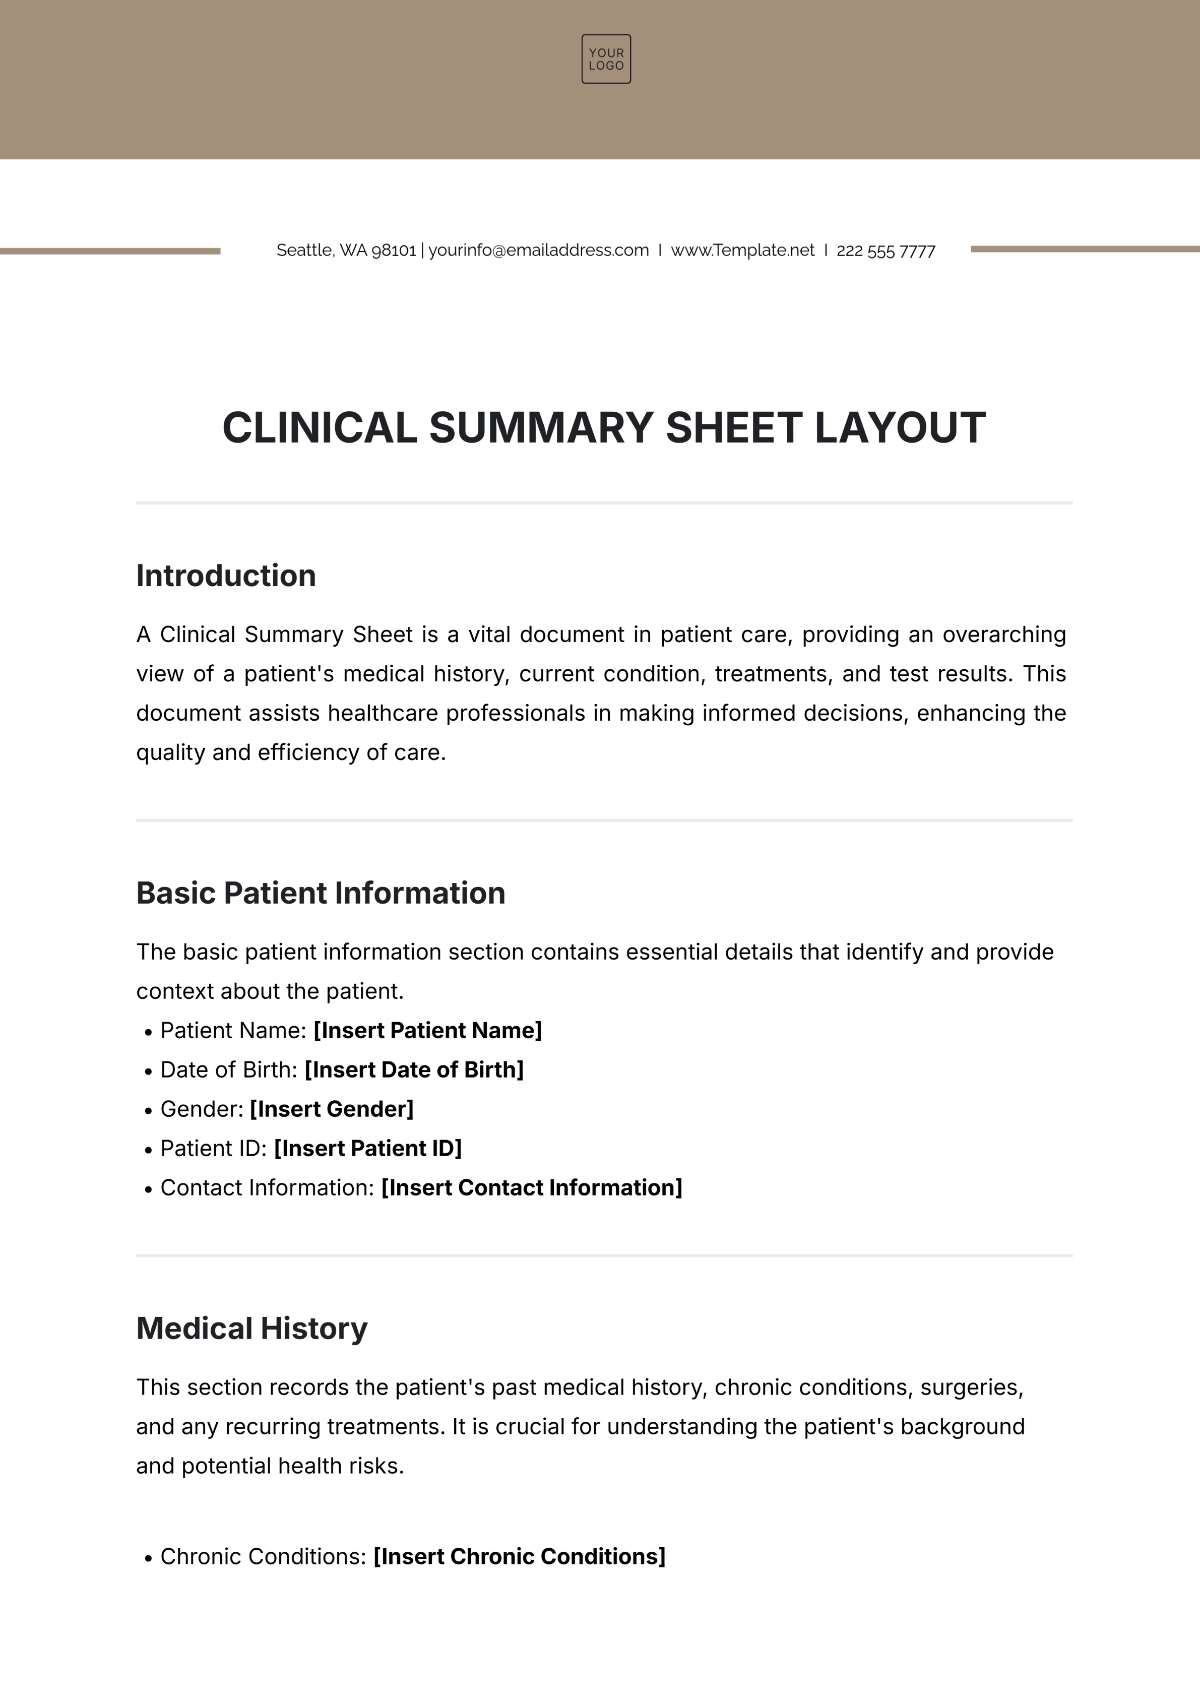
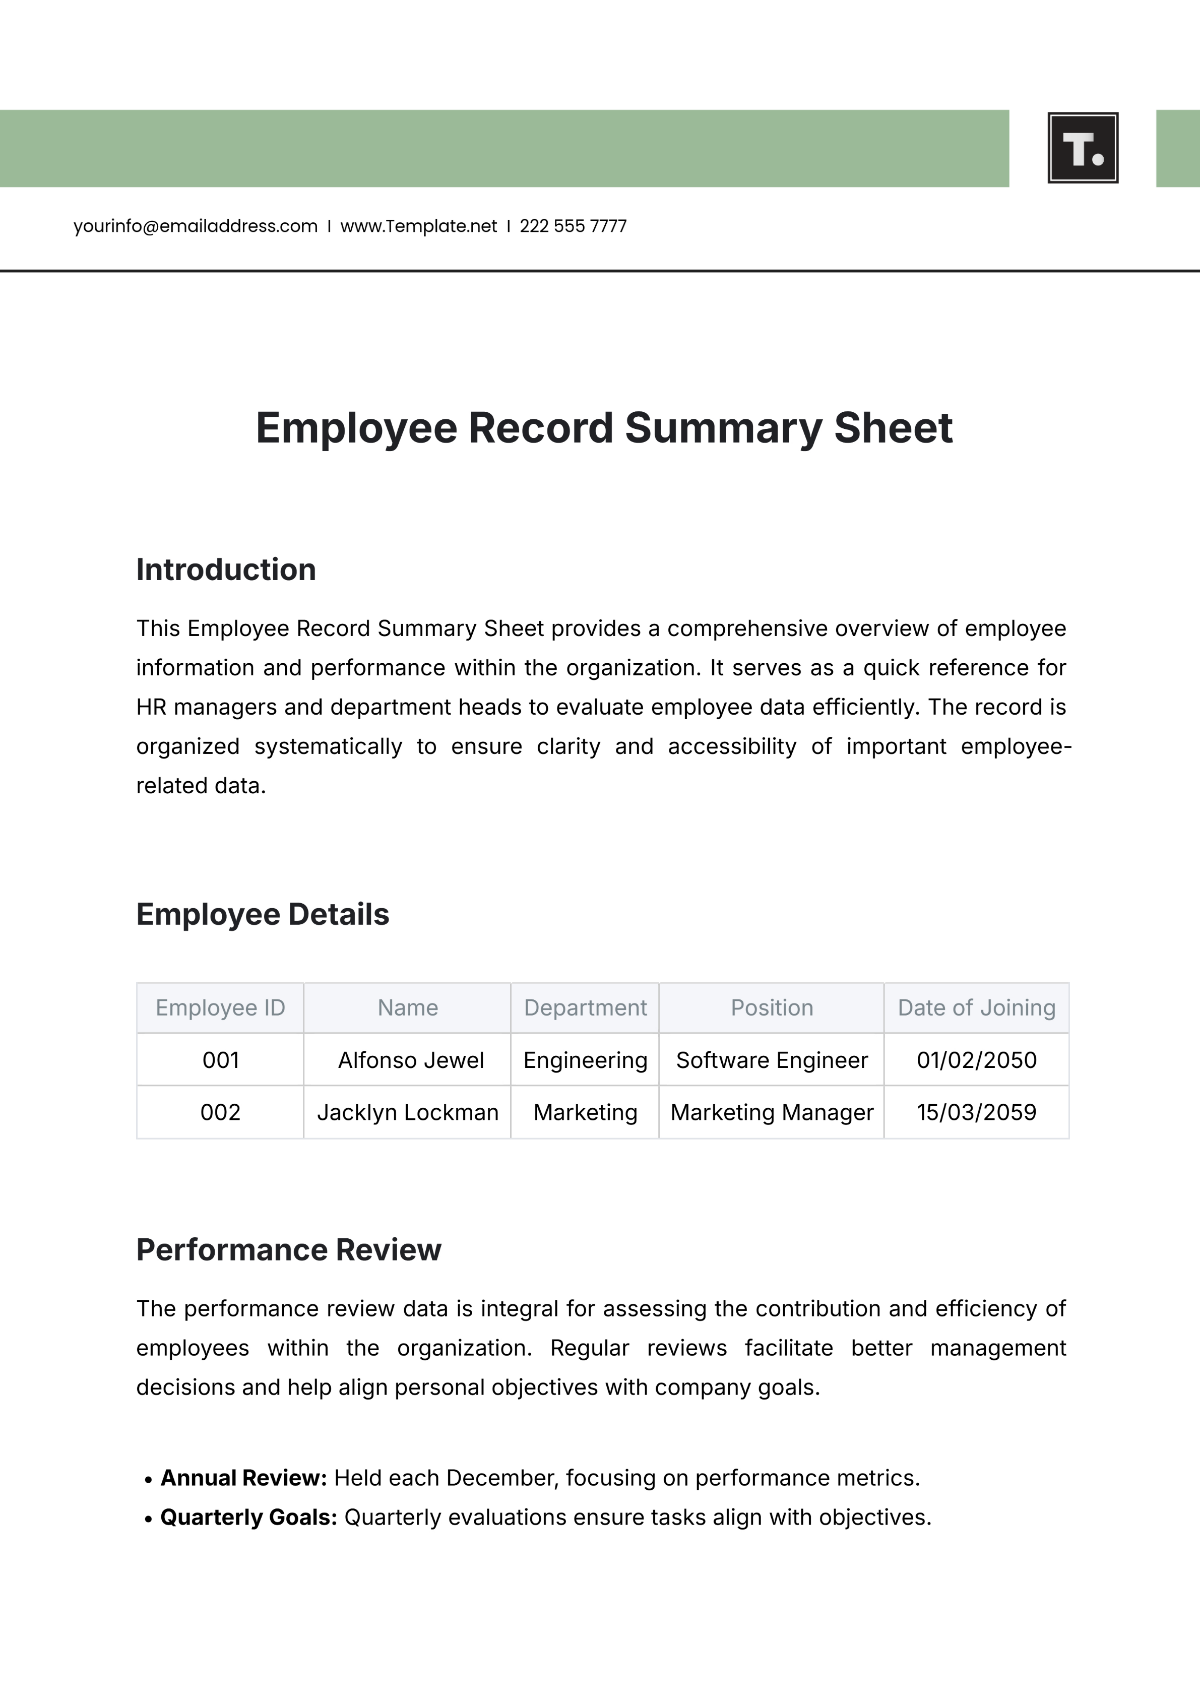
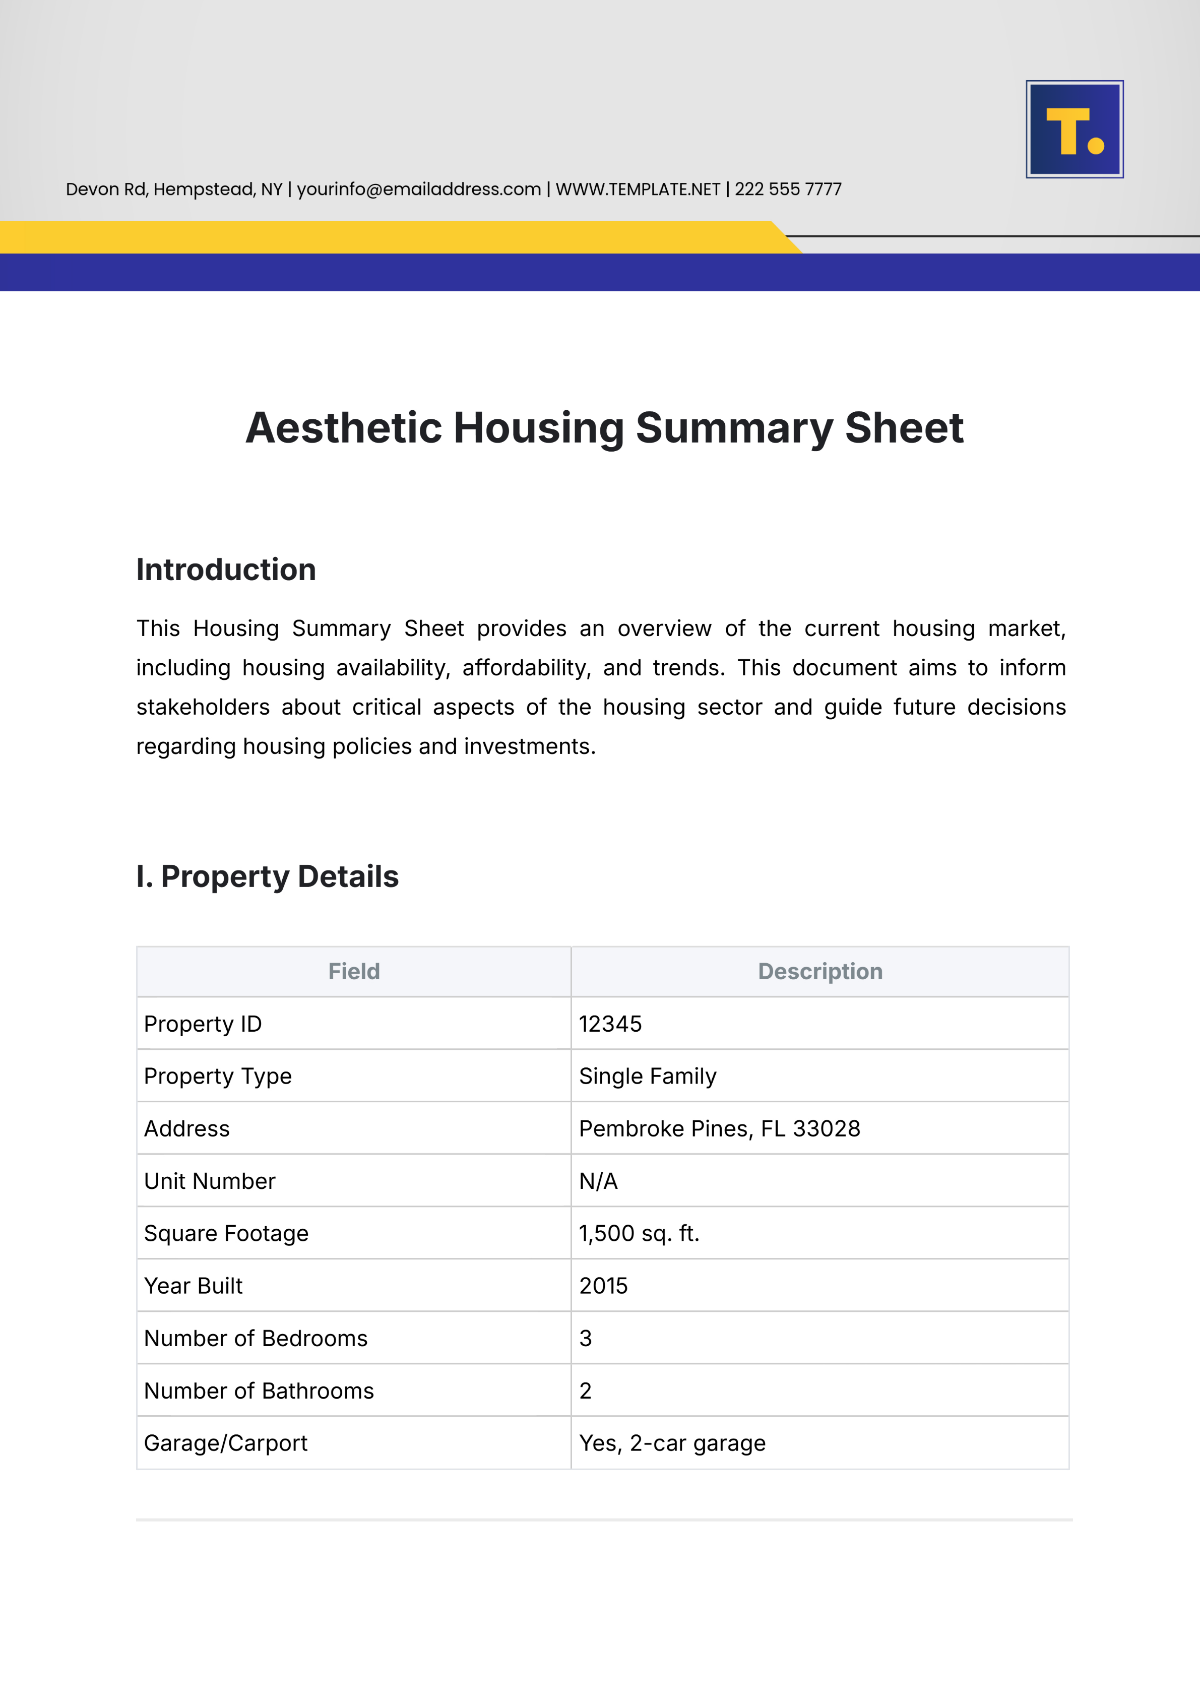
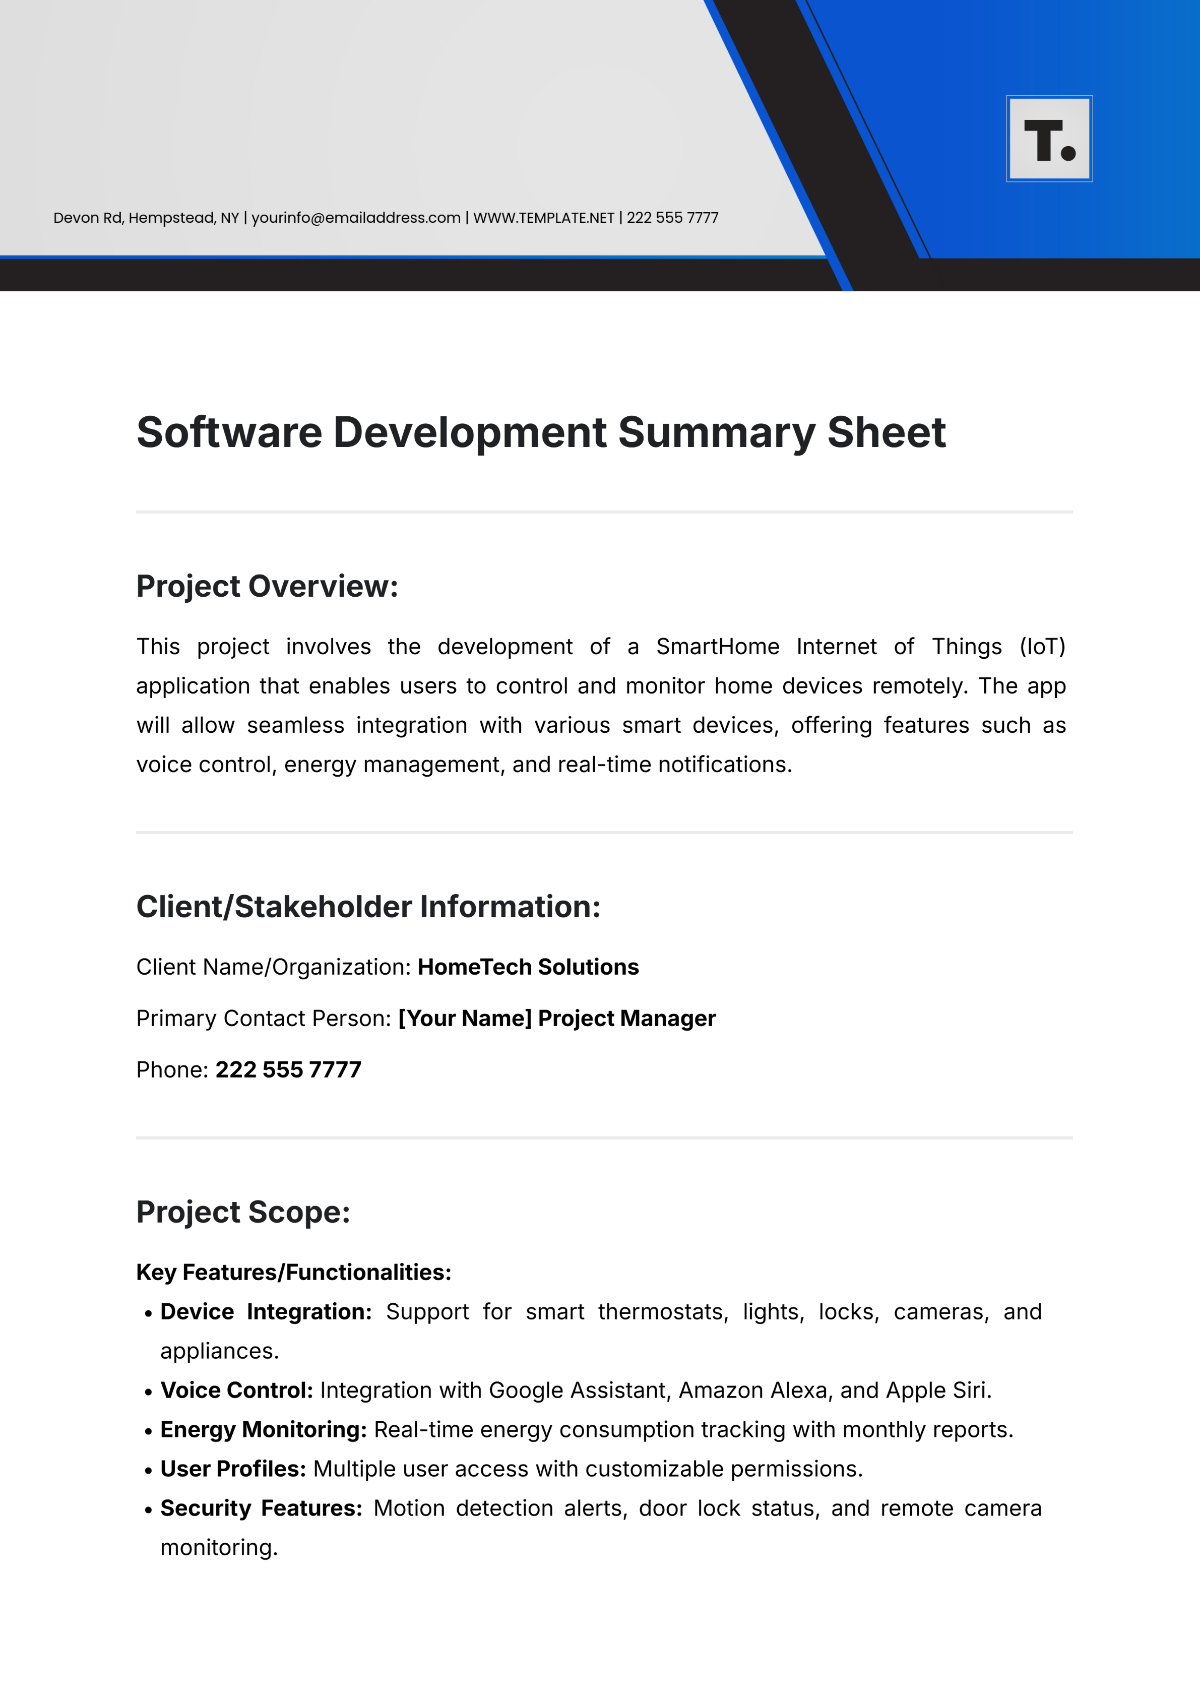
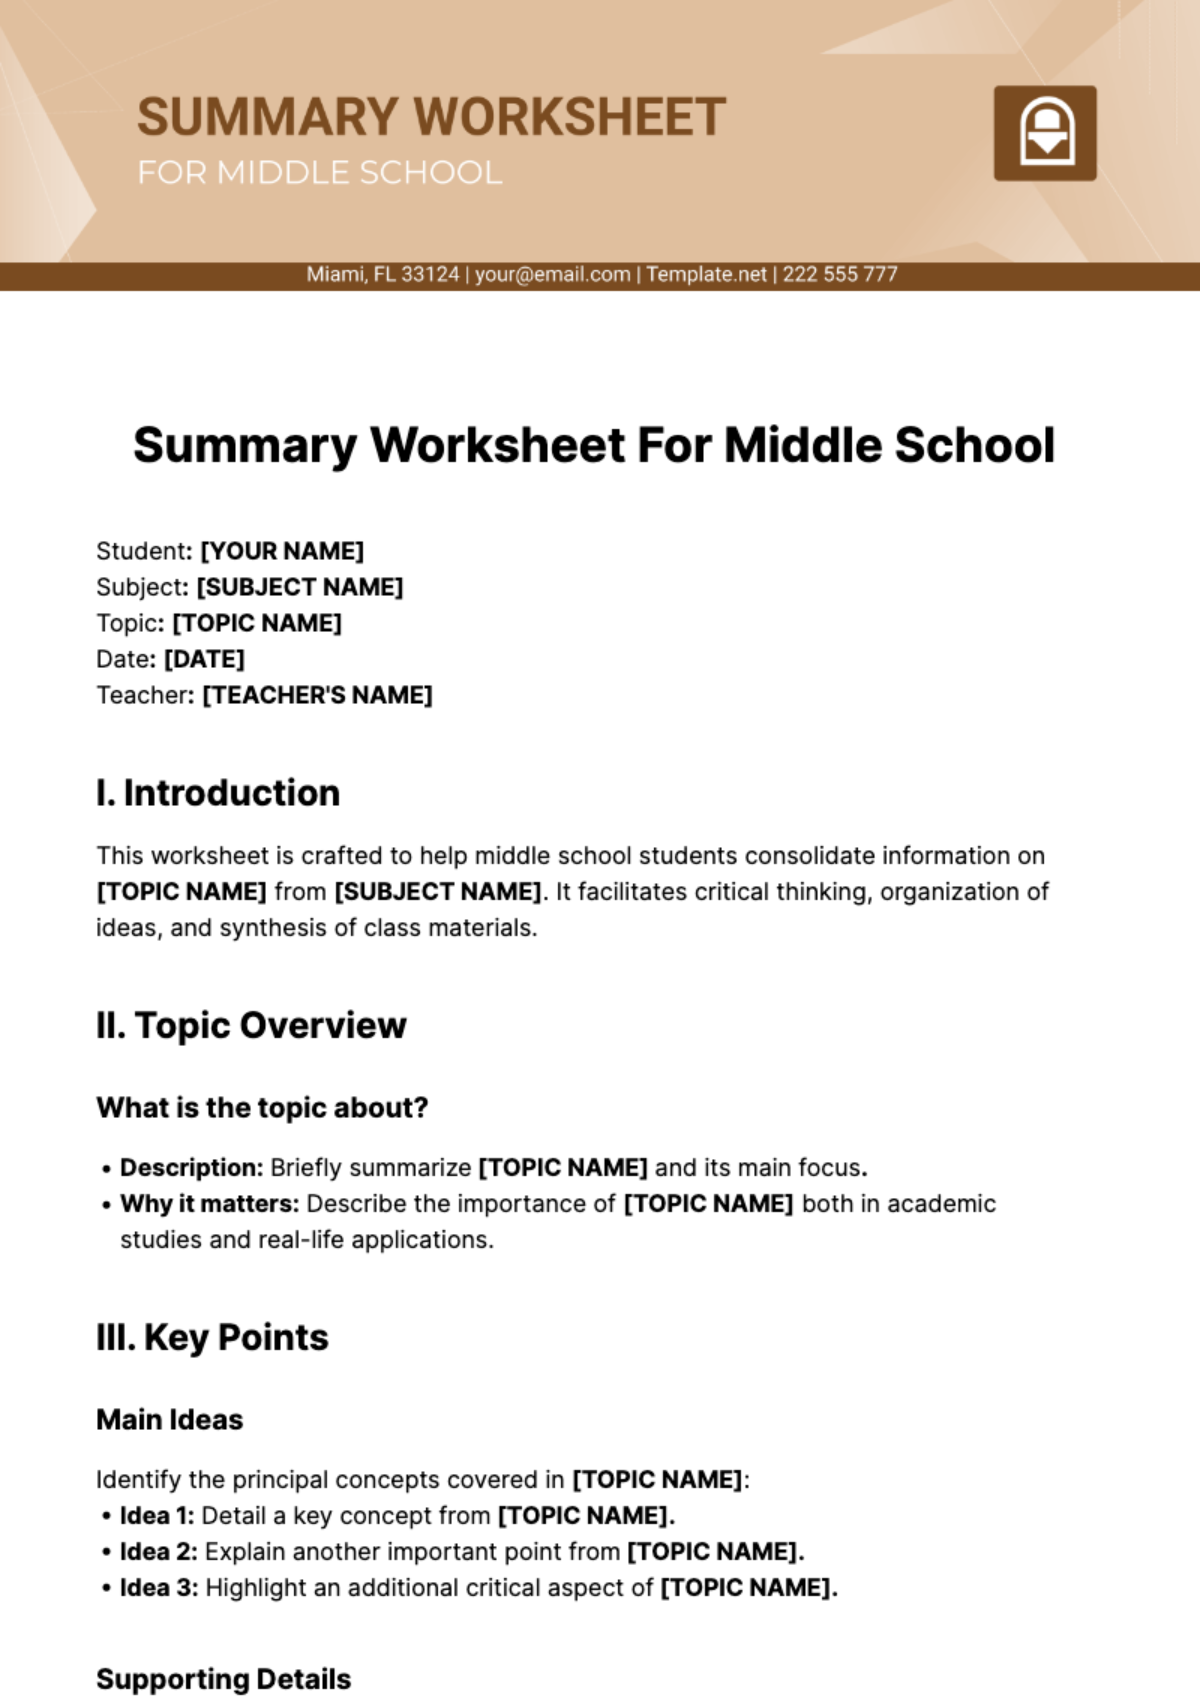
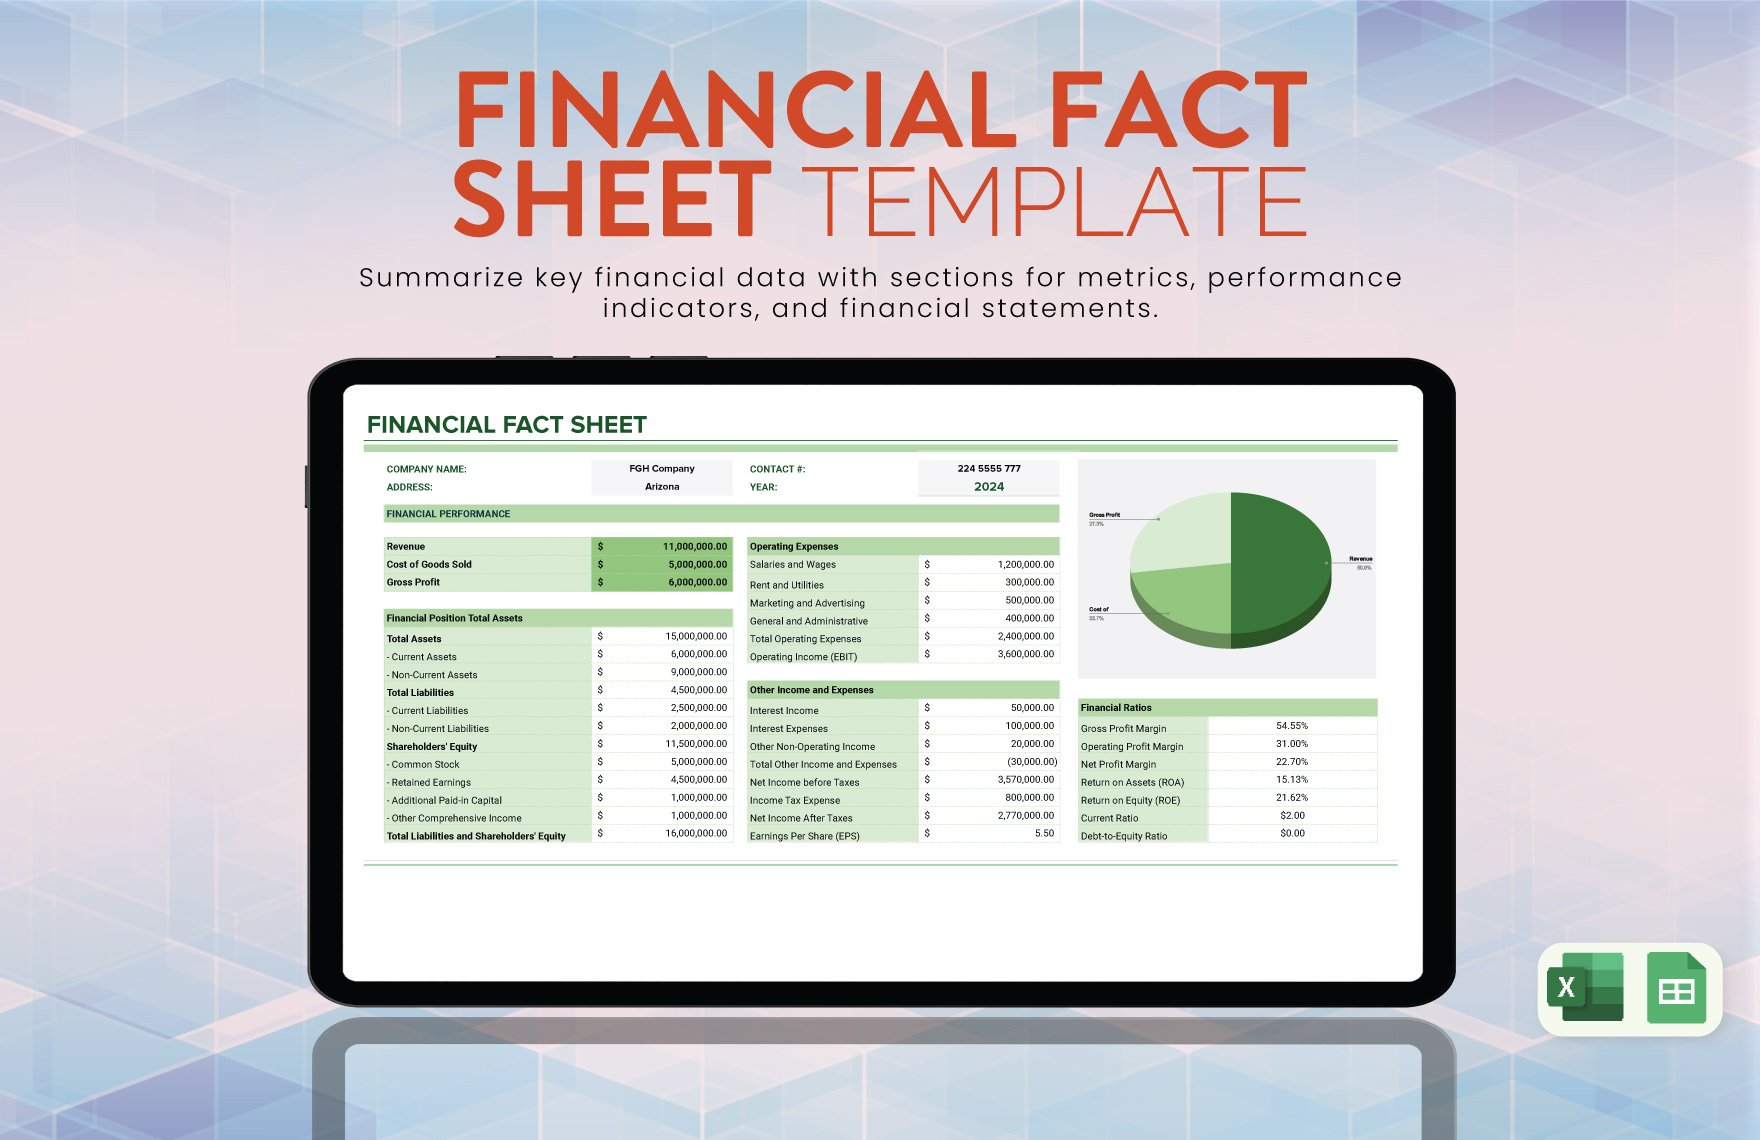
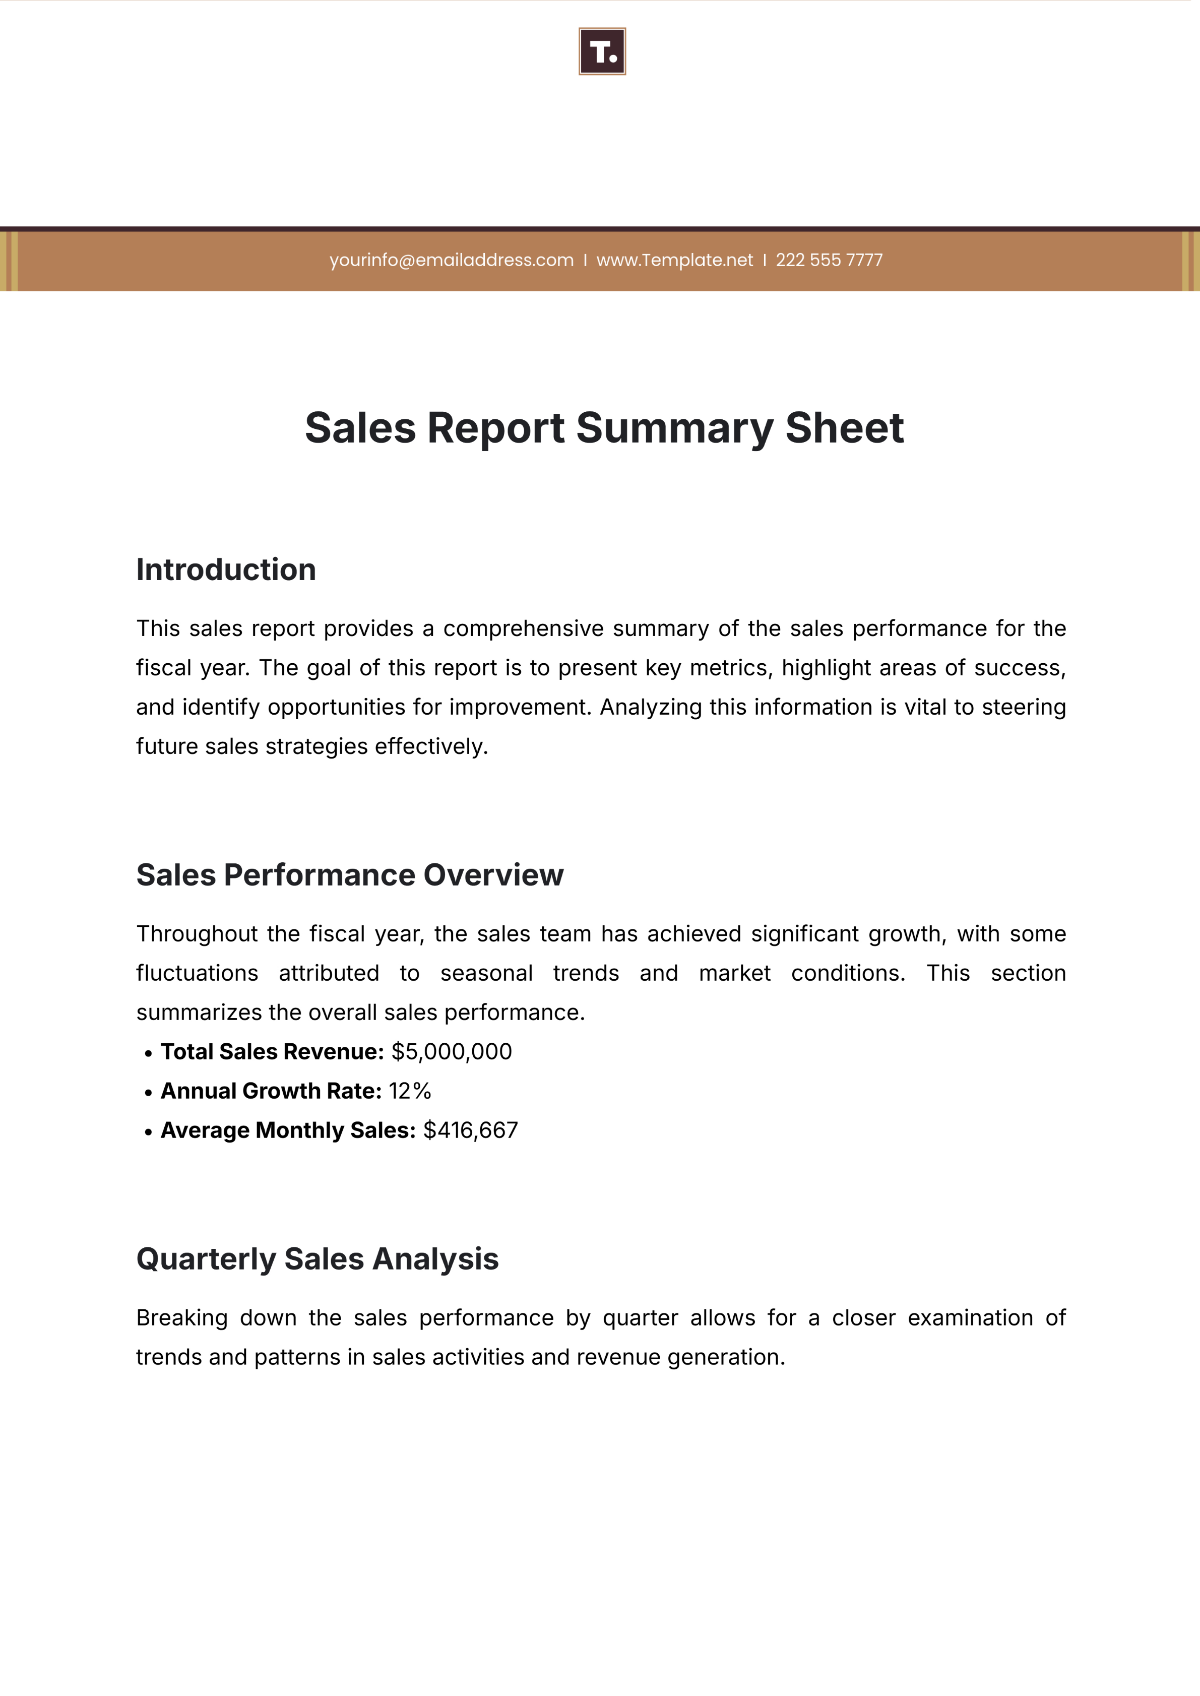
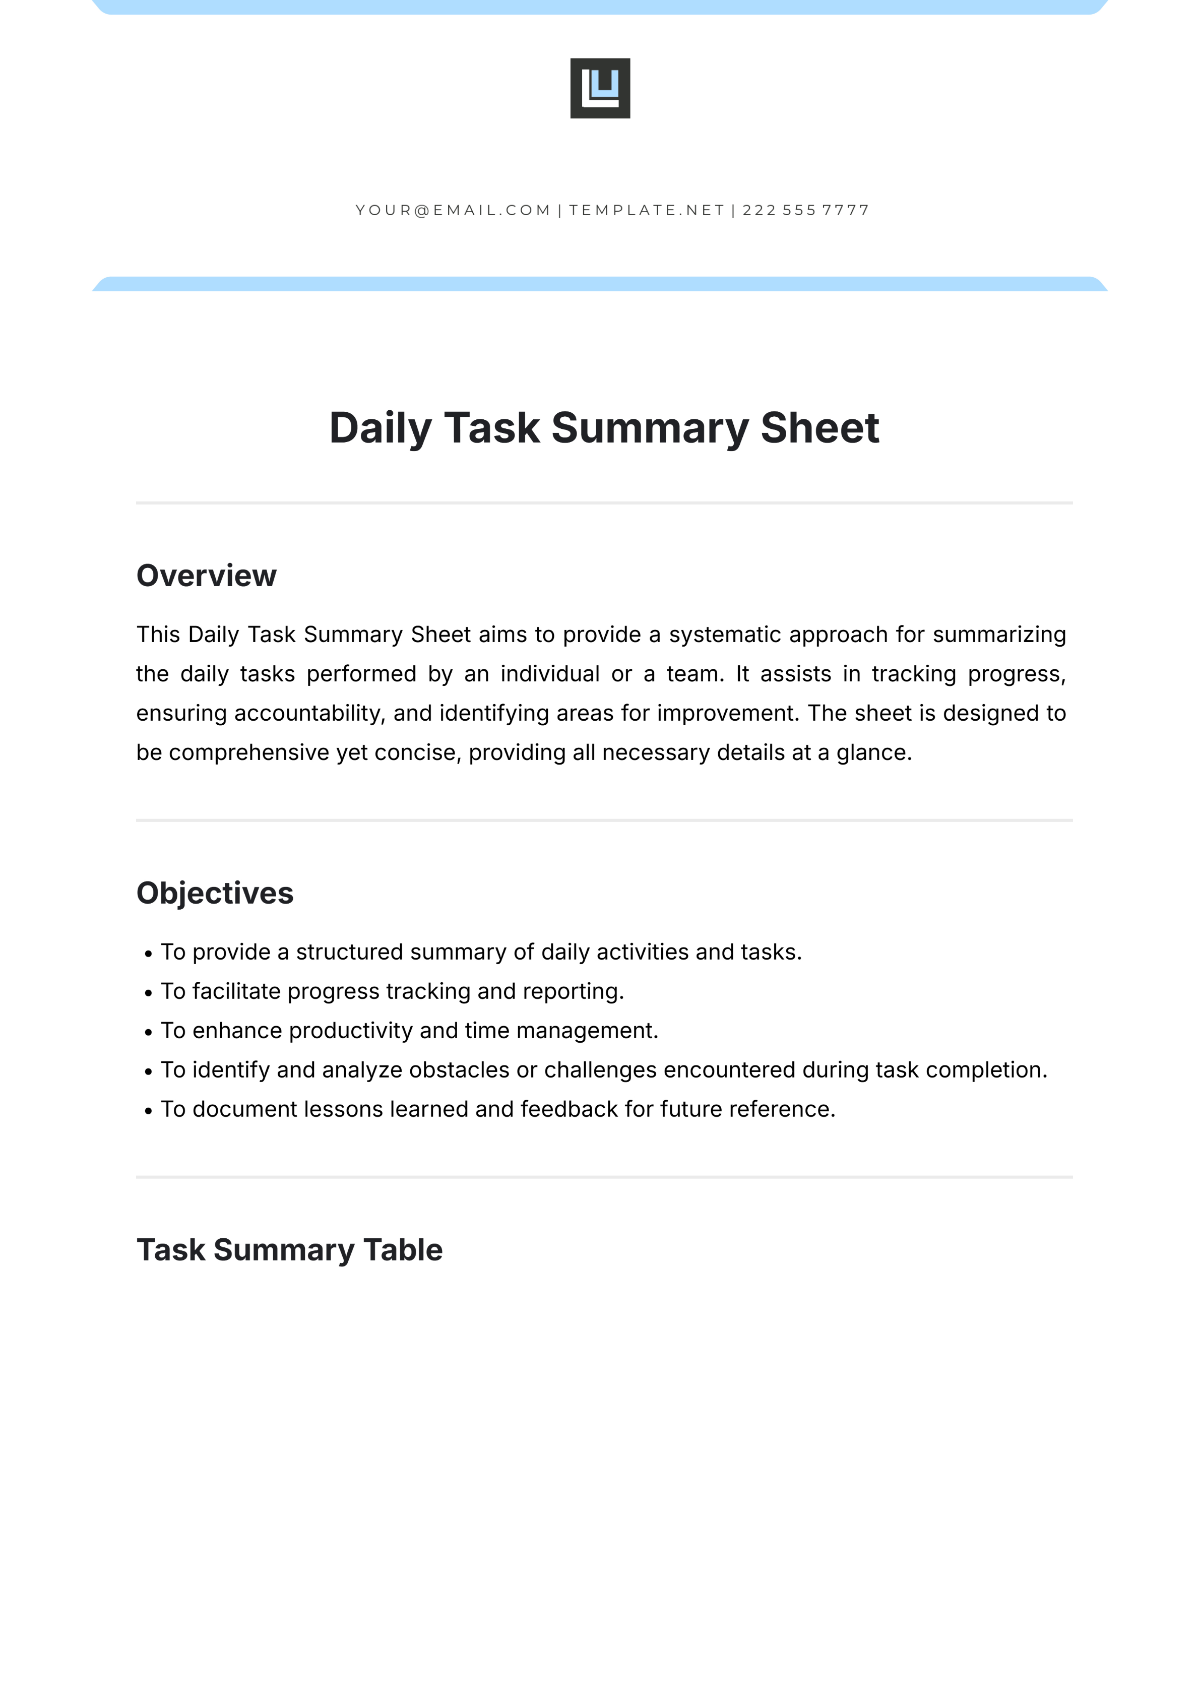
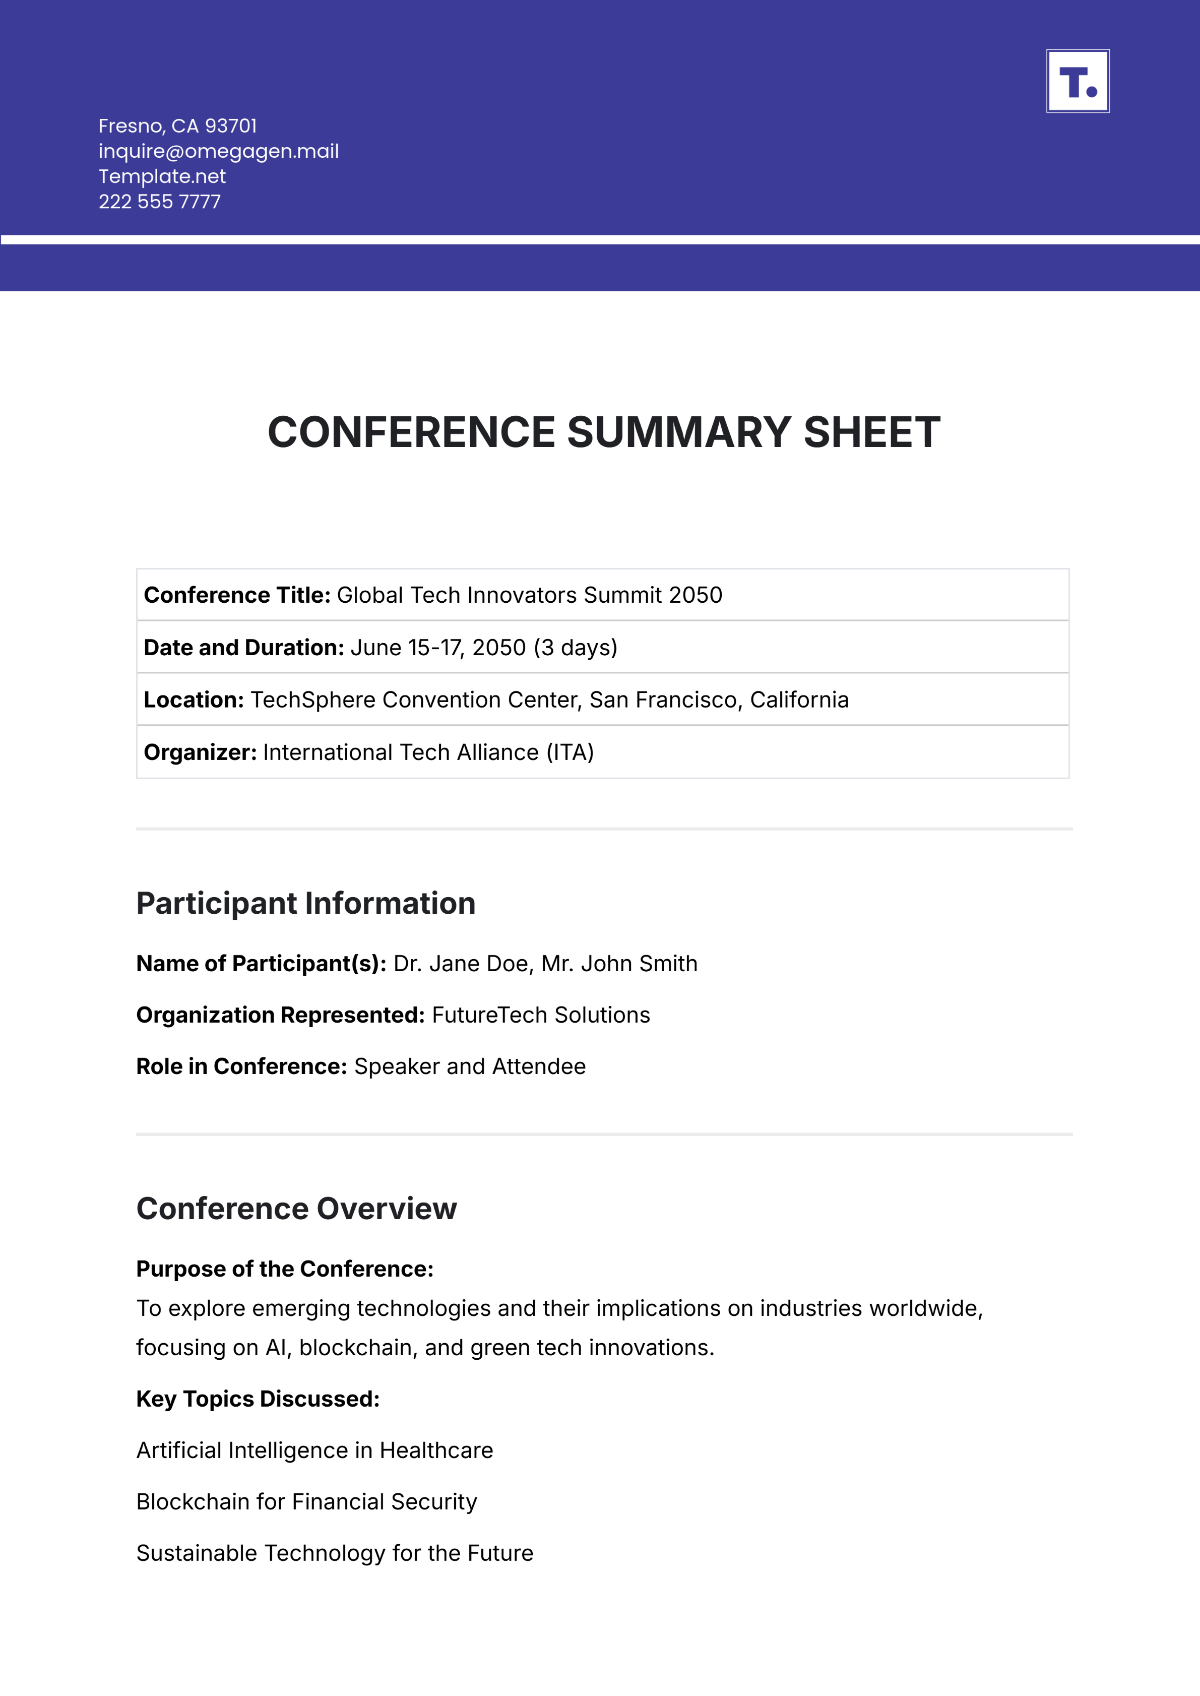
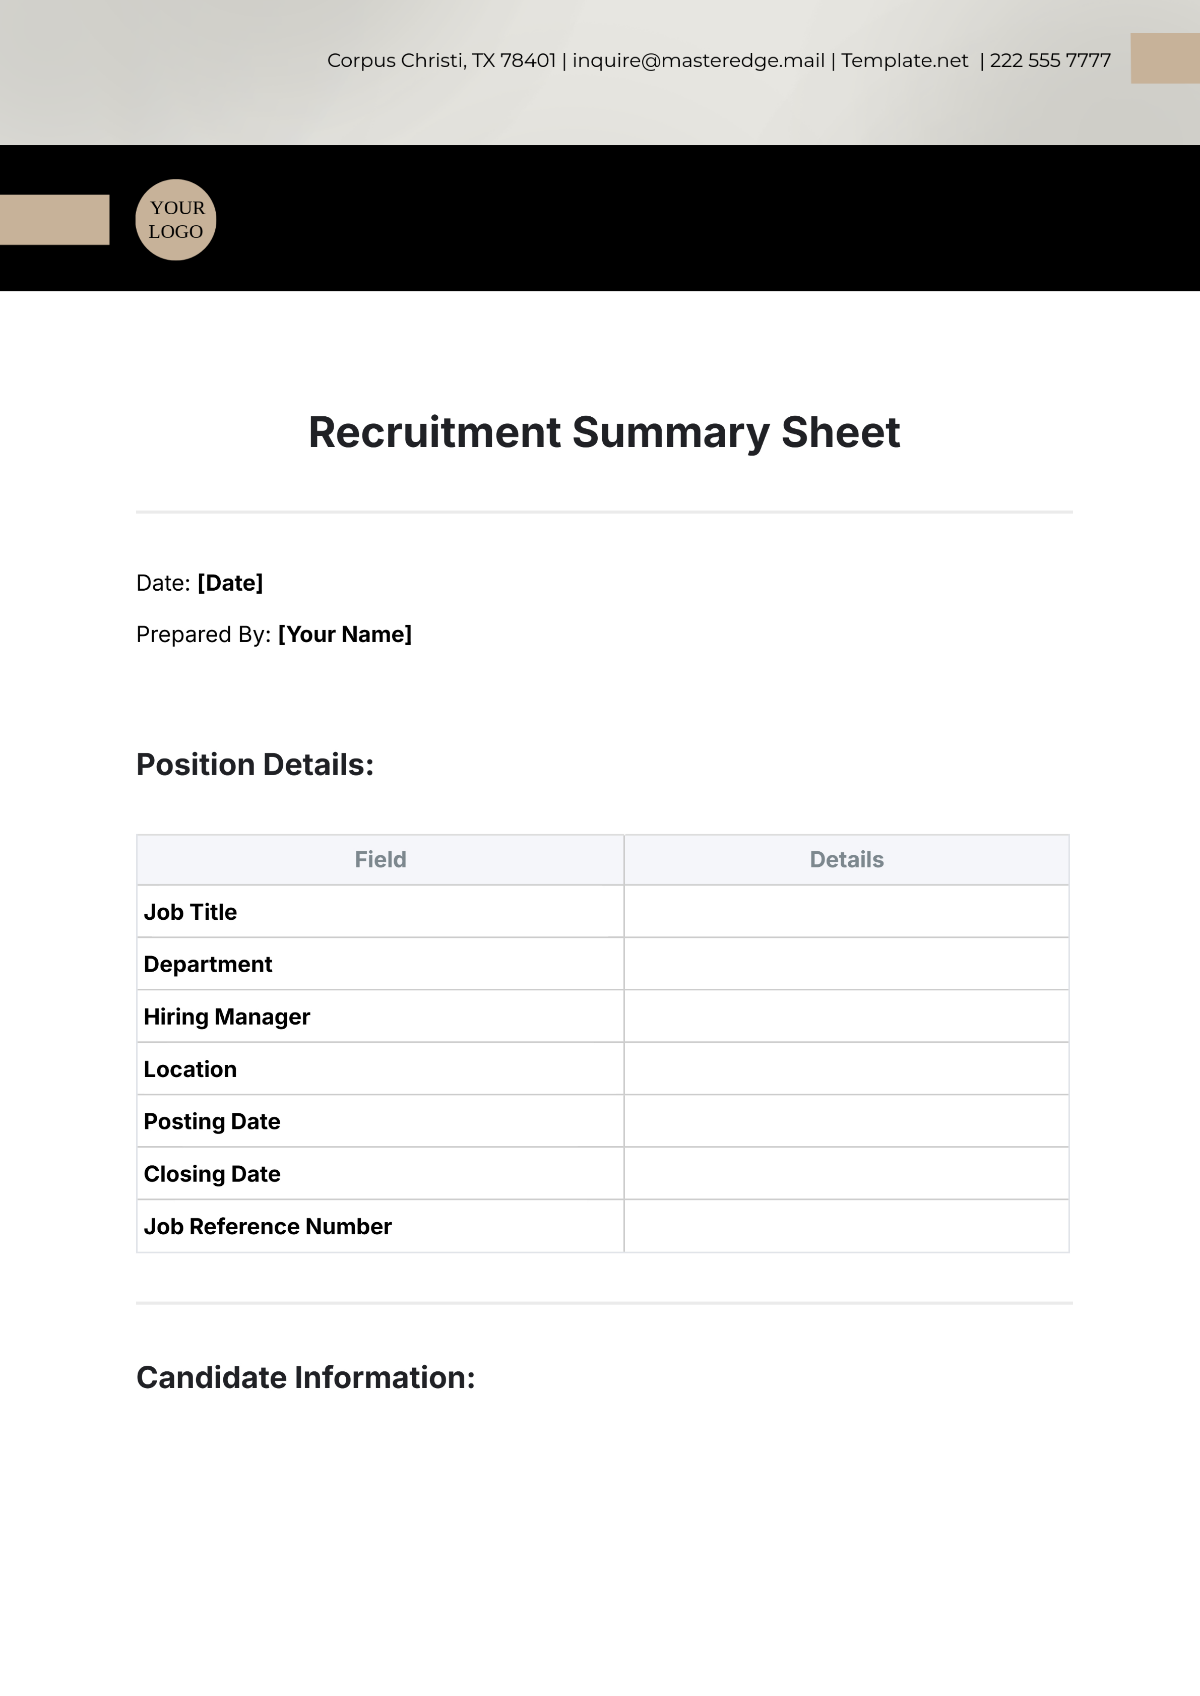
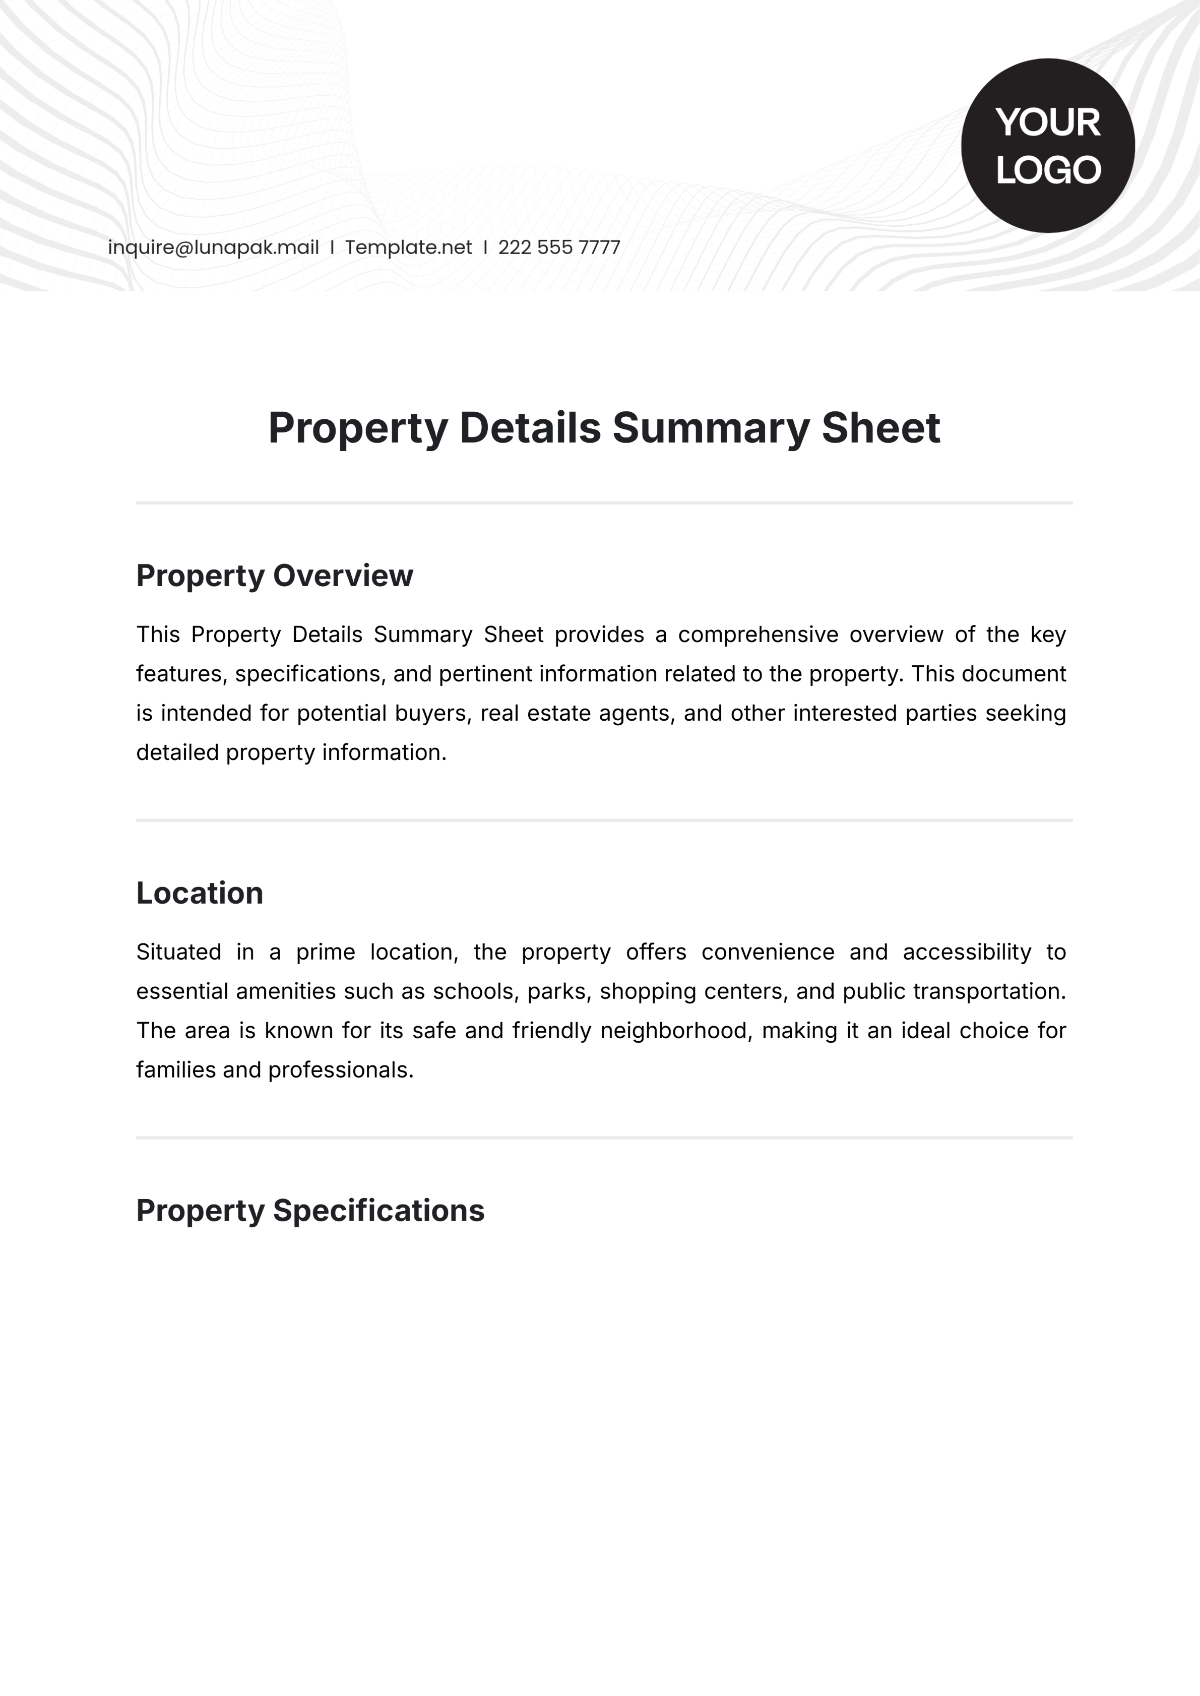
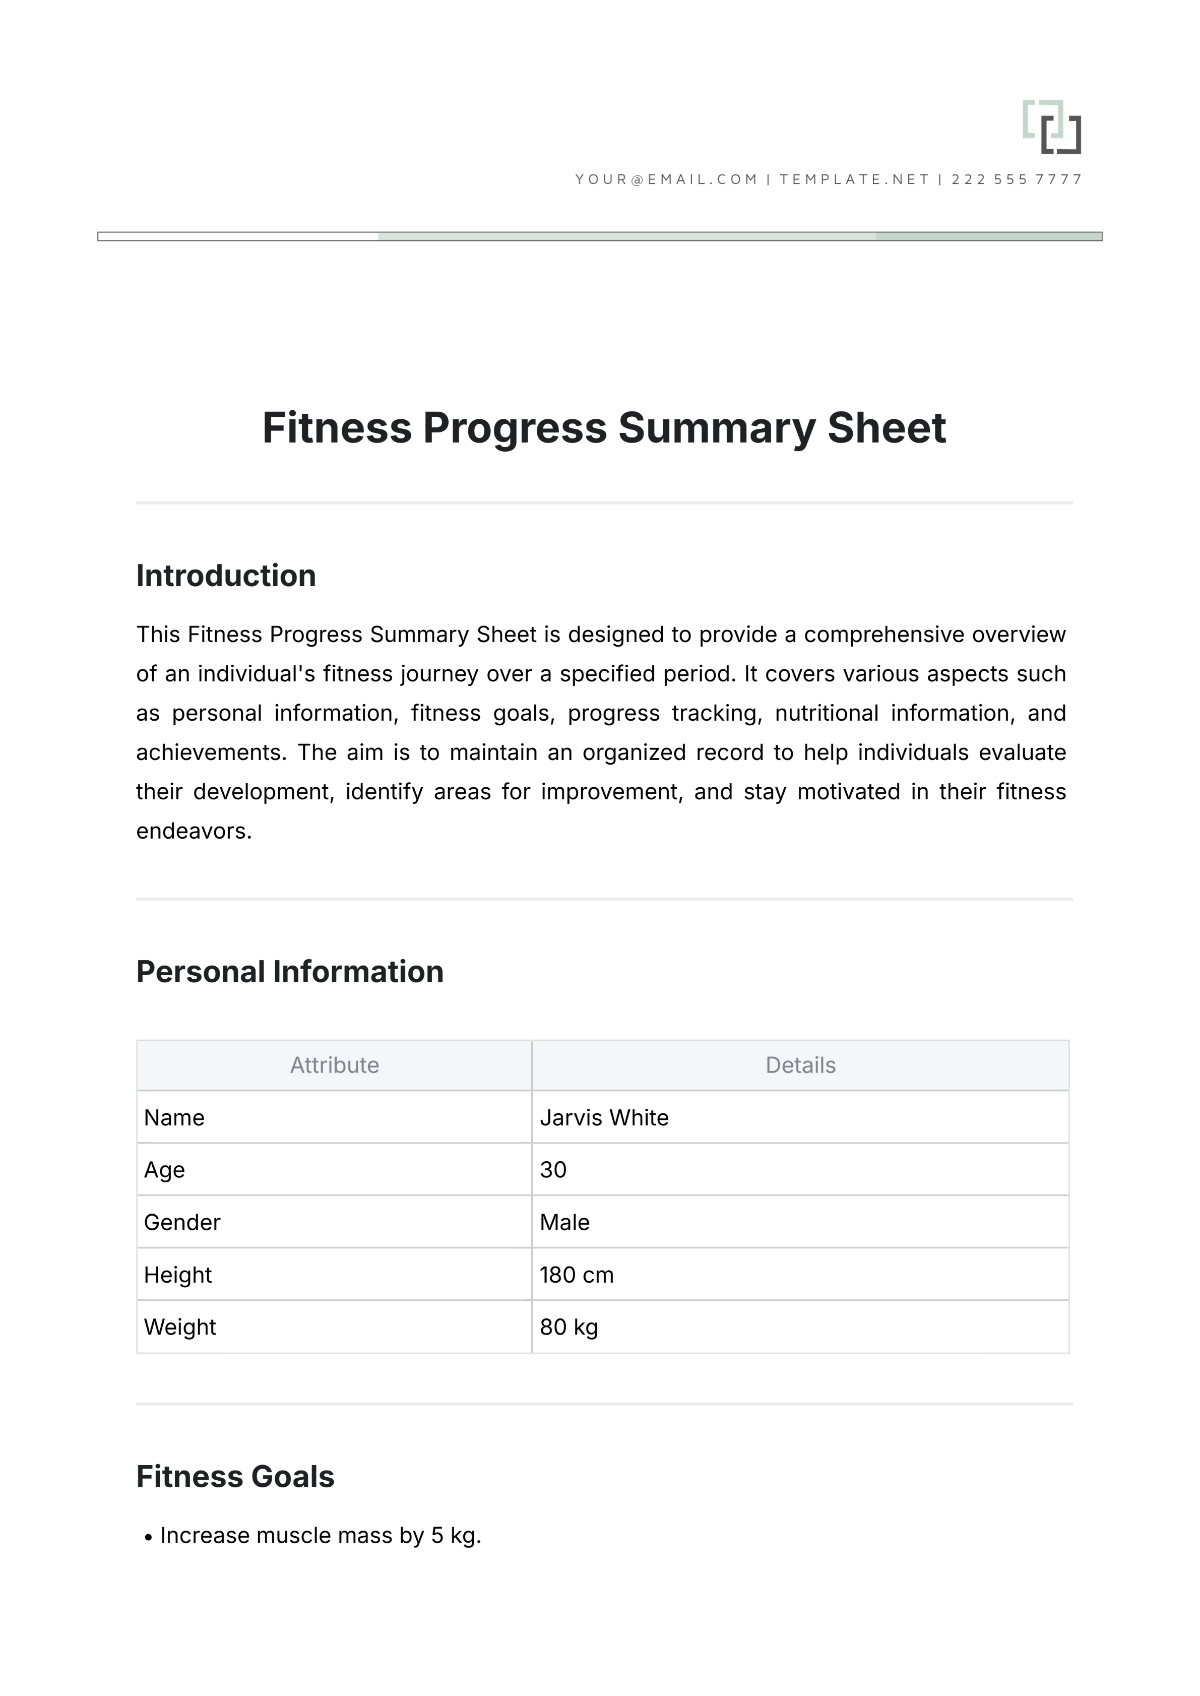
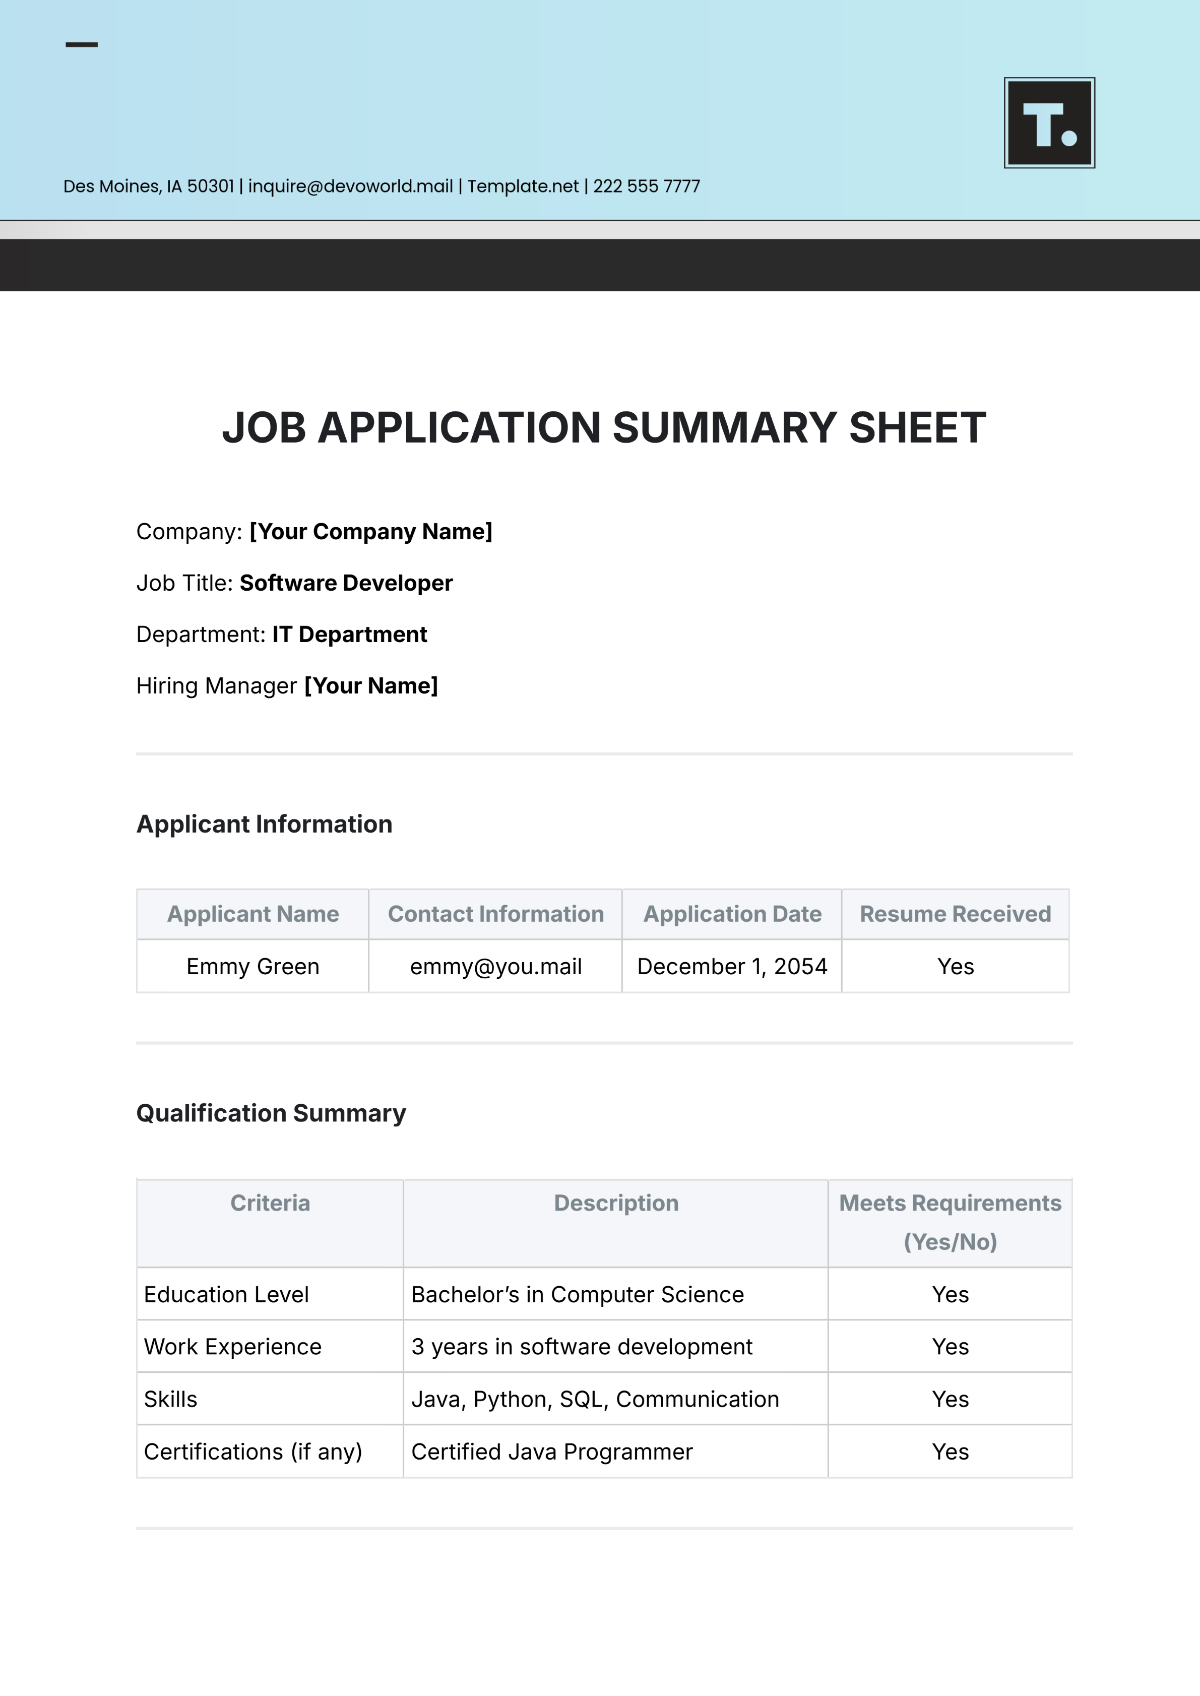
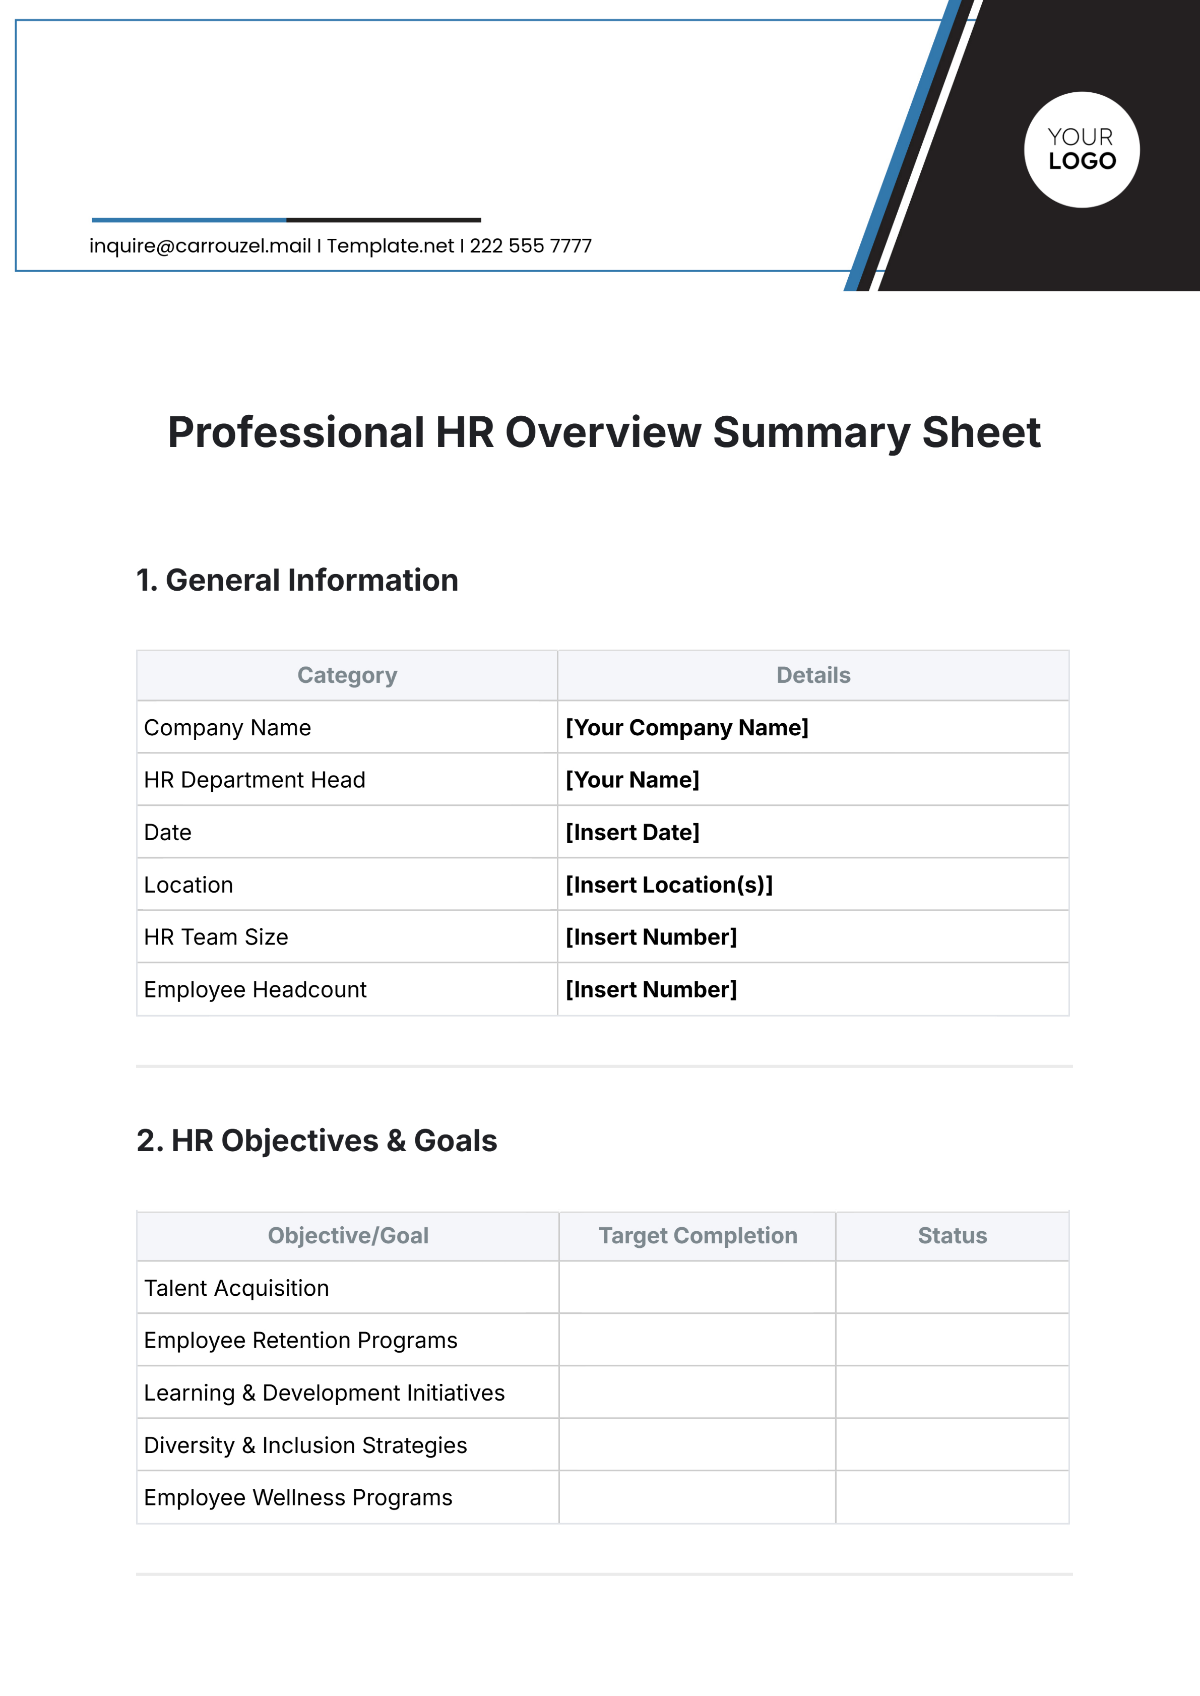
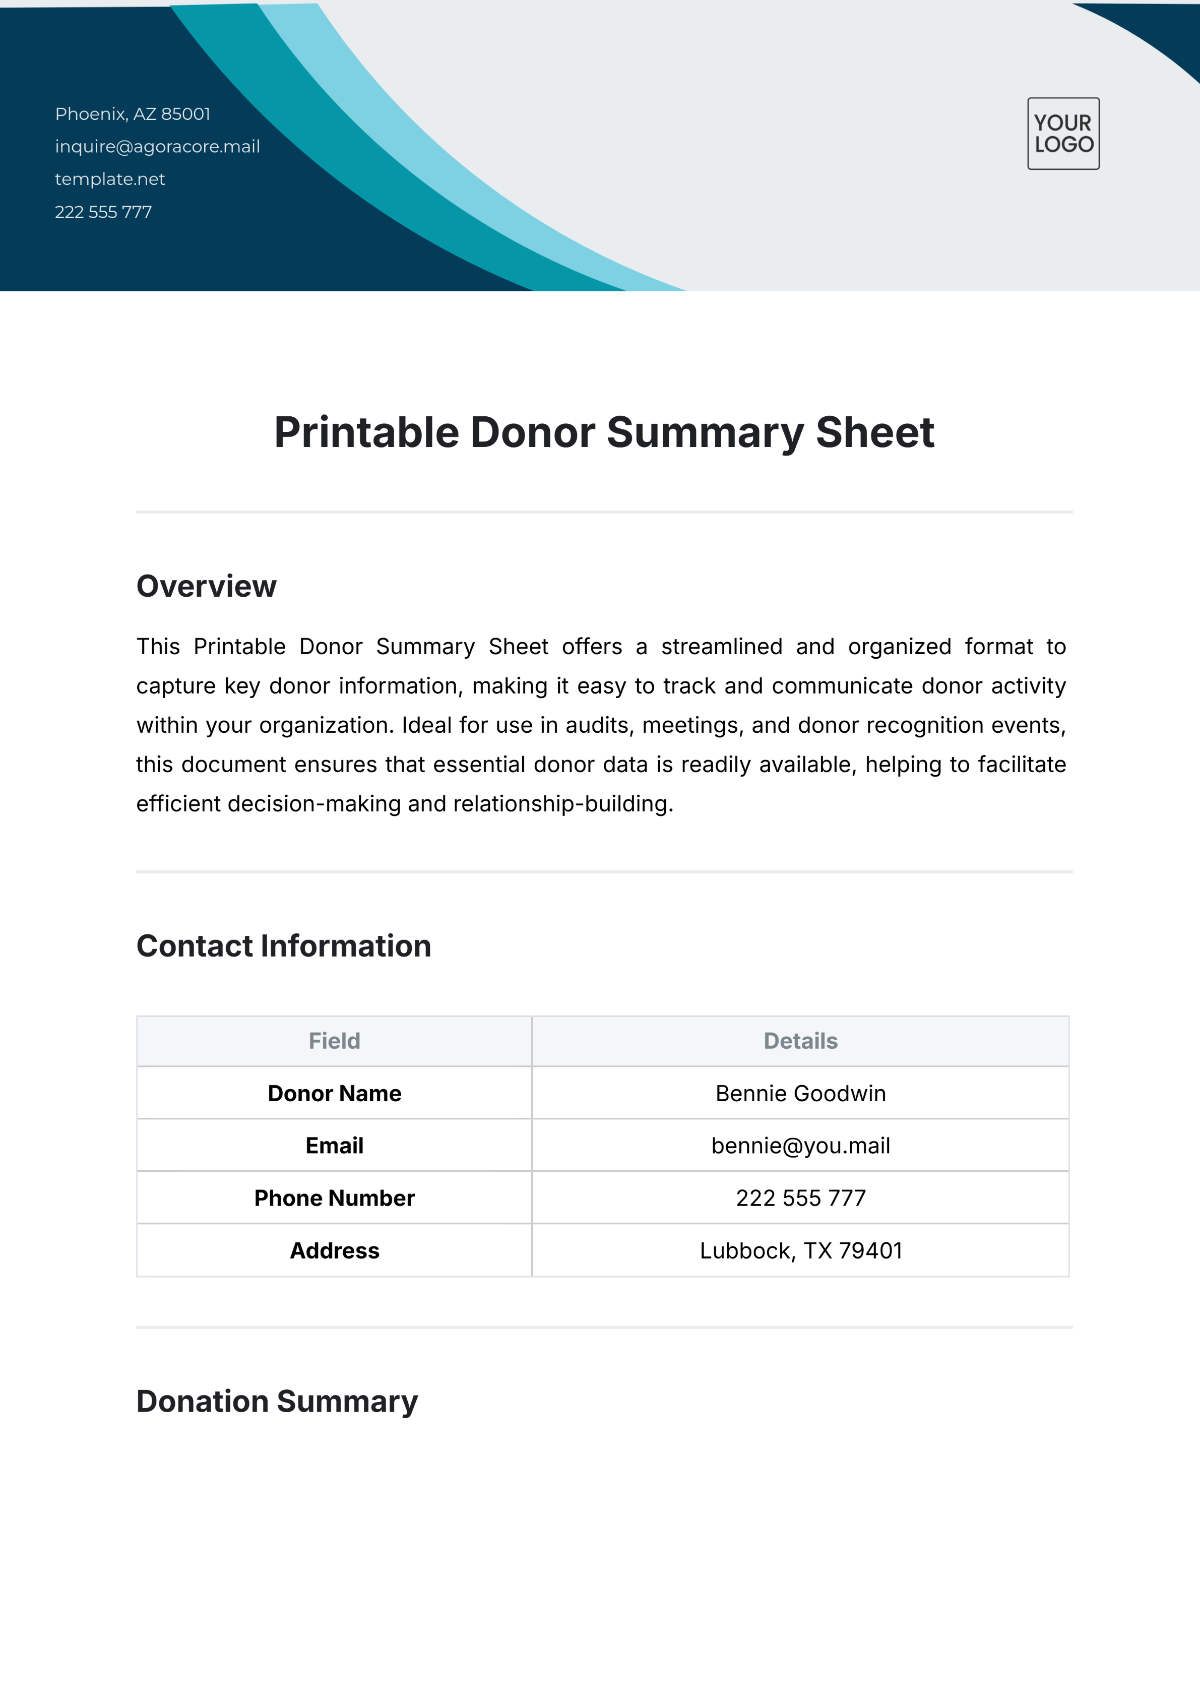
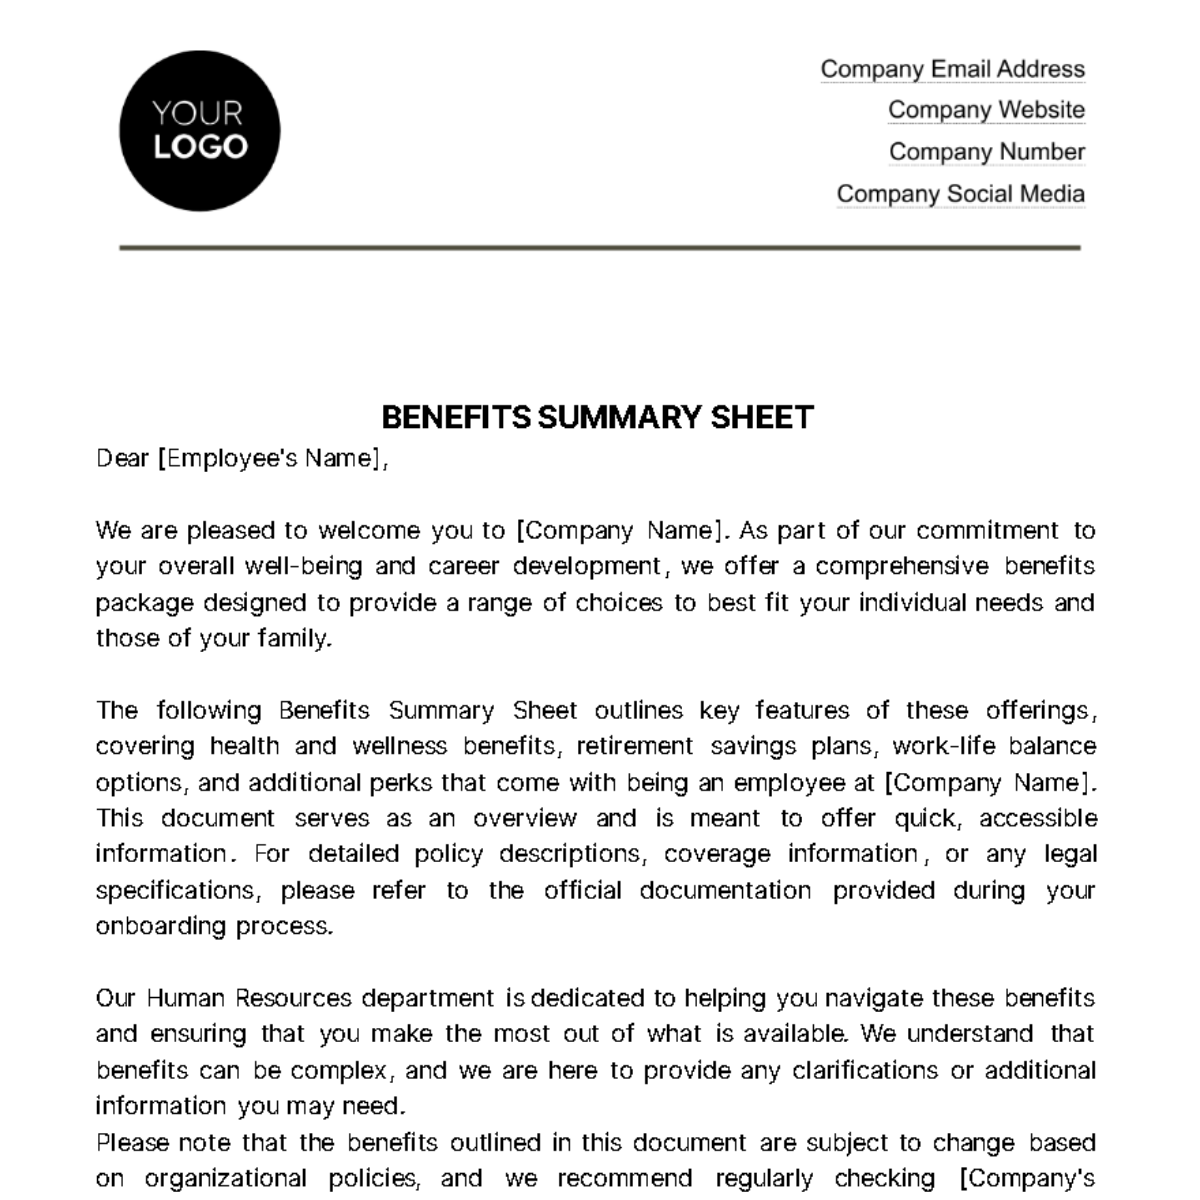
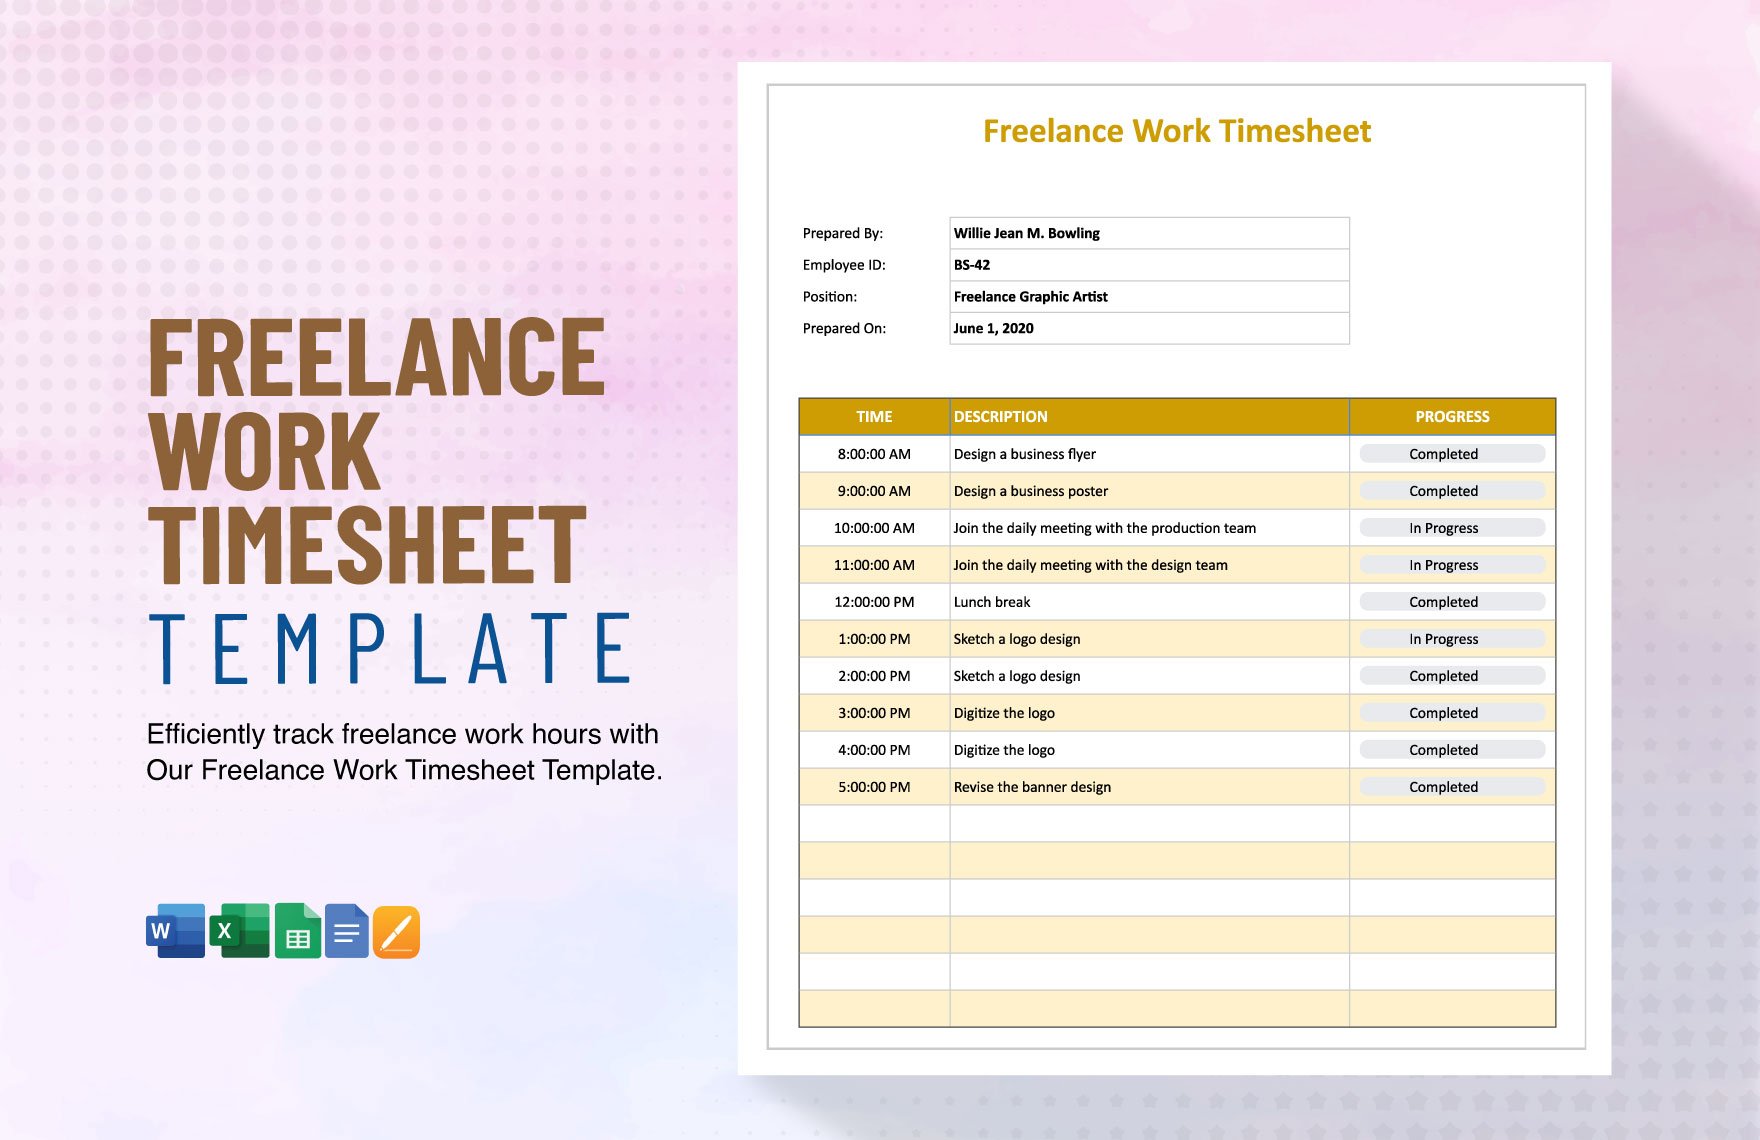
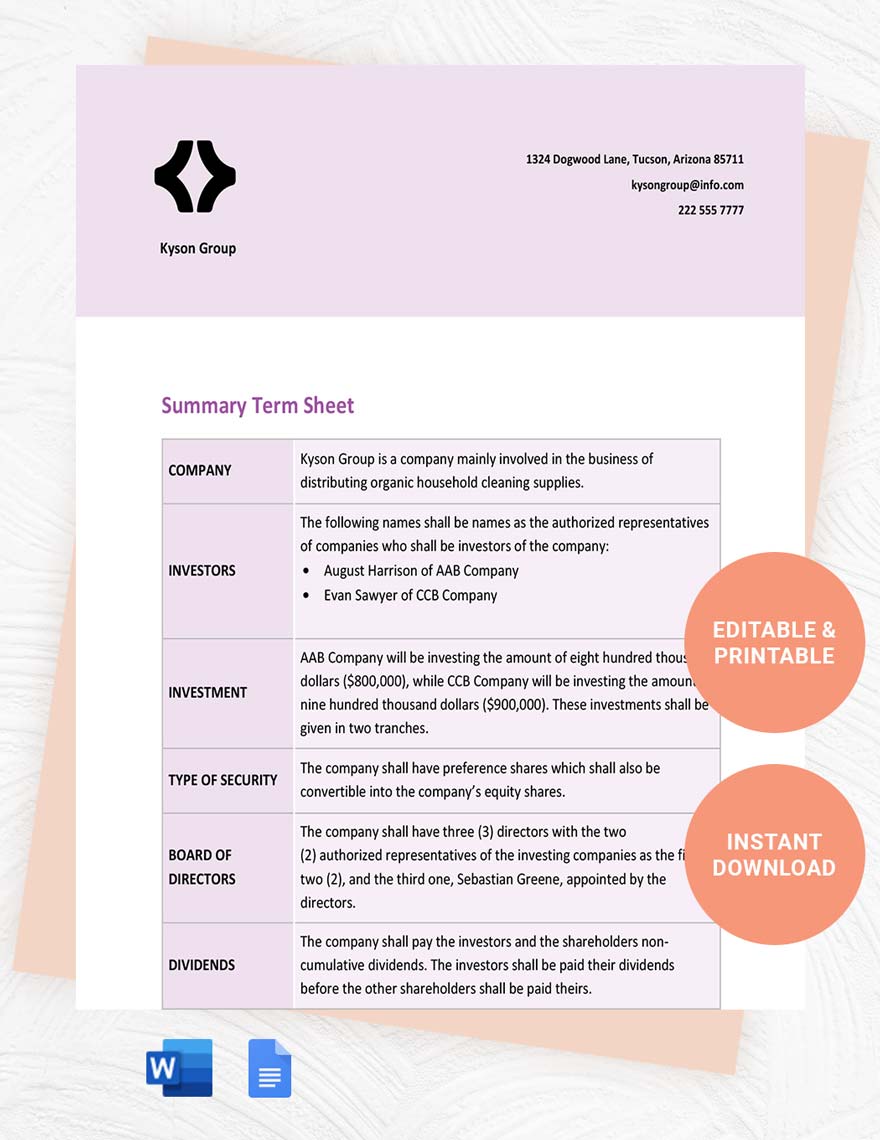
After all financial or education activities conducted, a bookkeeping document should always be in our hands in order to consolidate pairing sets of data in a worksheet. Whether you're a teacher or a sales professional, it might be a bit stressful especially when filling in the cells in your worksheet, then dwelling with the numbers, isn't it? Well, our beautifully and comprehensively designed summary sheet templates in Template.net Pro have got your back! To save yourself from stress, utilize these ready-made Summary Sheet Templates which are available in all file formats including Google Docs, Google Sheets, MS Word, Excel, Numbers, and Pages, as well as in A4 and US letter sizes. Download these completely customizable templates for your great convenience and total satisfaction today!
What Is a Summary Sheet?
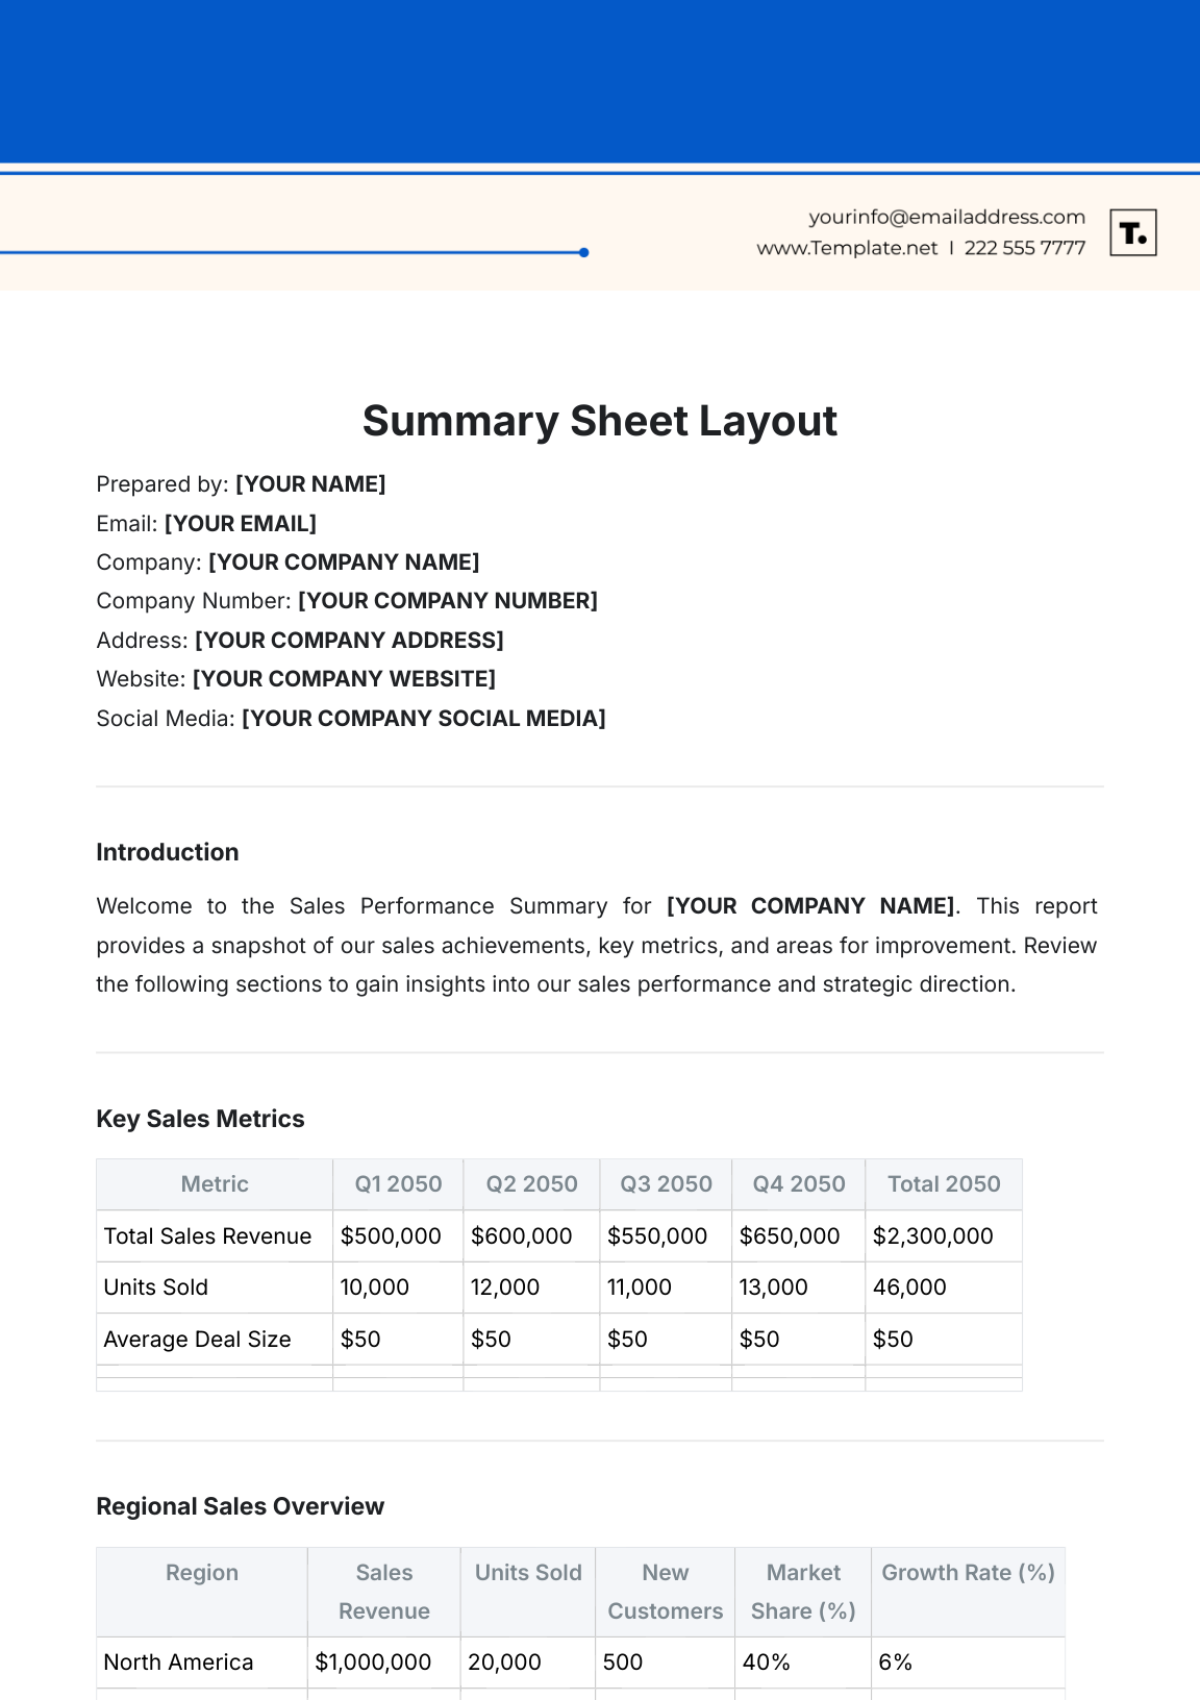
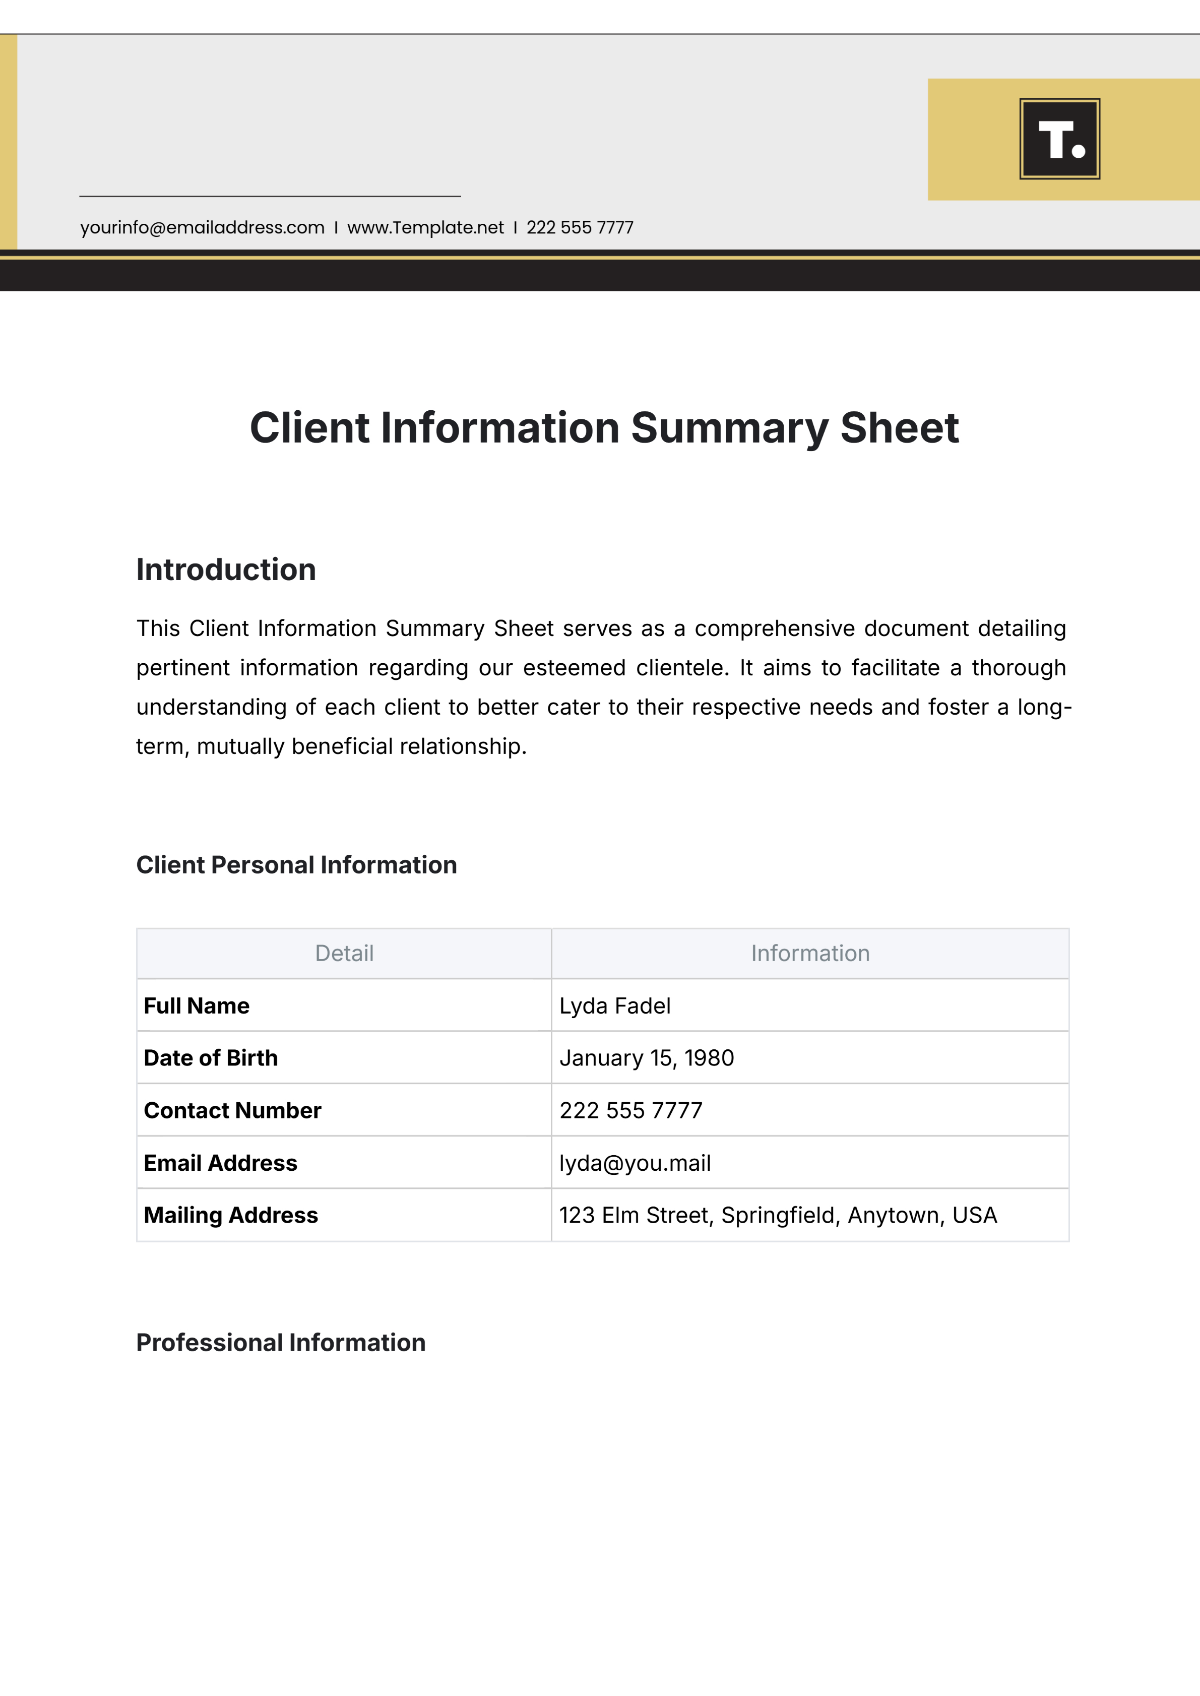
Do you remember those times when you were a student, a client, a professor, or a sales professional? Do you recall making tabular sets of data (put in a column and rows) and analyzed their consistencies or discrepancies? Well, you're basically making a summary sheet! As defined by the accounting dictionaries, a summary sheet is a bookkeeping formal document of the sums of economic transactions such as sales and cost, or the average of the sums of the educational records like the students' data such as grades, scores, etc. In that sense, a summary sheet, therefore, is meant to show the relationship between two identical data sets.
How to Create a Summary Sheet
Especially when you wish to make a record of the transactions of your economic activities—say, an industrial project—monitoring bank-related transactions, monitoring construction, a summary of all these is very essential in order to keep track of the cash flow. For you to learn more about creating a sample sheet, read more below and follow these steps.
1. Mind Your Branding
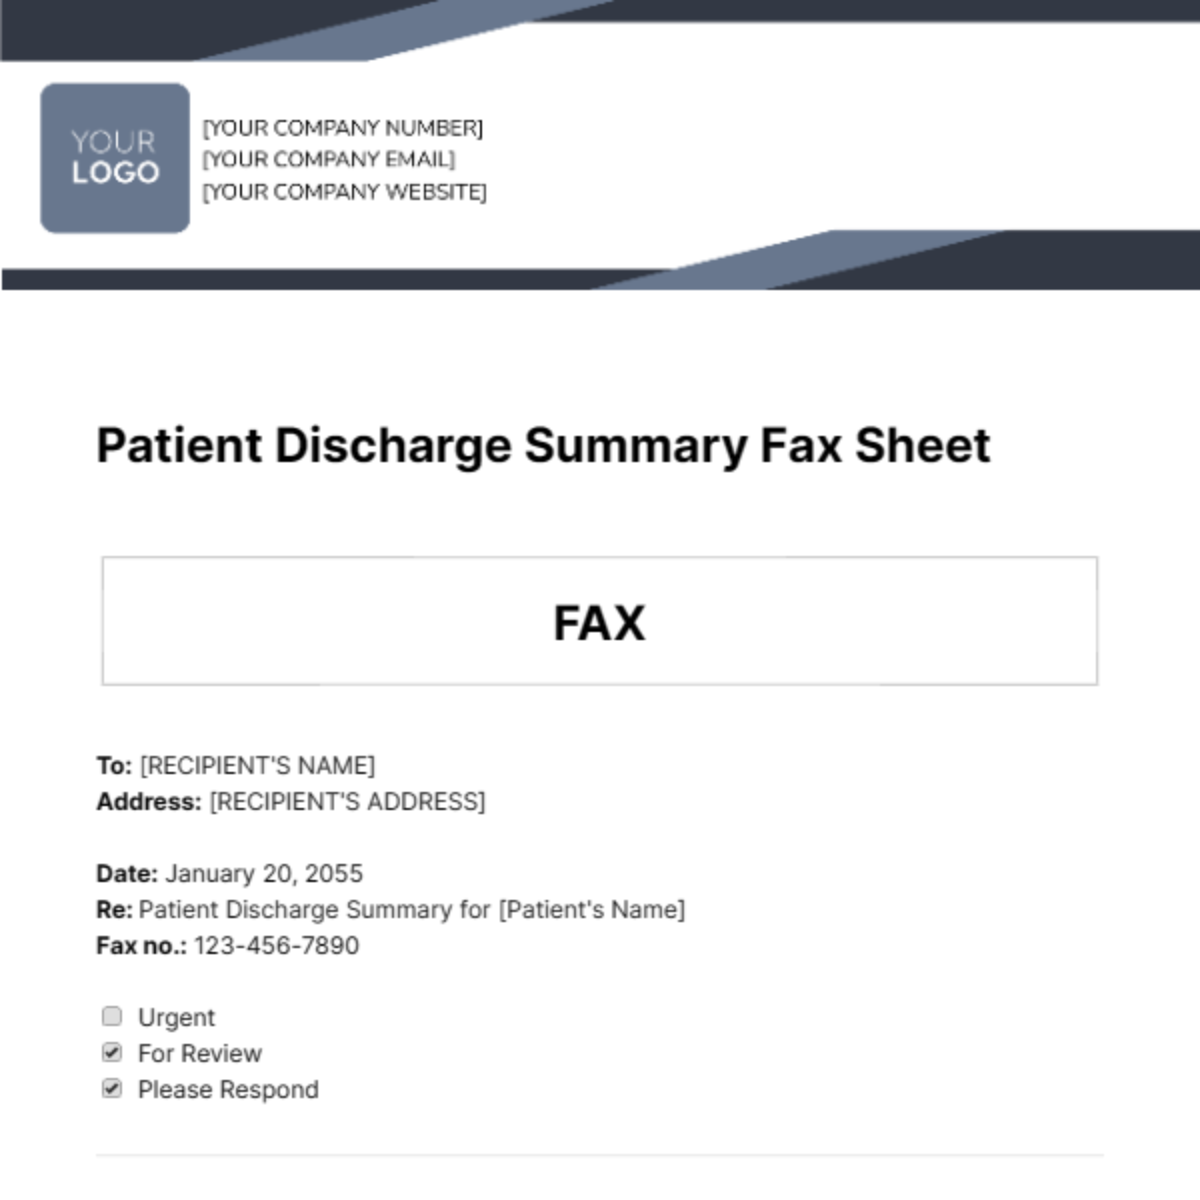
Since a summary sheet or a summary report is a tabular presentation of identical sets of data sent to a client or a student, it's still important to ensure your brand is promoted especially when you're in the business field. Business is business, whatever your client's reaction on the data summary reported, make sure they will still rely on you as they were able to grasp your brand. Thus, make sure you highlight your simple logo and brand on your summary report's heading.
2. Hand Down the Details
In addition to filling in your brand, especially when making an industrial project, make sure to include the project title, work location, the client name, and you as the project manager. Then, line up your columns and rows, and sort your data out. Make sure they're situated accordingly in your simple sheet.
3. Make an Interpretation
After you have laid out all the details of your data, begin interpreting the data. One of the best ways to guide you in consolidating your data, making an interpretation will help you out. In addition to interpretations, you are also making sure you prevent your summary report from any grammatical and data errors because you are not just glancing every cell but also checking out for some necessary revisions.
4. Choose a Bookkeeping Software
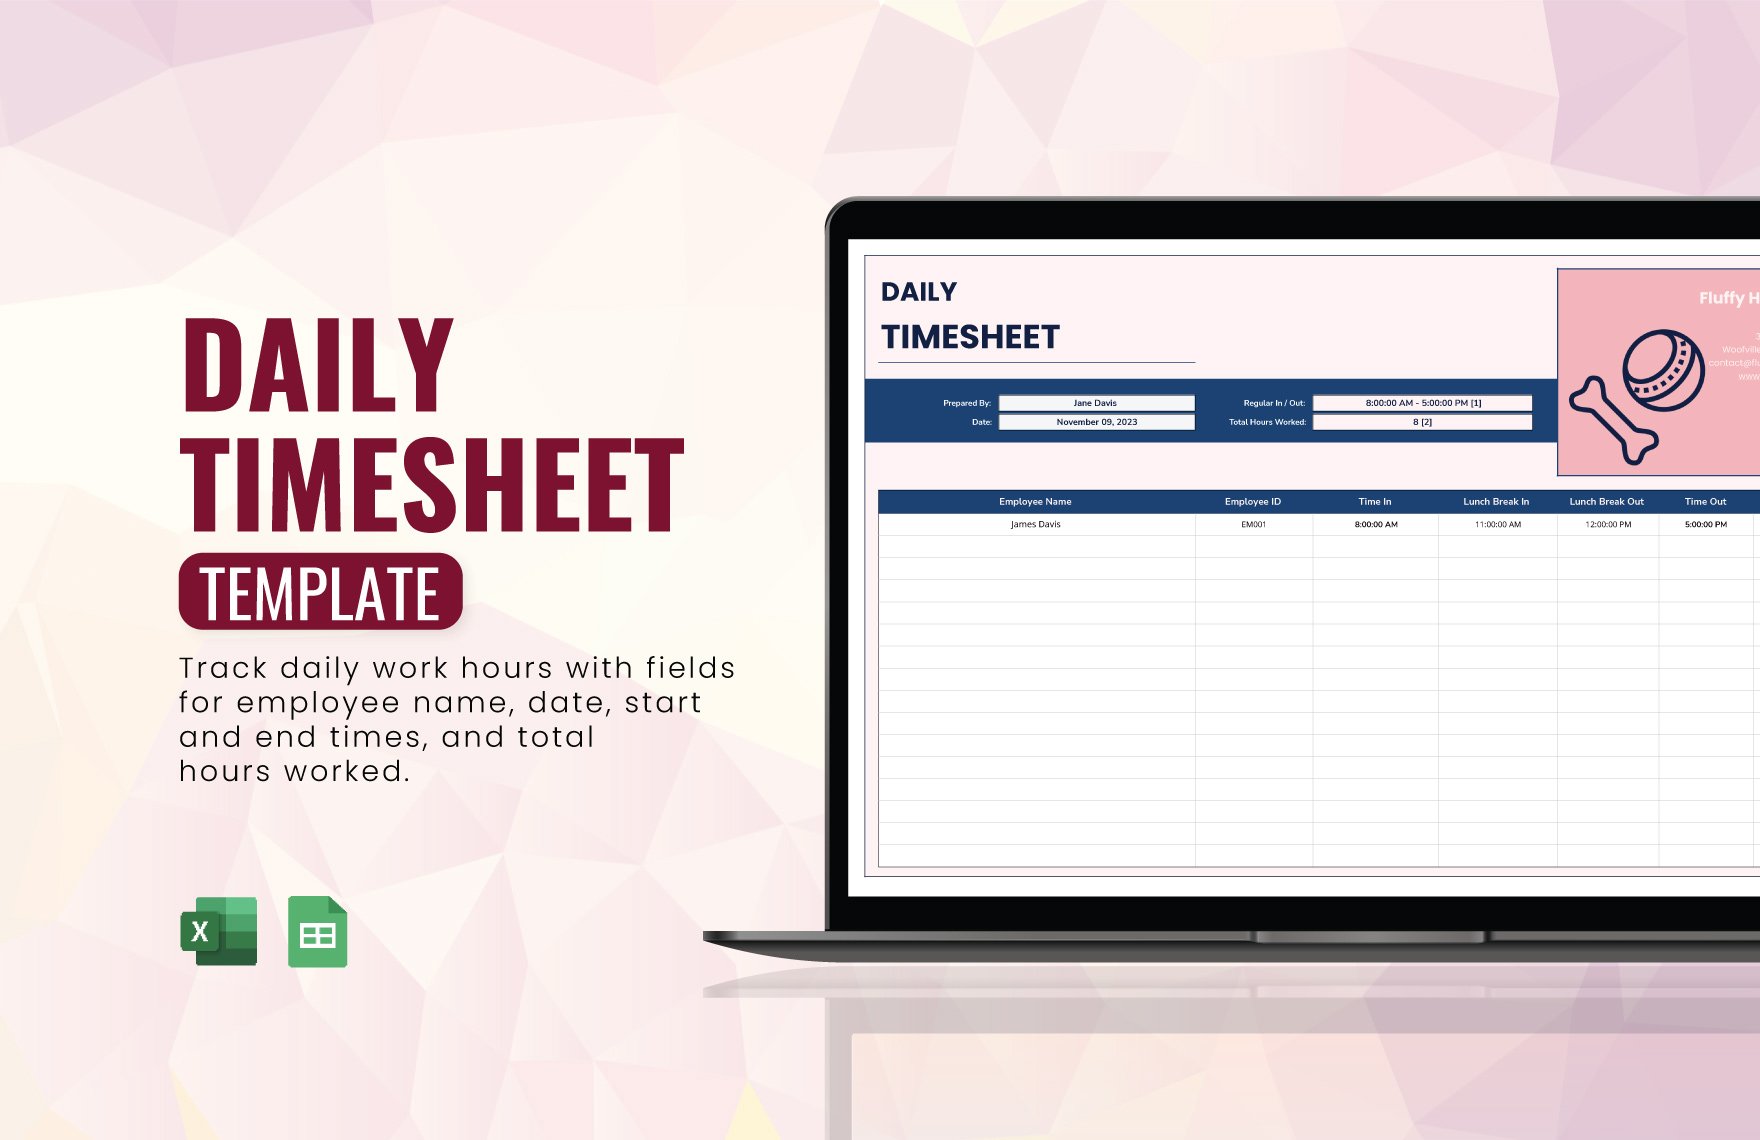
Although there are a lot of file formats you can choose to create a summary report worksheet, I personally suggest you use Microsoft Excel because the blank sheet itself is completely appropriate and convenient for you when you make a summary sheet. Actually, you can also choose Microsoft Word—you just have to check on the table settings then you're good to go and create the cells for your data set.
5. Indicate the Total
Since you have different sets of identical data, provide the total of each set. Similar to making an interpretation, you will also have to make an analysis of the differences or similarities each set of data has. Since this is a summary report, the total of every data set is the most important and the very first to catch the attention of any reader.
