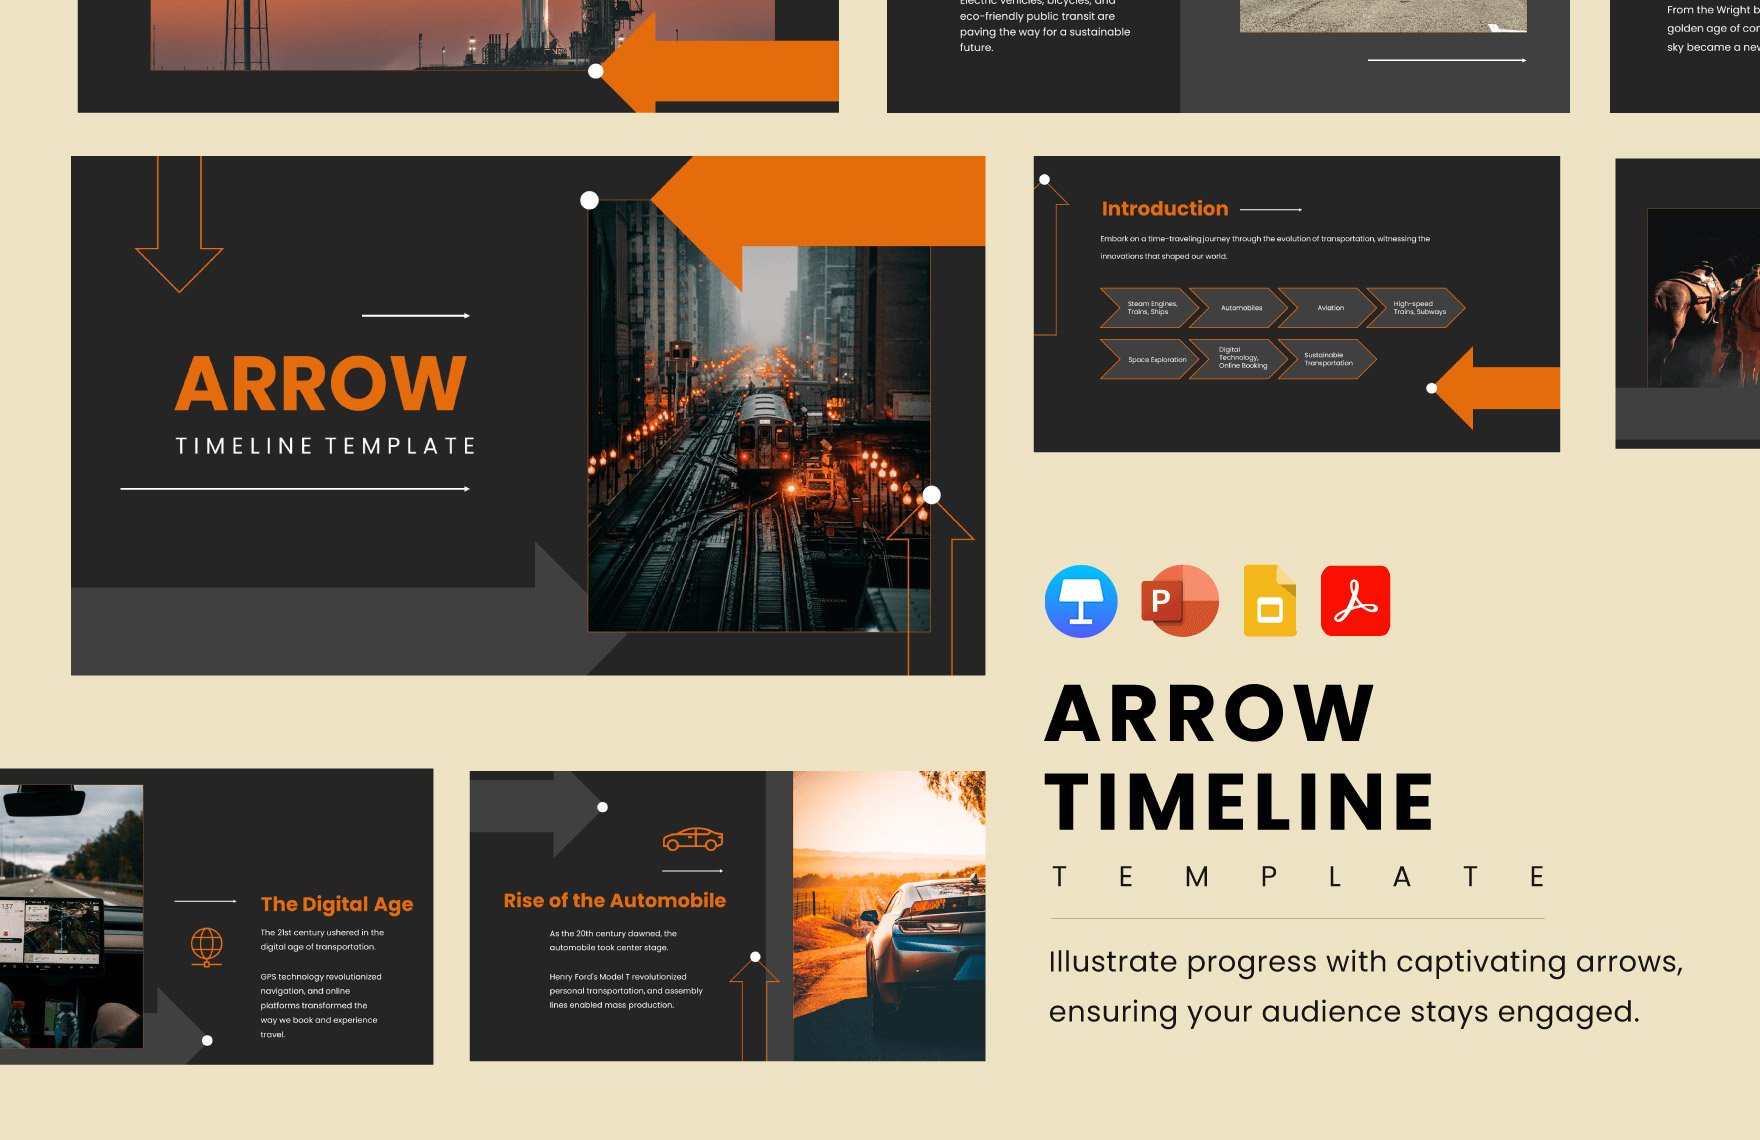
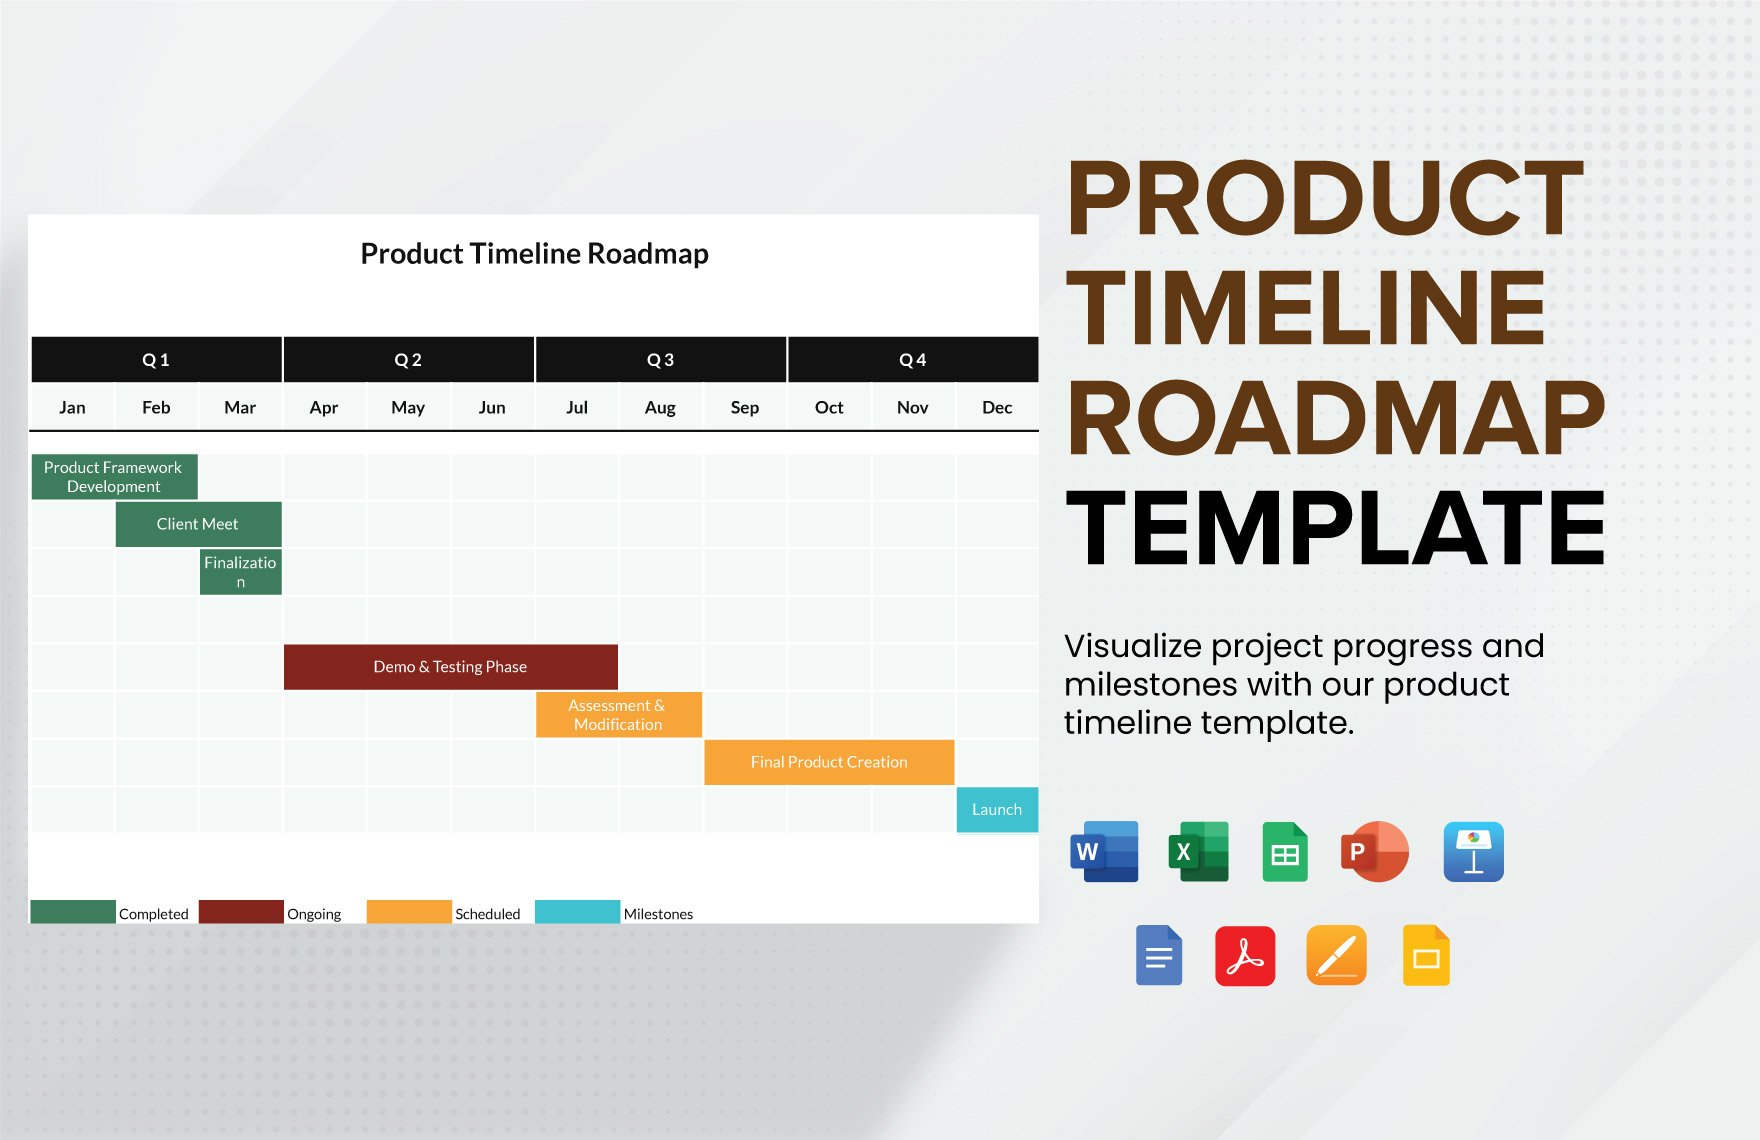
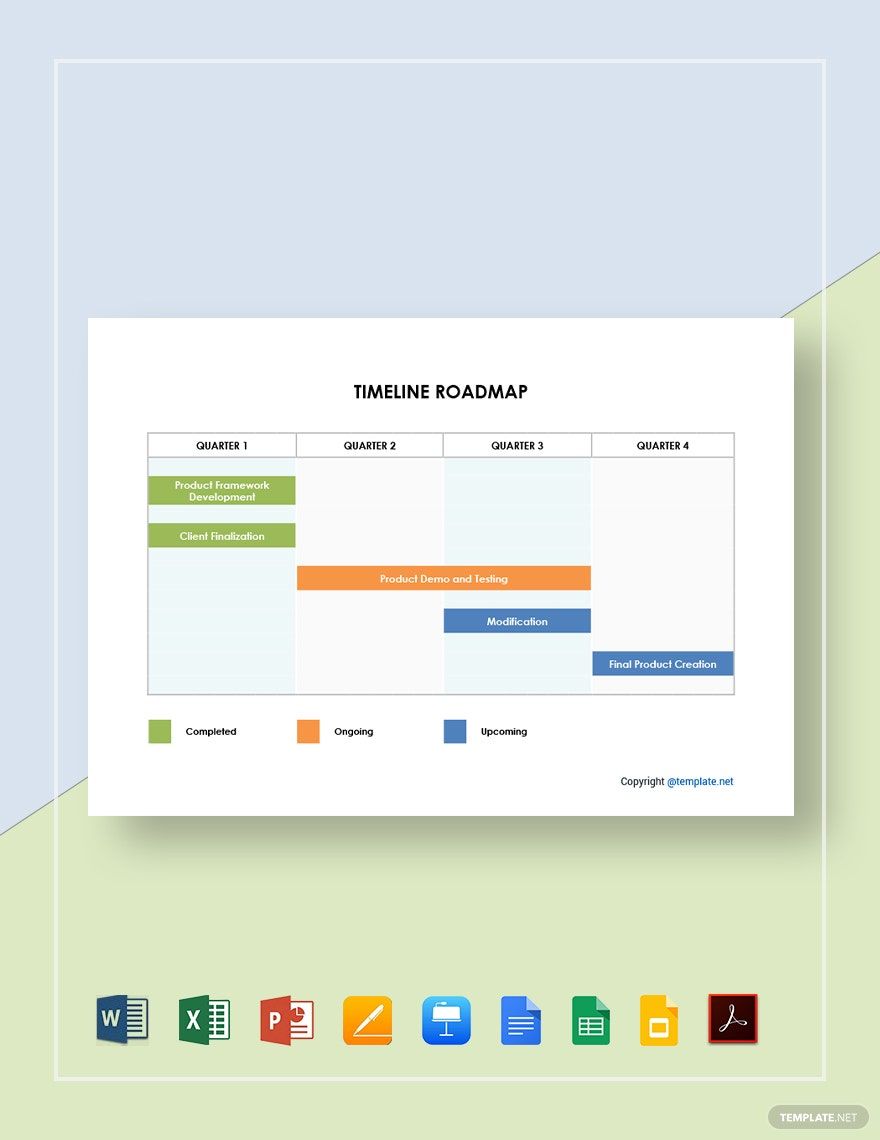
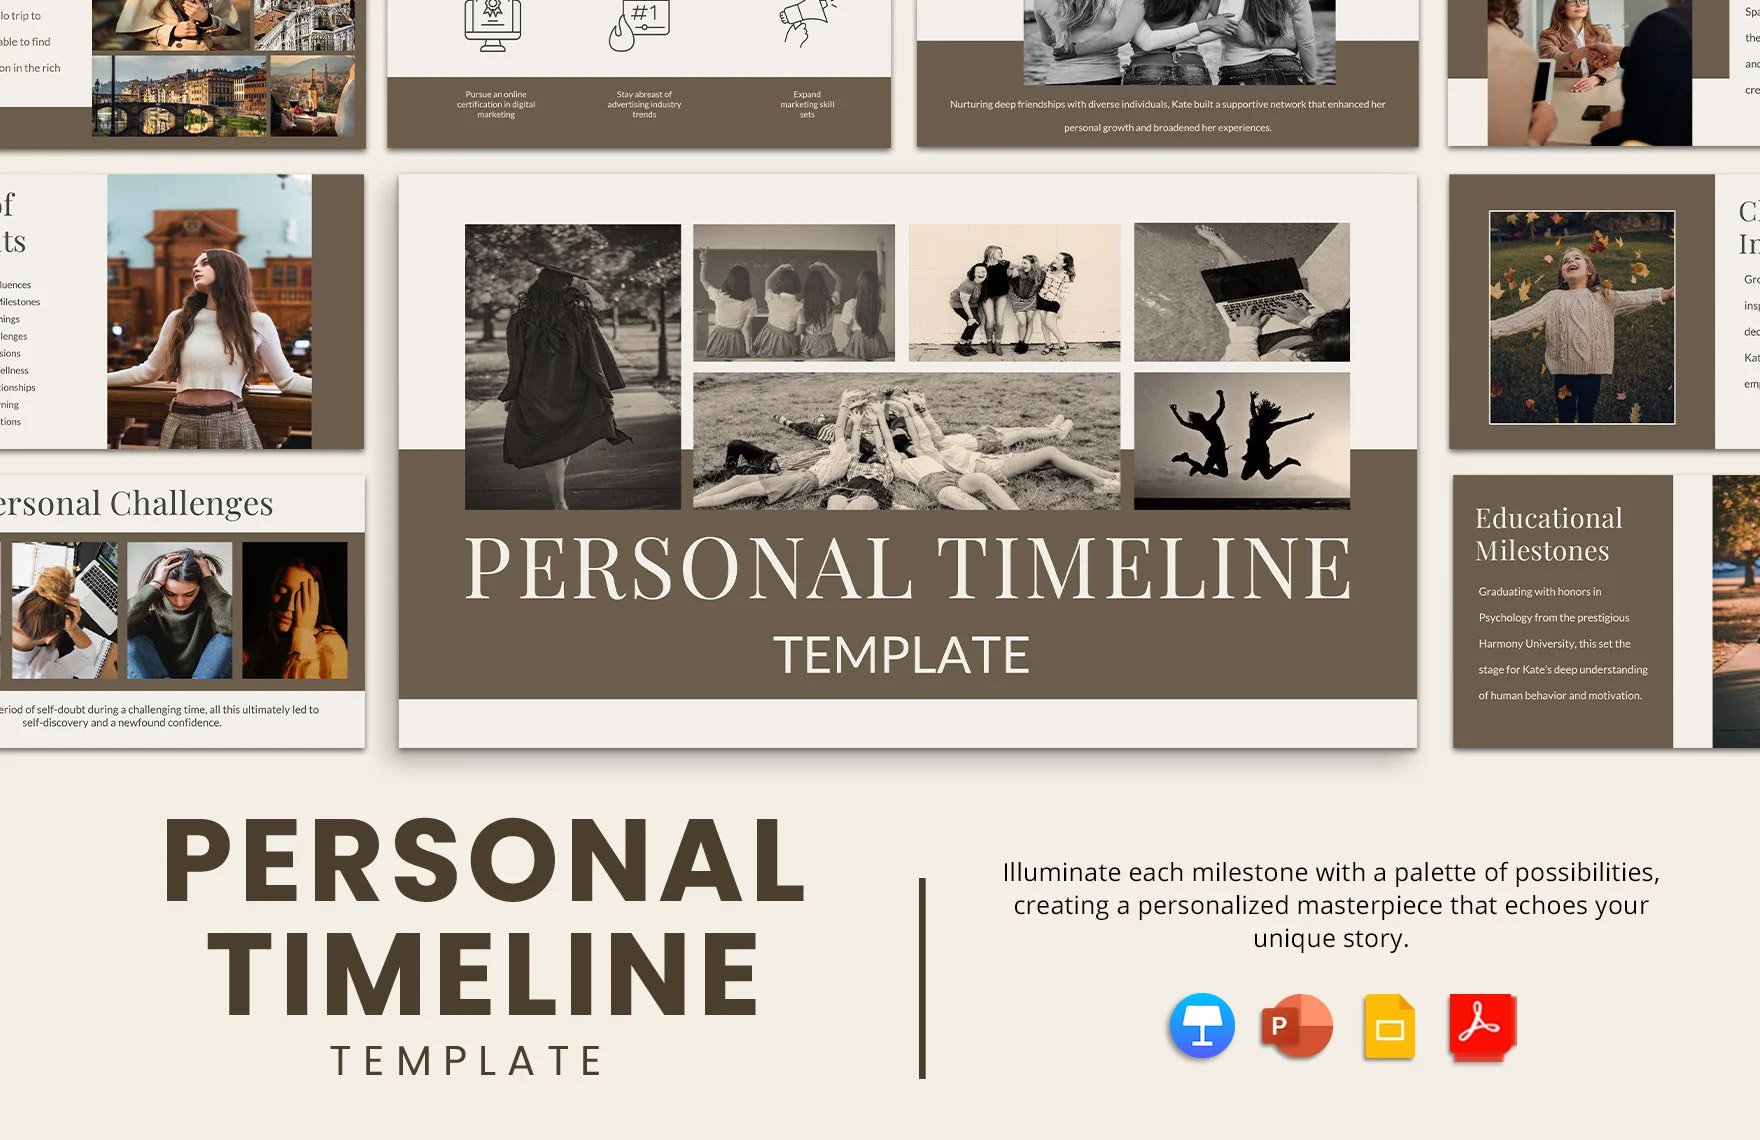
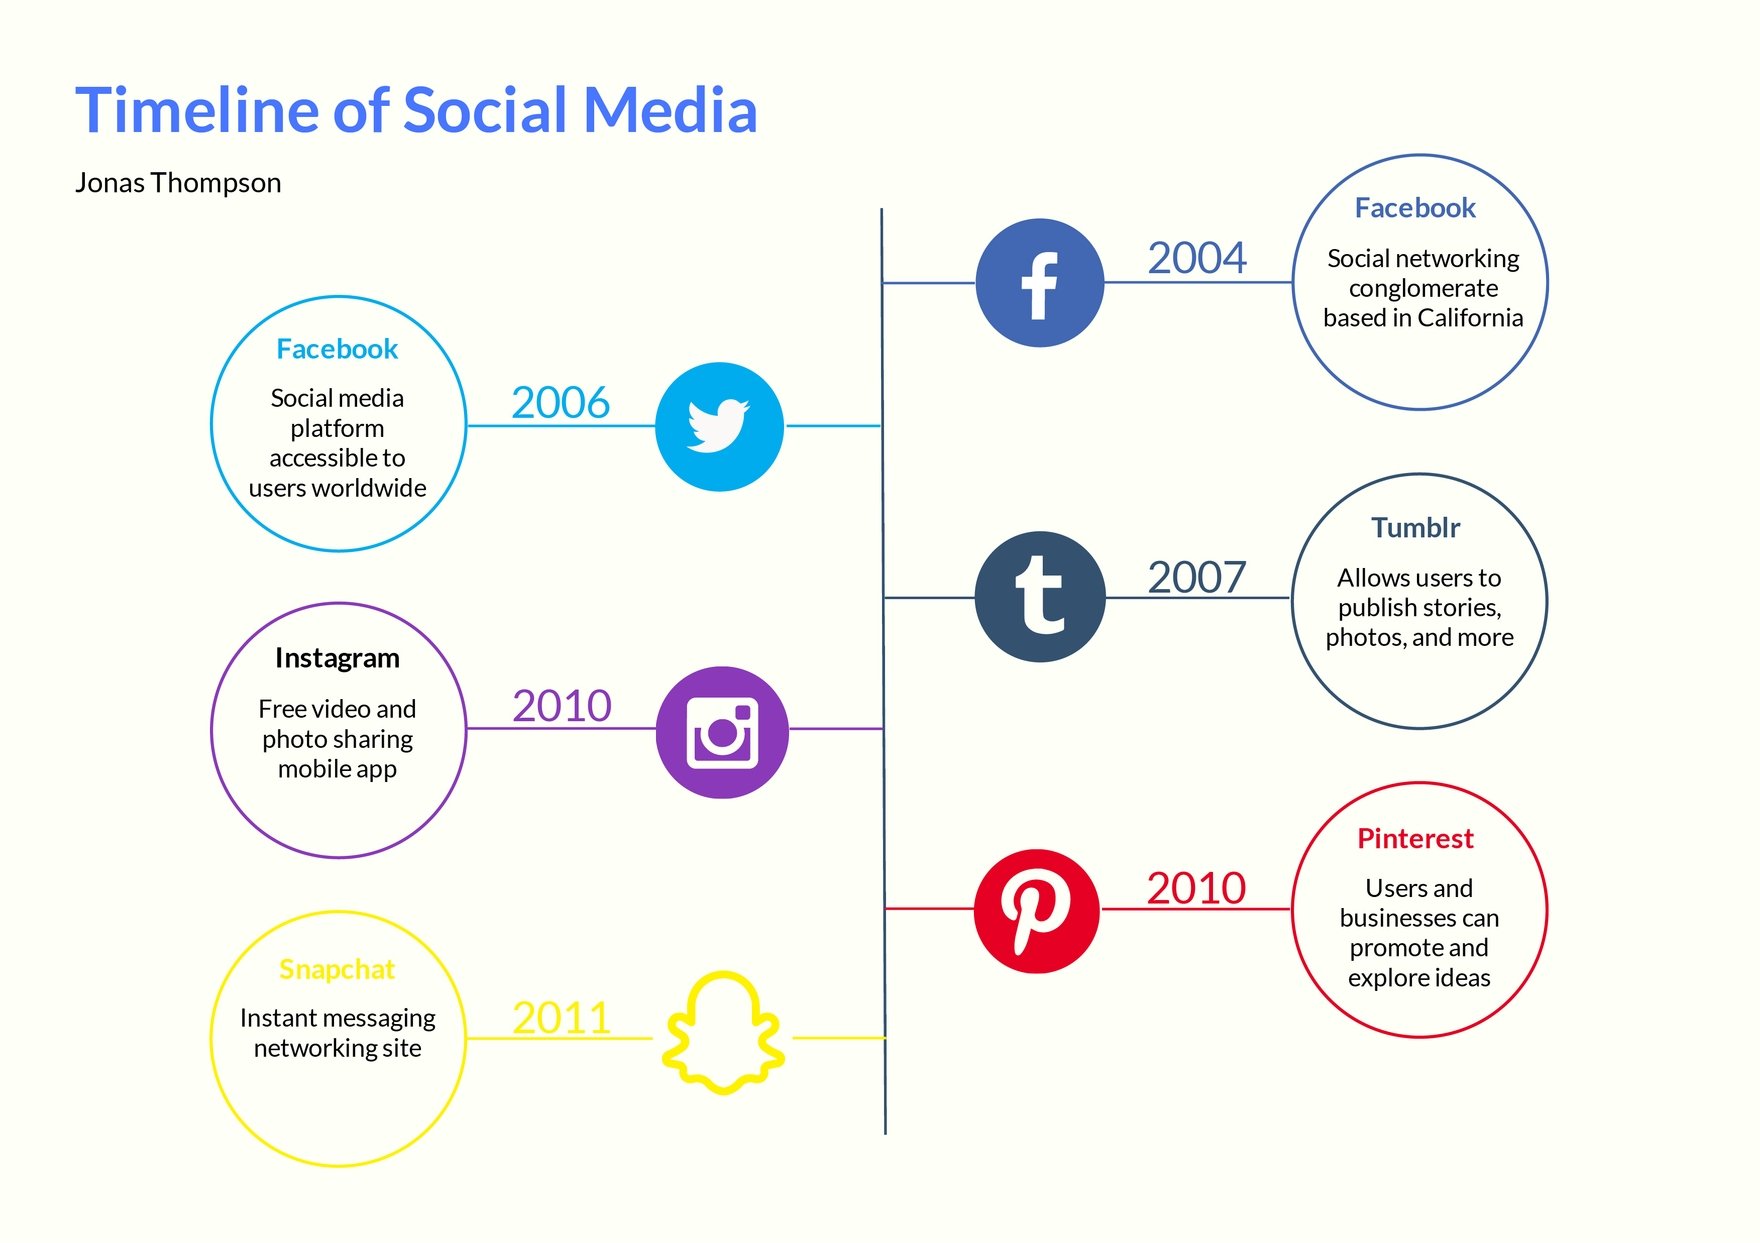
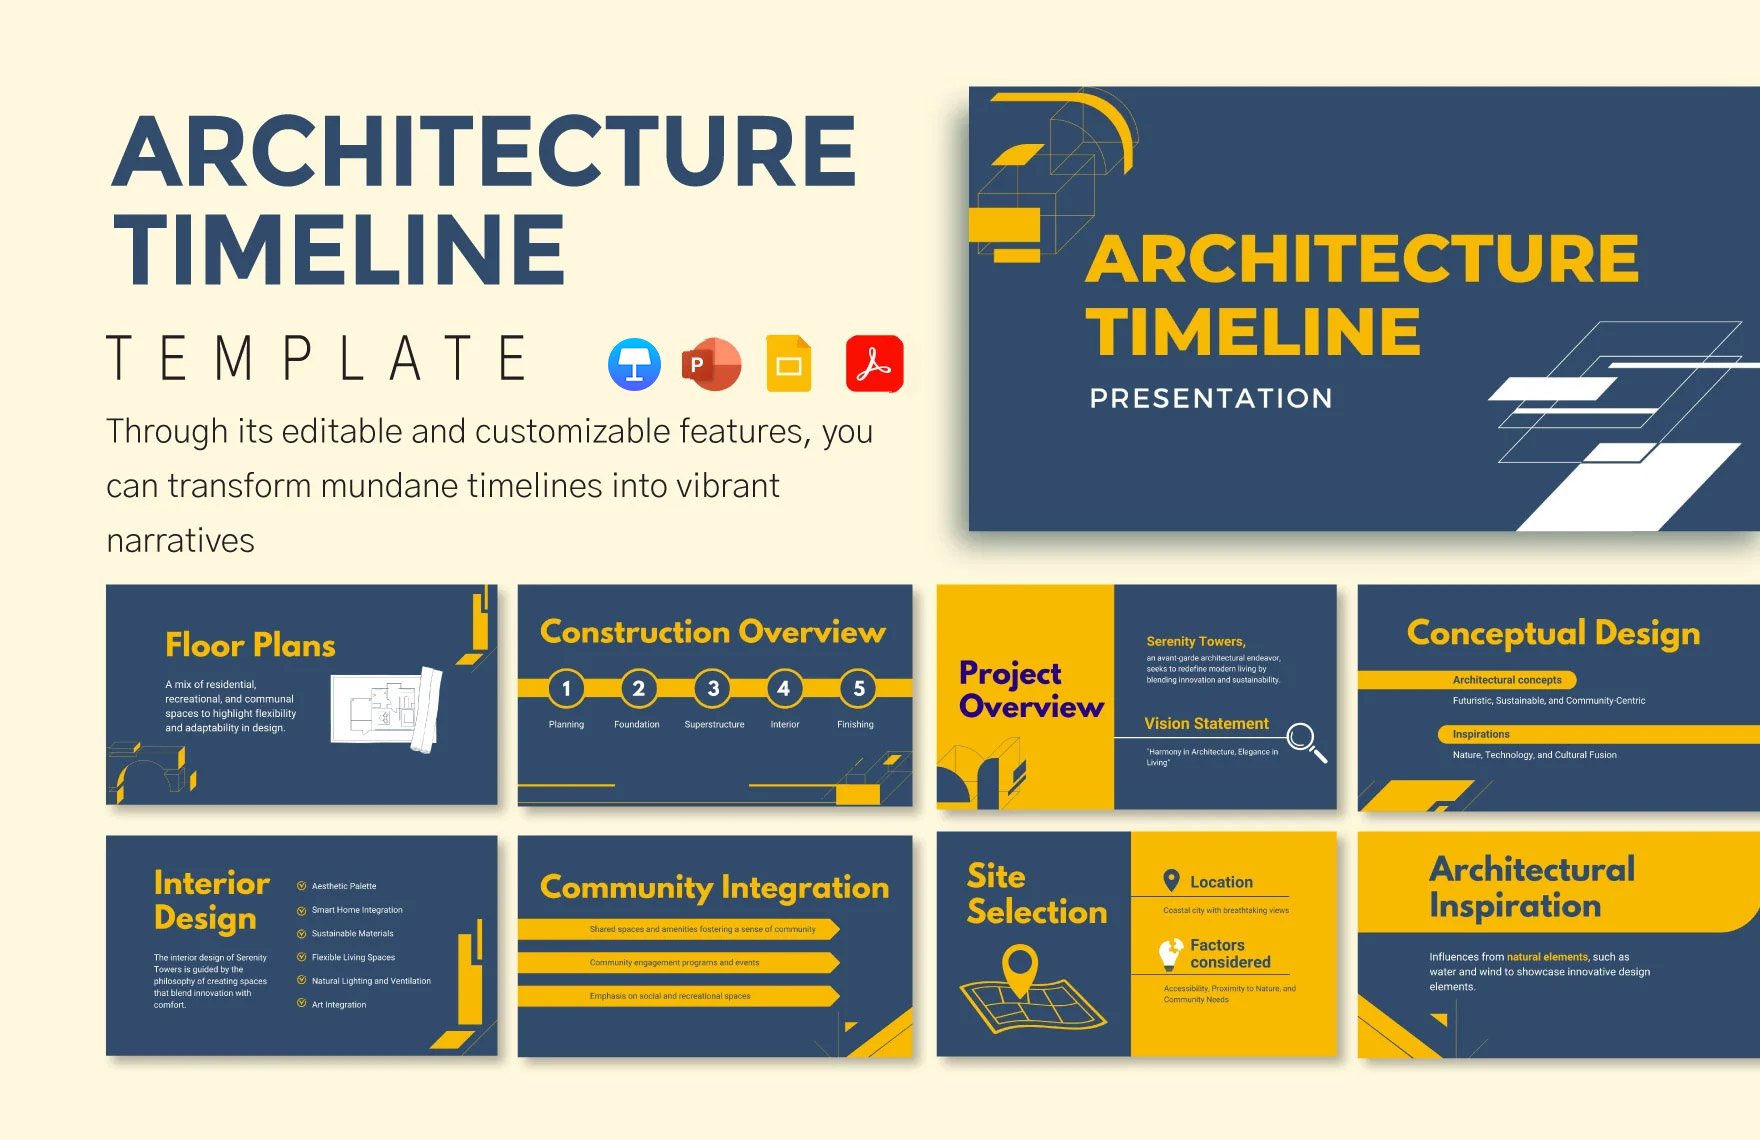
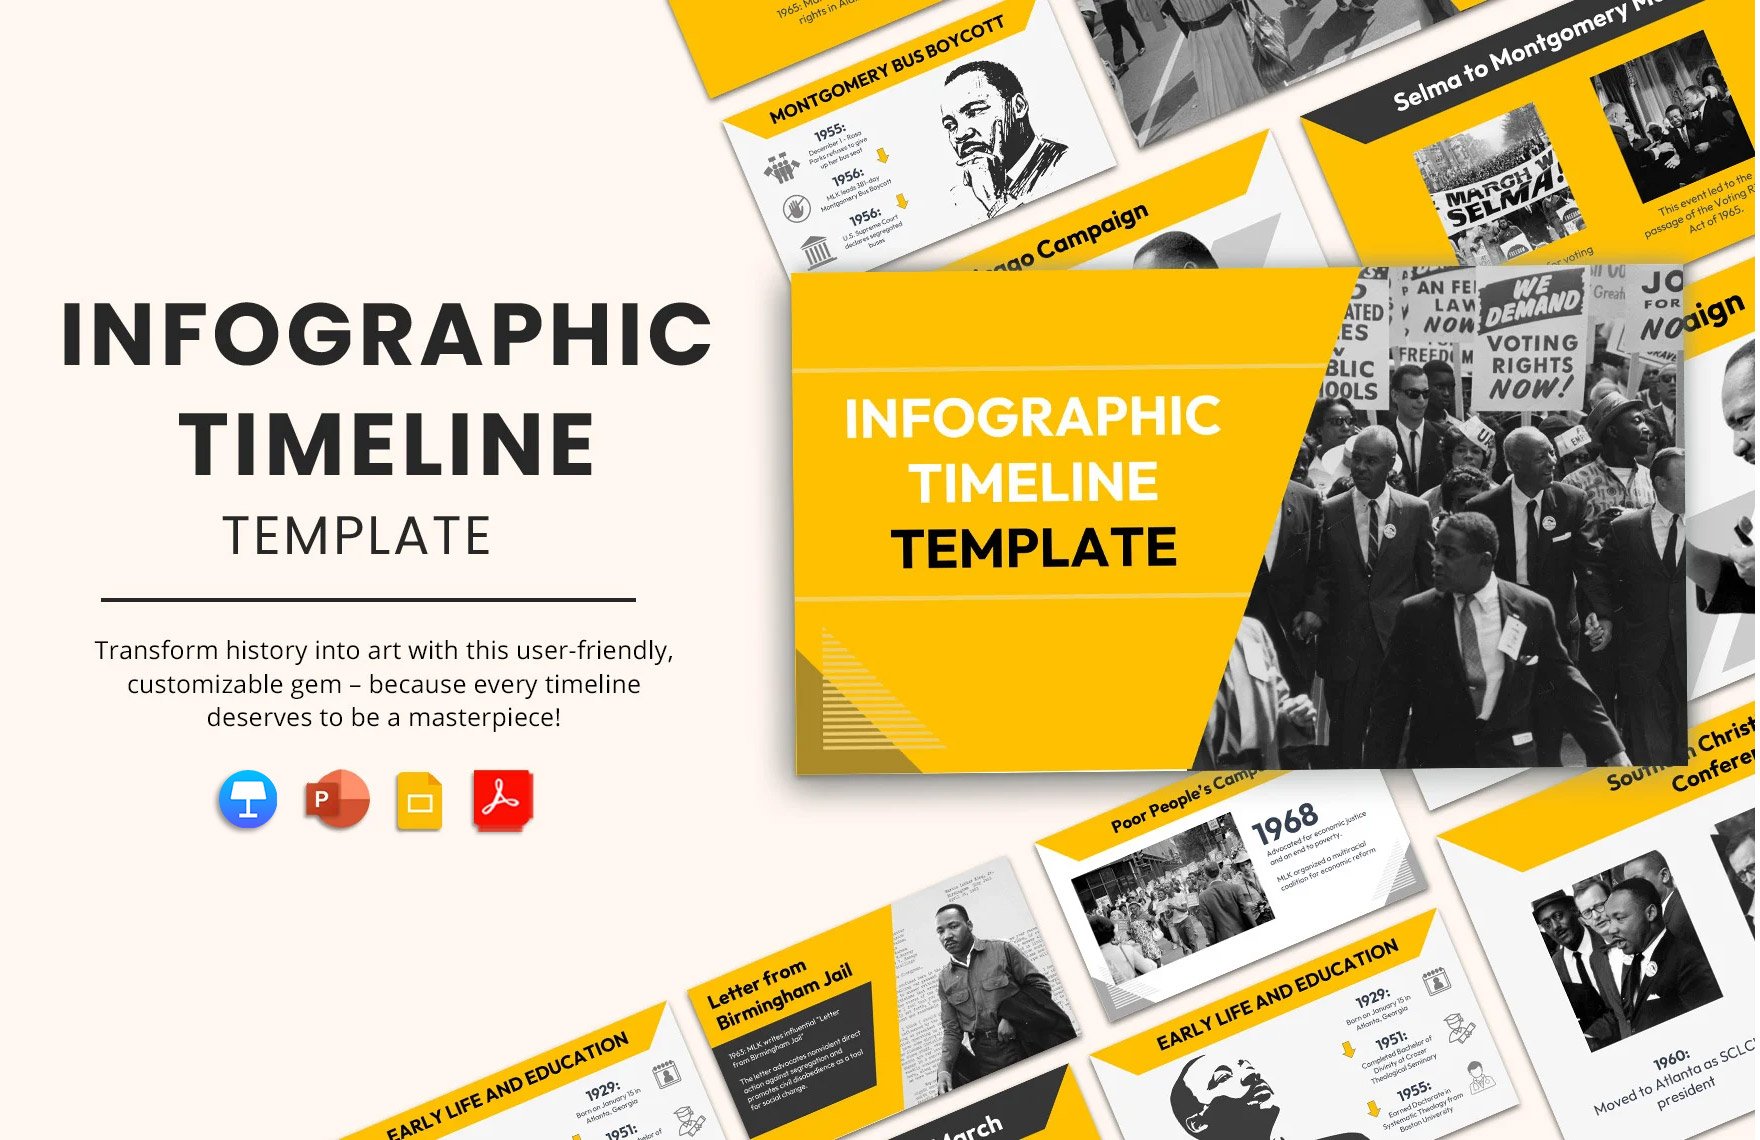
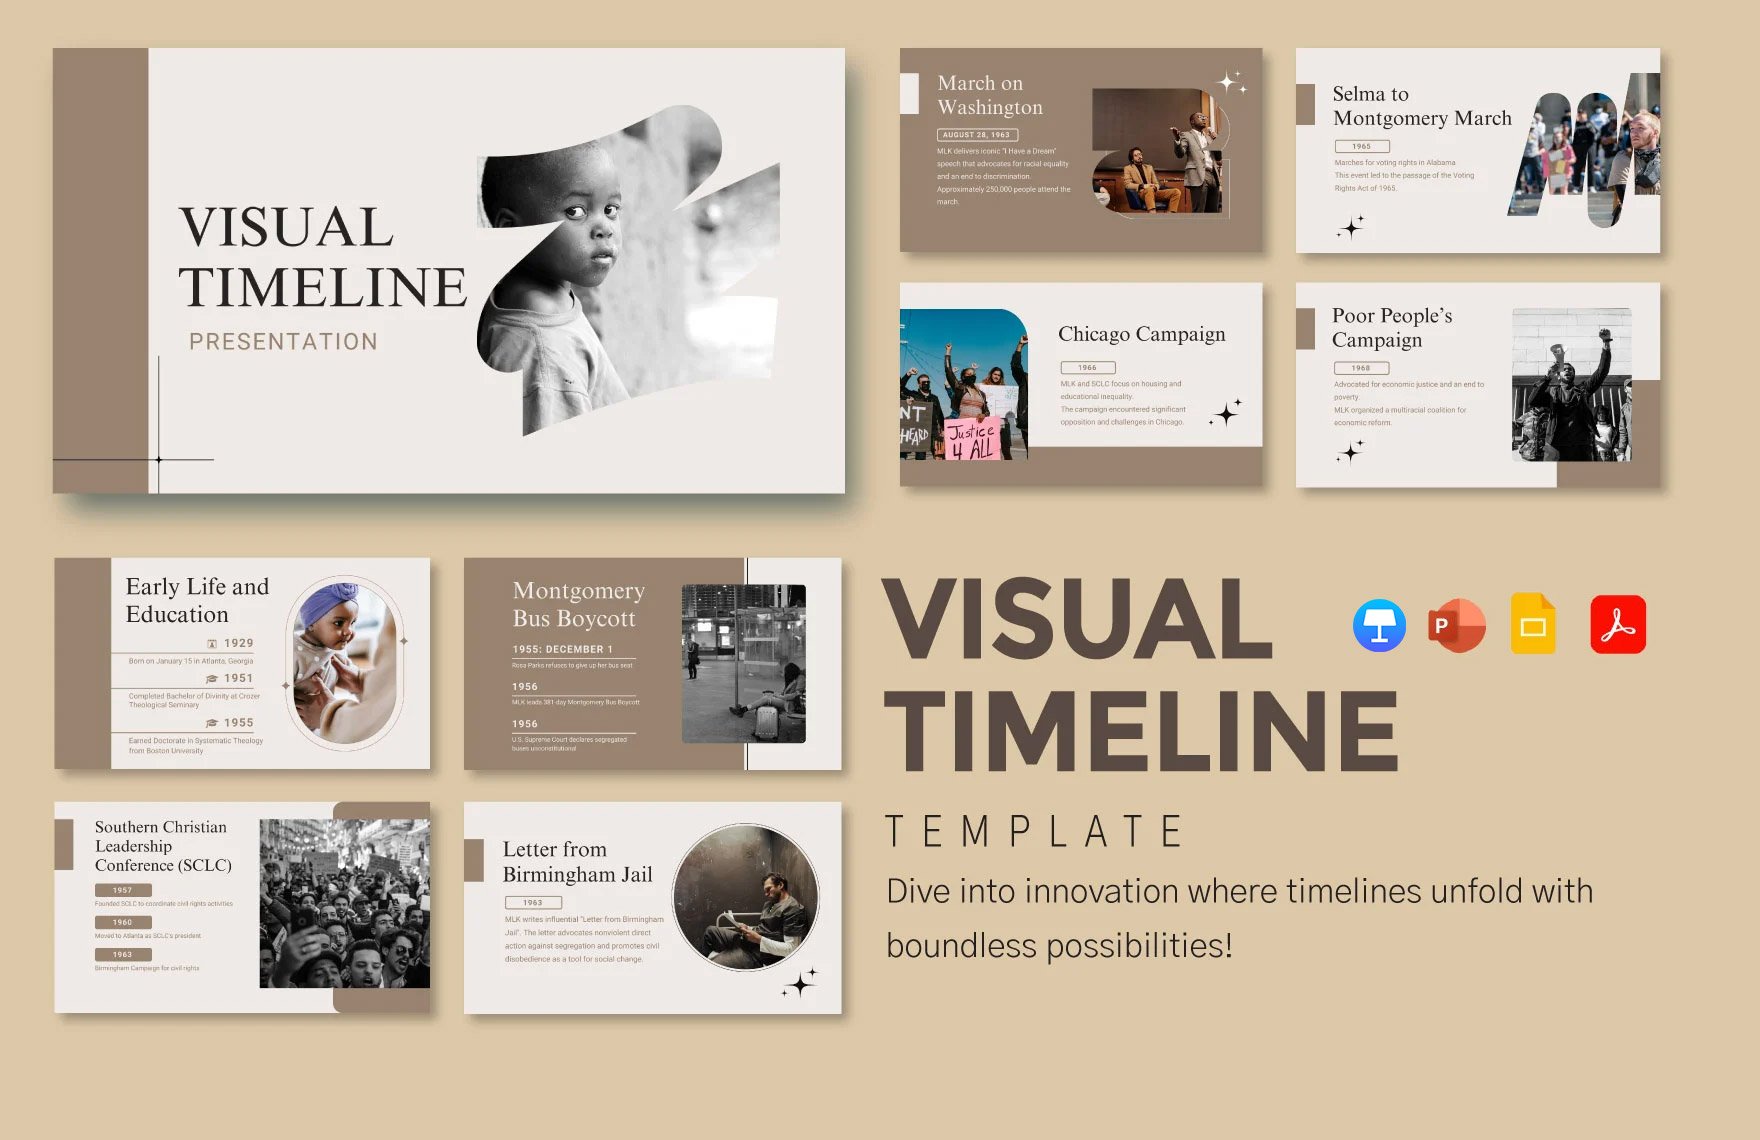
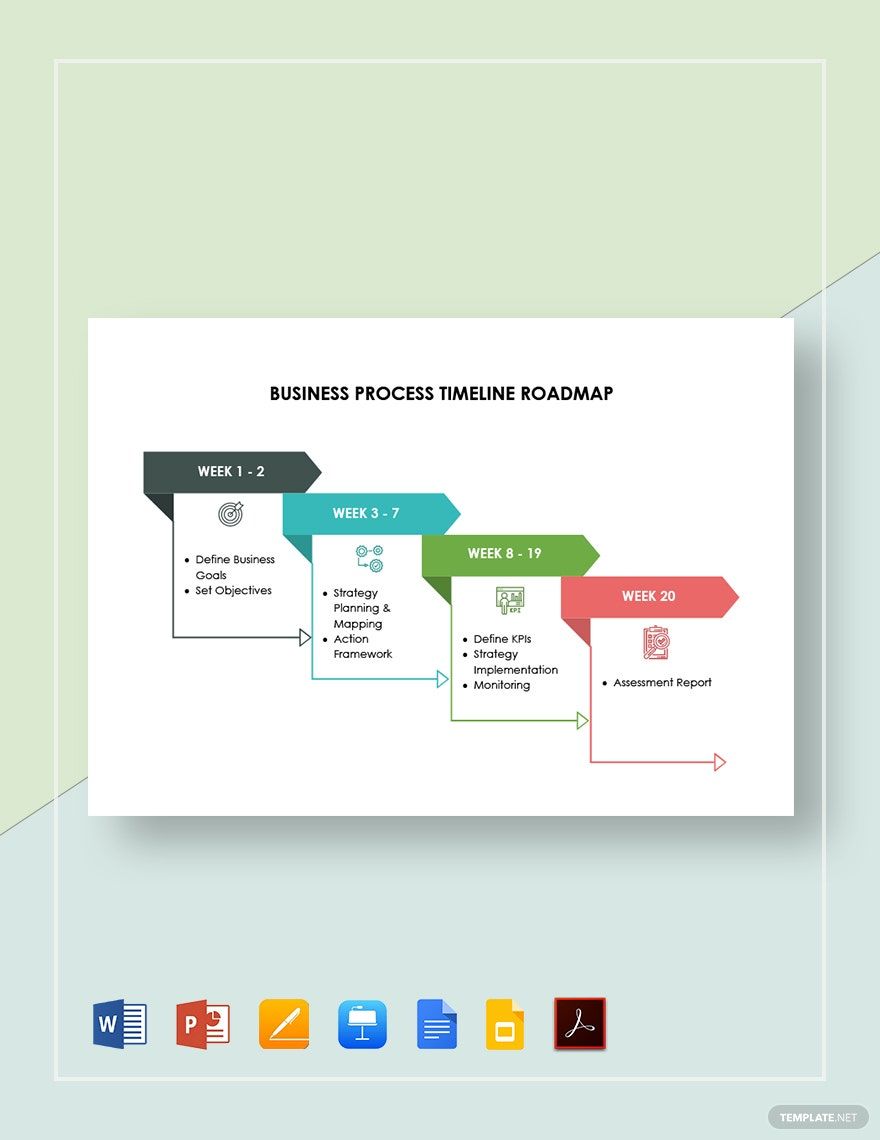
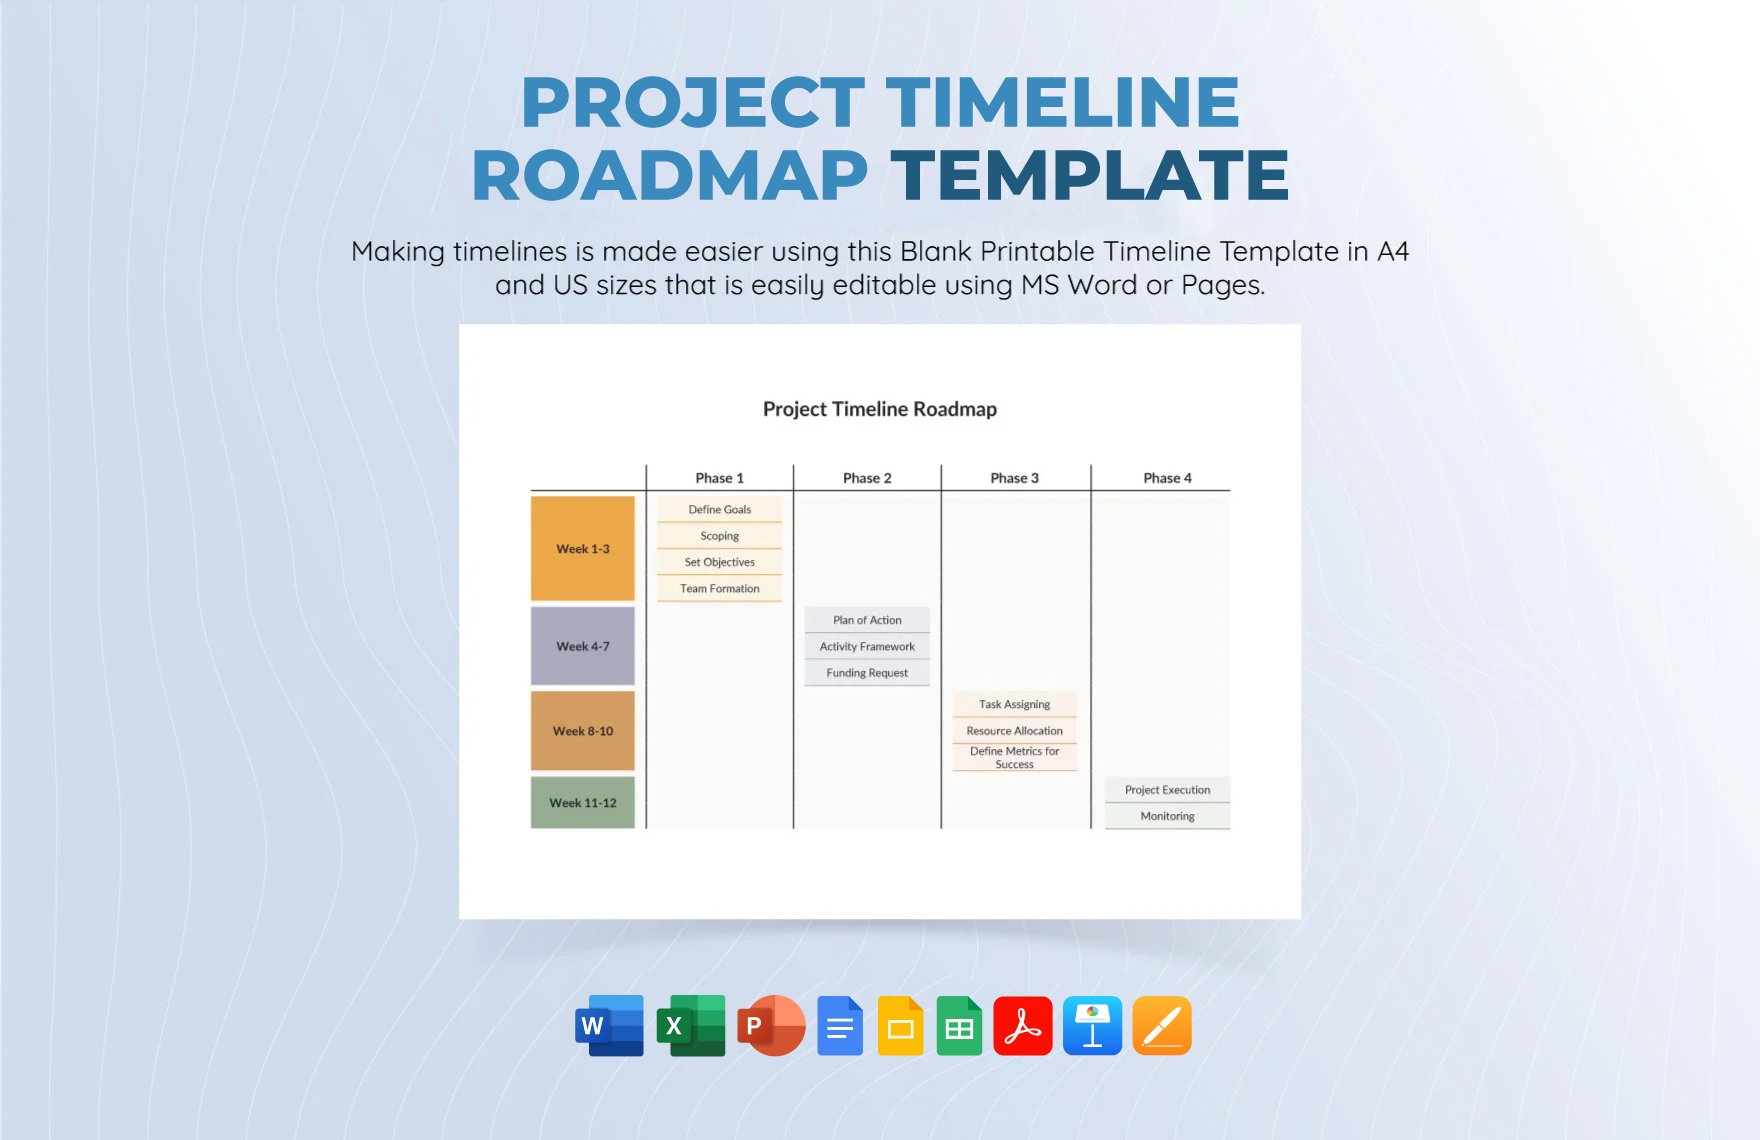
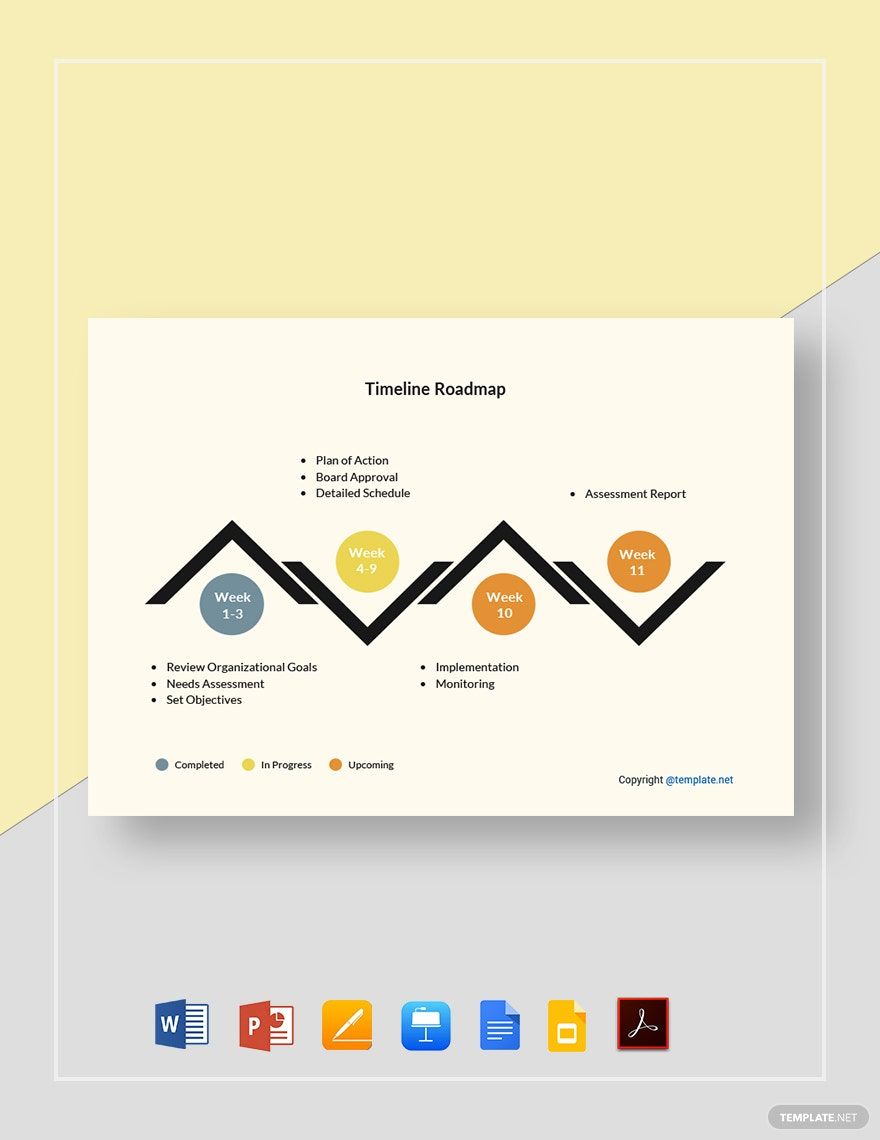
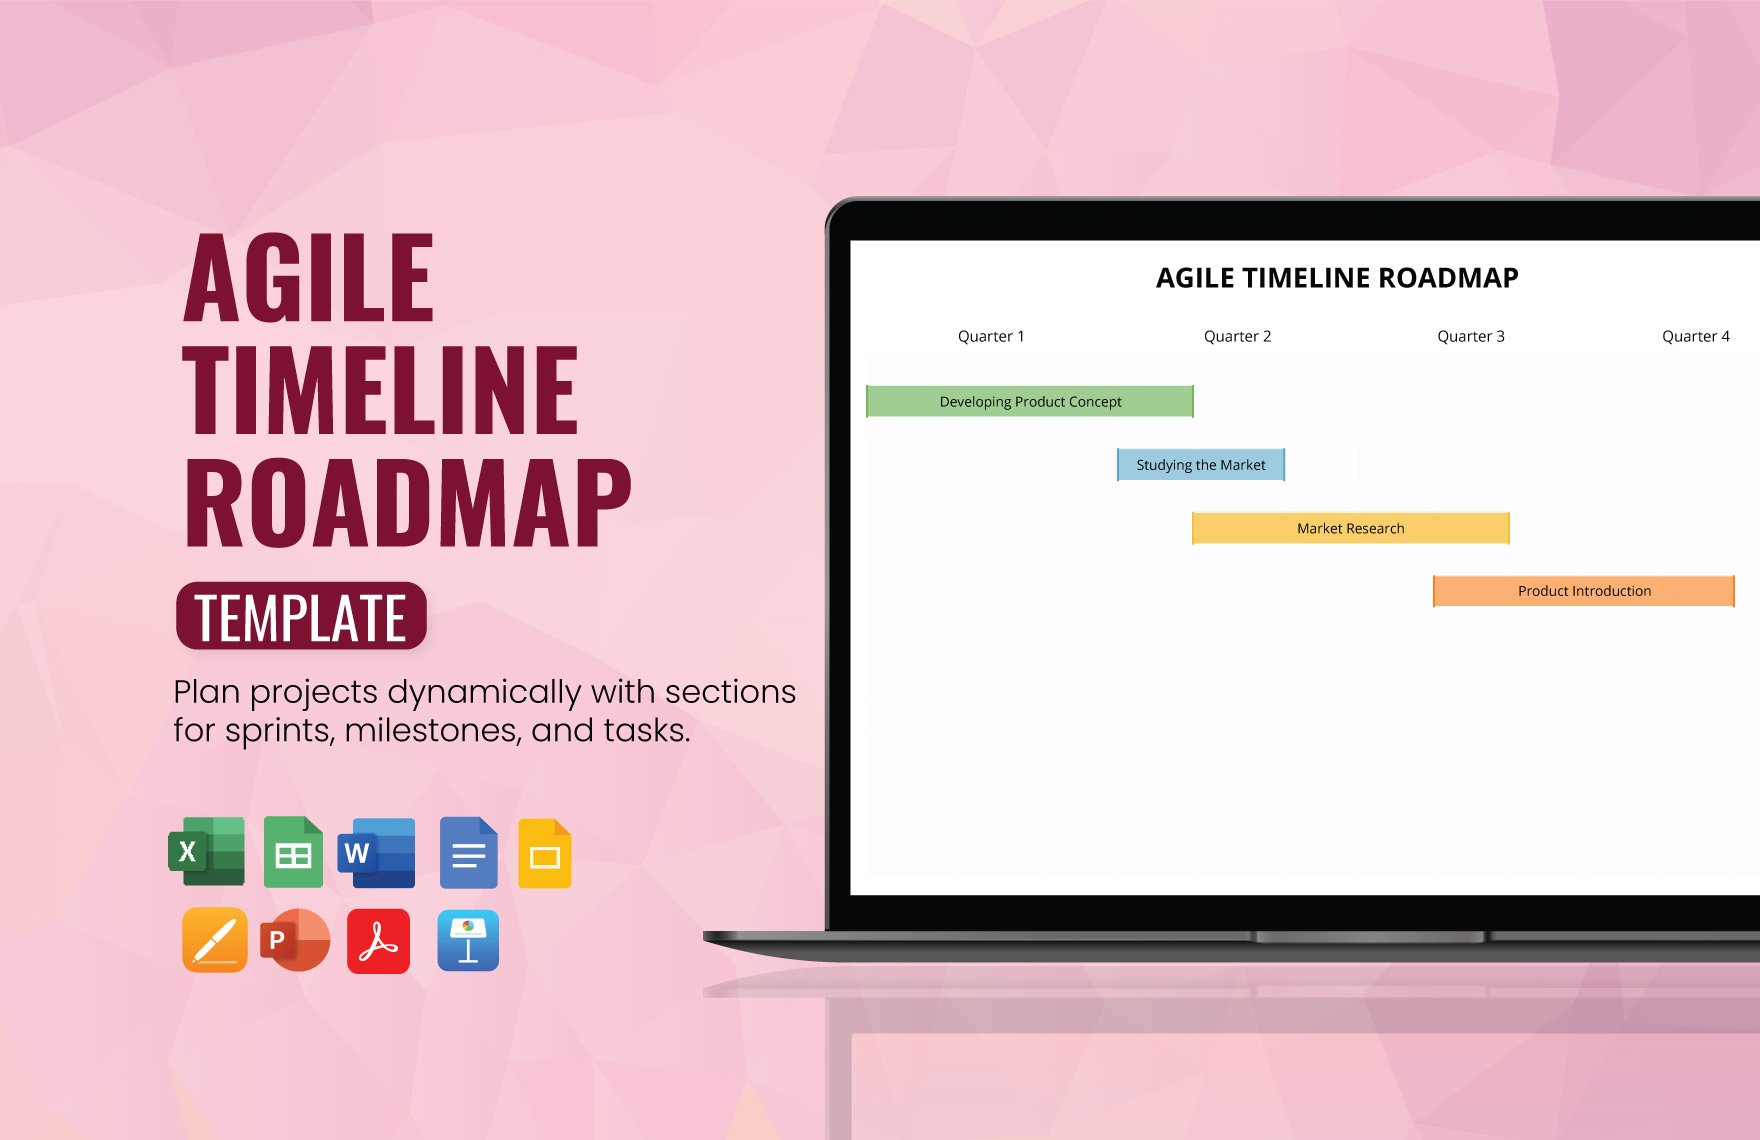
Timelines are quite useful in presentations, providing audiences with visual chronological representations. Are you looking for easily editable materials to help you prepare? Then look no further than our professional Timeline Templates! With our content, you can conveniently make charts about your project history, campaign progress, and more. Plus, our samples are compatible with Google Slides to accommodate users favoring Google apps. Download today—Quickly design a horizontal or vertical chart that conveys times and dates in a simple fashion!
How to Make a Timeline in Google Slides
In an article from Chron (a business publication), they explain that not only does a timeline provide a clear understanding of the chronology in a project, but it also gives better insight on the subject overall. That’s why, when presenting times and dates, incorporating a timeline is imperative.
For easy and convenient timeline creation in presentations, Google Slides is an excellent application for such a task. Don’t worry if you’re not sure how to get started, as we have a few handy tips below!
1. Locate the Chart Options in Google Slides
To create a timeline diagram in your slideshow, take advantage of Google Slides’ chart creation feature. To access this feature, simply open the Insert menu and then locate the Chart option. From there, several chart types are shown in the list. If you prefer, there’s also an option to import a chart directly from a Google Sheets workbook.
2. Add a Bar Chart to Your Slide
The simplest way to create a timeline in your presentation is by using a horizontal bar chart. Insert one by selecting the Bar option in the Chart menu. This instantly adds a fresh chart into the slide, filled with placeholder information. Resize the chart by selecting it and click-dragging the blue side-handles, while repositioning is done by click-dragging the chart itself.
3. Customize Your Timeline Chart’s Information
To edit your chart data, select the chart itself before opening the menu in its upper-right corner. Choose Open Source and a new Google Sheets tab will open, containing your diagram. Edit the numerical values through the premade table in the sheet. To finetune the chart, double-click and use the Chart Editor window that appears.
4. Include Supplementary Information in Your Timeline Slide
Use the premade text boxes to title and describe your timeline chart—add new text boxes by going to Insert > Text Box. When creating the title, go with something simple, like “Printable Art Progress” or “Technology Advancement History.”
And with that, your timeline is ready! Now you can prepare a creative yet efficient timeline chart using Google Slides!


