YEAR-END PERFORMANCE SUMMARY
Executive Summary
The Executive Summary serves as an overview of [Your Company Name]'s performance throughout the year 2050. This section encapsulates key financial metrics, operational achievements, market positioning, and future goals. The aim is to provide stakeholders with a snapshot that is both comprehensive and easily digestible. Overall, the company has shown remarkable growth in revenue, customer retention, and market presence. Challenges were met with innovative solutions, and the outlook for the next year appears promising.
Financial Performance
Revenue
In 2050, [Your Company Name] generated a total revenue of $10 million, marking a 15% increase compared to the previous year. This growth can be attributed to the successful launch of new products and expansion into new markets. The revenue streams were diversified, with 60% coming from product sales and 40% from service contracts.
Expenses
The total expenses for the year amounted to $6 million. The breakdown is as follows:
Employee Salaries: $2.5 million
Marketing: $1.5 million
Operational Costs: $2 million
The increase in expenses is in line with the company's growth and expansion strategies.
Profit Margin
The profit margin for the year stood at 40%, a 2% increase from the previous year. This improvement signifies effective cost management and a strong revenue model.
Financial Performance Table
Metrics | 2049 | 2050 | % Change |
Revenue | $8.7M | $10M | +15% |
Expenses | $5.4M | $6M | +11% |
Profit Margin | 38% | 40% | +2% |
Operational Metrics
Customer Retention
The customer retention rate for the year was 90%, a 5% increase from the previous year. This improvement is a result of enhanced customer service and the introduction of loyalty programs.
Employee Performance
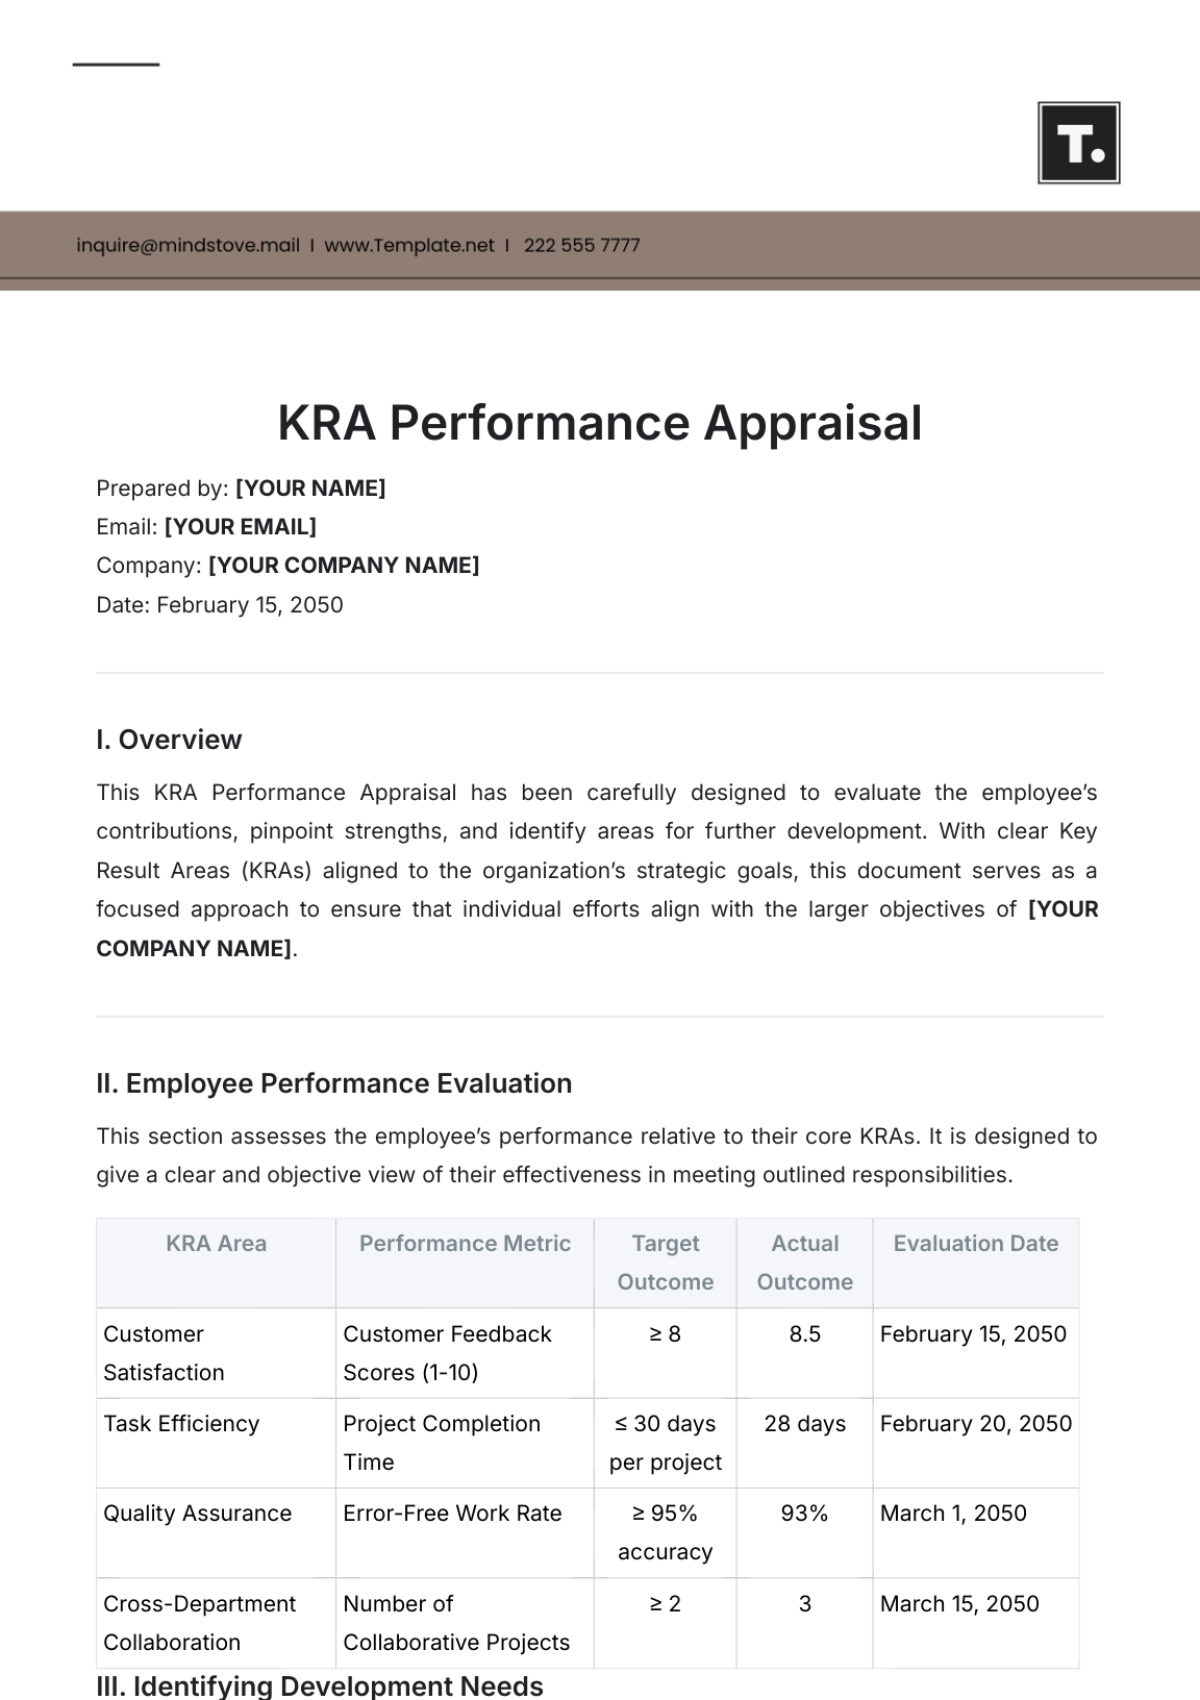
Employee performance was evaluated through quarterly reviews, which showed a general improvement in productivity and job satisfaction. The average performance score was 8.5 out of 10, compared to last year's 8.0.
Productivity
Productivity metrics showed an 8% increase, as measured by the output per employee. This can be attributed to the implementation of new productivity tools and training programs.
Market Analysis
Competitor Analysis
Our main competitors have shown similar growth patterns, but [Your Company Name] has gained a competitive edge through innovation and customer service. Our market share increased by 3%, and customer reviews indicate a higher satisfaction rate compared to competitors.
Market Trends
The market is increasingly leaning towards sustainable and tech-driven solutions. This trend aligns well with our company's vision and product offerings, positioning us favorably for future growth.
Goals and Objectives
Achieved Goals
The company successfully achieved several key objectives this year:
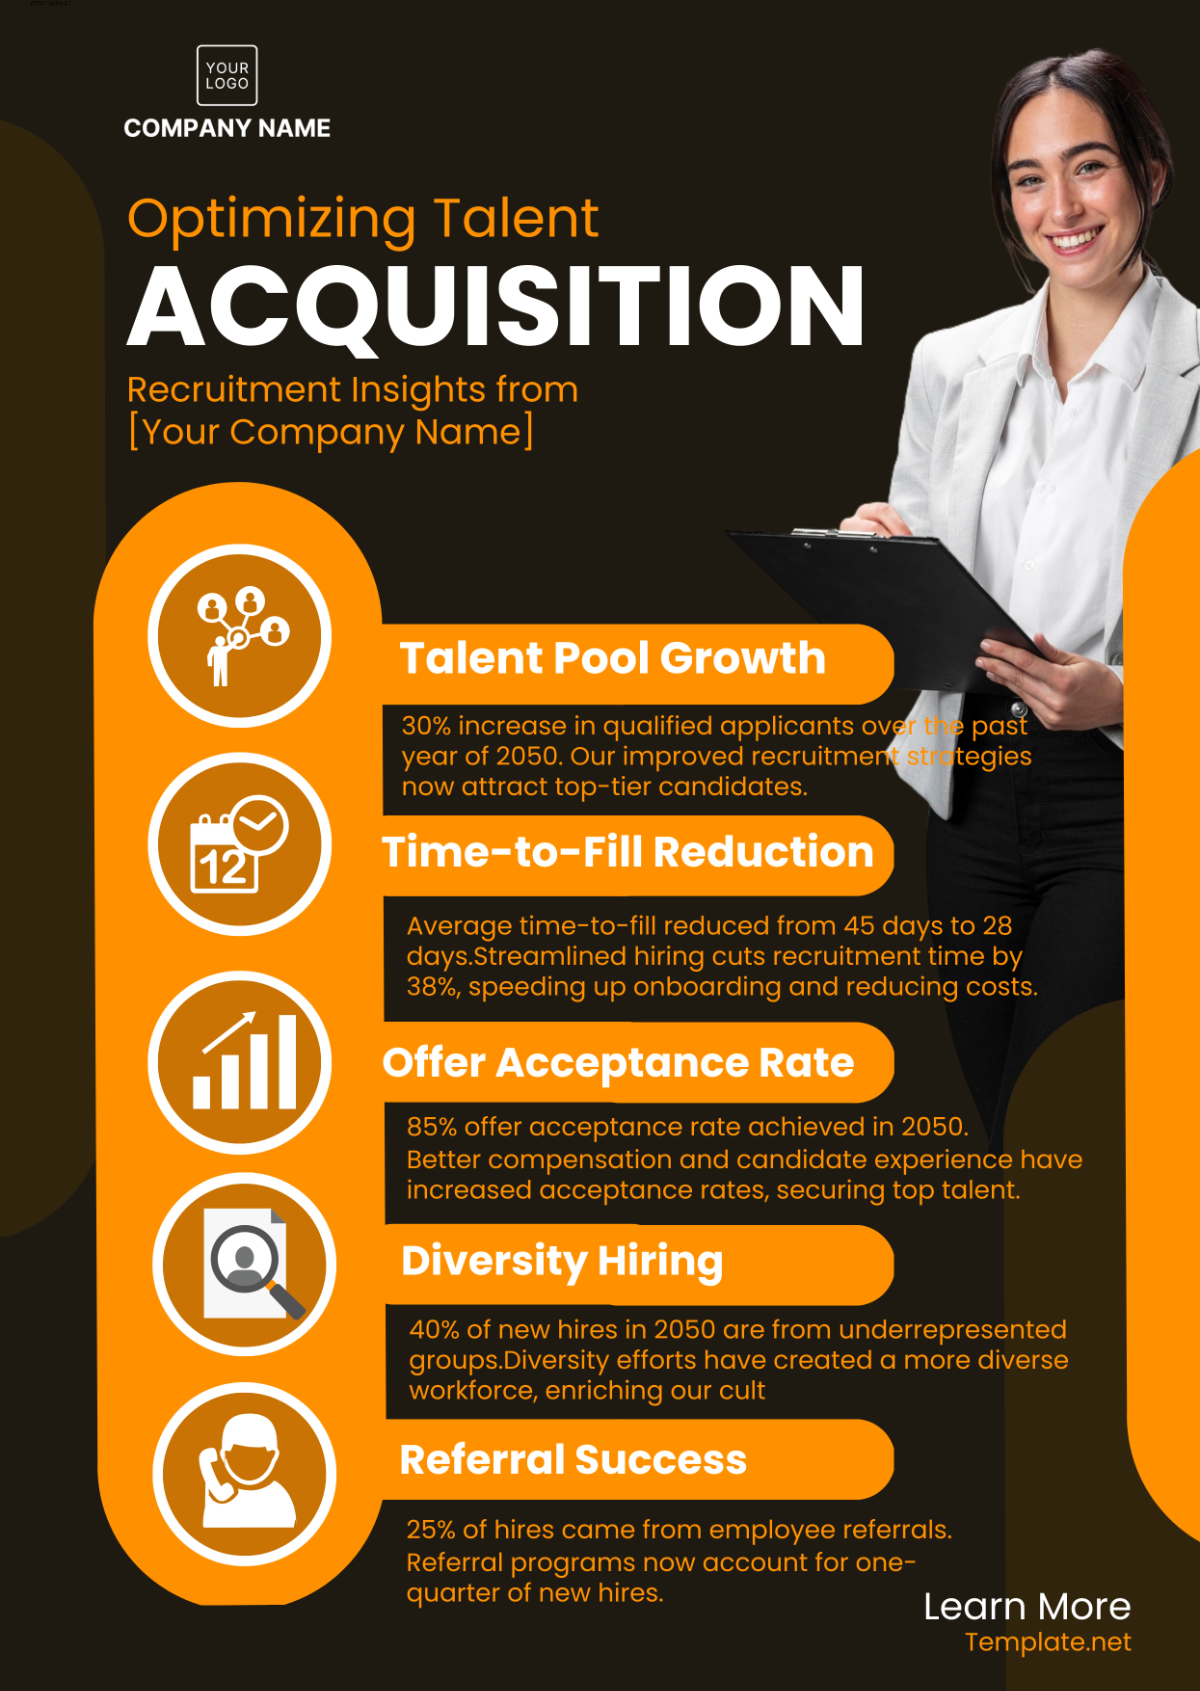
Launched two new products that contributed to 20% of the annual revenue.
Expanded into three new markets, increasing our customer base by 15%.
Future Goals
For the upcoming year, the company aims to:
Increase revenue by 20% through diversification and market expansion.
Improve customer retention rate to 95% by enhancing customer engagement strategies.
Recommendations
Based on the year-end performance analysis, the following recommendations are made:
Invest in Research and Development: To stay ahead of market trends and competitors.
Enhance Customer Engagement: Through personalized marketing and improved customer service.
Focus on Employee Development: By offering training programs and creating a conducive work environment.
For any further queries, please contact [Your Name] at [Your Email].
