Sales Lead Metrics Document
[Your Company Name]
Date: [Month Day, Year]
I. Lead Generation Metrics
Source Analysis
In this section, we analyze the performance of various lead sources to gain insights into the effectiveness of our lead generation efforts. The data provides a comprehensive overview of where our leads originate, allowing us to make informed decisions regarding resource allocation and marketing strategies.
Website Forms | A robust contributor with [000] leads, reflecting the engagement on our website. |
Social Media | A strong presence on social platforms resulted in 320 leads, showcasing the power of our online community. |
Email Campaigns | Our targeted email campaigns yielded [000] leads, underlining the importance of personalized communication. |
Paid Advertising | With [000] leads, our paid advertising campaigns have been effective in driving traffic and interest. |
Trade Shows | Despite being a more traditional channel, trade shows brought in [000] leads, demonstrating the value of in-person engagement. |
II. Lead Quality Metrics
Lead Demographics
Age Groups | |
25-34 | 60% of leads |
35-44 | |
45-54 | |
55 and above | |
Geographic Distribution | |
United States | 45% of leads |
Canada | |
Europe | |
Asia | |
Rest Of The World | |
Industry Background | |
Information Technology | 30% of leads |
Healthcare | |
Finance | |
Manufacturing | |
Other | |
Lead Scoring
Lead Scoring Categories | |
"Hot Leads" (Score > 80) | 70% of leads |
"Warm Leads" (Score 50-80) | |
"Cold Leads" (Score < 50) | |
III. Lead Progression Metrics
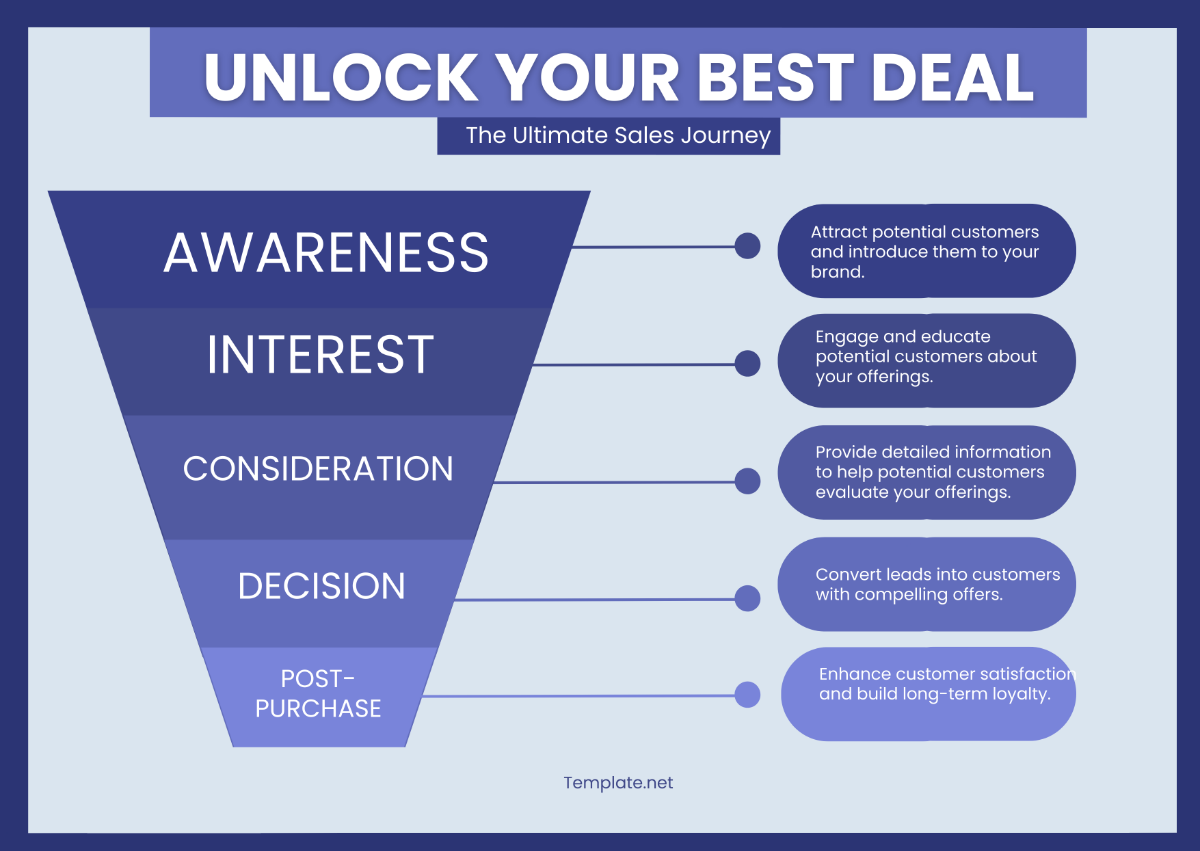
Sales Pipeline Stages
New Leads | 1,200 |
These are fresh prospects who have shown interest in [Your Company Name]'s products or services, but have not yet been contacted. | |
Contacted | [000] |
Leads who have been successfully contacted and engaged in initial conversations. | |
Engaged | [000] |
Leads who have expressed a higher level of interest and are actively engaging with our sales team. | |
Proposal Sent | [000] |
Leads for whom detailed proposals have been sent, indicating a strong intent to explore our offerings. | |
Closed-Won | [000] |
The ultimate goal – these are converted customers who have made a purchase. | |
Conversion Rates
New Leads To Contacted | [000] |
The percentage of new leads successfully contacted and moved to the next stage. | |
Contacted To Engaged | [00]% |
The conversion rate from initial contact to a deeper level of engagement. | |
Engaged To Proposal Sent | [00]% |
The rate at which engagement leads progress to the proposal stage. | |
Proposal Sent To Closed-Won | [00]% |
The conversion rate from receiving a proposal to becoming a customer. | |
Average Time In Each Stage
New Leads To Contacted | [0] days |
The average time it takes to initiate contact with a new lead. | |
Contacted To Engaged | [0] days |
The time required to transition from initial contact to an engaged lead. | |
Engaged To Proposal Sent | [0] days |
The duration between lead engagement and the proposal submission. | |
Proposal Sent To Closed-Won | [0] days |
The average time it takes for a lead to progress through the final stages and become a customer. | |
IV. Conversion Metrics
Total Conversions
Closed-Won: [00]
Total Revenue Generated: $[000,000]
Comments:
The total number of closed-won deals for the period under review is [00], resulting in an impressive revenue generation of $[000,000]. This represents the successful conversion of leads into paying customers, demonstrating the effectiveness of our sales efforts.
Conversion Rates
Conversion Rate (Lead to Customer): [00]%
Average Deal Size: $[00,000]
Comments:
The overall conversion rate from leads to customers stands at [00]%, which is a key performance indicator for our sales team. This rate reflects the proportion of leads successfully converted into paying customers.
Additionally, the average deal size is $[000], providing insights into the typical value of a customer. Analyzing this metric helps us understand the financial impact of each converted lead.
V. Sales Team Performance Metrics
Sales Team Activities | |
| 600 |
| |
| |
| 300 |
| |
| |
| 80% |
| |
Sales Team Conversion Rates | |
Lead-to-Meeting Conversion Rate | 50% |
Meeting-to-Proposal Conversion Rate | |
Proposal-to-Closed-Won Conversion Rate | |
VI. Marketing Campaign Performance Metrics
Email Campaign (Q3 2050):
Total Emails Sent: 50,000
Unique Click-Throughs:
Email Open Rate:
Conversion Rate:
Revenue from Campaign:
Analysis
The [Quarter] email campaign sent [00,000] emails, resulting in a respectable [00]% click-through rate (CTR), which indicates strong engagement with our content.
With a [00]% open rate, our email content is effectively capturing recipients' attention, but there may be opportunities to further enhance subject lines and content to boost this metric.
The campaign successfully converted [0]% of recipients, generating [000] valuable leads. Understanding the characteristics and preferences of these leads will be crucial for future targeting.
The revenue generated from this campaign amounts to an impressive $[000,000], showcasing the campaign's impact on the bottom line.
Ongoing analysis will help identify what elements contributed to this campaign's success, informing future marketing efforts.
VII. Lead Acquisition Costs
Cost Per Lead By Source
Analyzing the cost of acquiring leads from various sources is vital in optimizing our marketing budget. Understanding the cost per lead (CPL) by source provides valuable insights into the efficiency of our lead generation efforts. Here are the CPL figures for each lead source:
Website Forms: $[0] per lead
Social Media: $[0] per lead
Email Campaigns: $[0] per lead
Paid Advertising: $[0] per lead
Trade Shows: $[0] per lead
By closely monitoring these acquisition costs, we can make informed decisions about resource allocation and marketing strategy adjustments to ensure we are maximizing our ROI and focusing on the most cost-effective lead sources.
VIII. Lead-To-Customer Lifecycle Metrics
A. Average Time From Lead Generation To Customer Conversion: On average, it takes approximately 60 days for a generated lead to progress through the sales funnel and ultimately convert into a paying customer. This metric highlights the efficiency of our sales process, indicating the time and nurturing required to establish a valuable customer relationship.
B. Funnel Drop-Off Analysis: While the average conversion time is [00] days, a deeper analysis reveals that specific stages in our sales funnel may require attention. The "Engaged" to "Proposal Sent" stage, for example, takes [0] days on average, suggesting the need for further evaluation to reduce this time and enhance engagement tactics.
C. Customer Acquisition Cost (CAC): The CAC for [Your Company Name] is calculated by considering all lead acquisition costs, sales team expenses, and marketing campaign investments involved in converting a lead into a customer. Our current CAC stands at $[0,000], which is a critical metric to monitor as it directly impacts our profitability and return on investment.
D. Customer Lifetime Value (CLV): Understanding the CLV is vital for long-term success. At [Your Company Name], our CLV analysis indicates that, on average, a customer remains with us for [0] years, generating an estimated $[00,000] in revenue. This knowledge informs our customer retention strategies and underscores the importance of maintaining high-quality customer relationships.
These metrics provide a more comprehensive view of the lead-to-customer conversion process, offering valuable insights into conversion times, stages that may require optimization, cost-effectiveness, and the long-term value of our customers. They play a crucial role in shaping our sales and marketing strategies for sustainable growth.
IX. Customer Feedback And Satisfaction Metrics
Net Promoter Score (NPS)
[Your Company Name] regularly surveys customers to gauge their loyalty and satisfaction. The latest NPS survey conducted in [Quarter] [Year] revealed the following results:
Promoters (Score 9-10): 65%
Passives (Score 7-8):
Detractors (Score 0-6):
The NPS score for [Your Company Name] in [Quarter] [Year] is [00], indicating a strong level of customer satisfaction and positive word-of-mouth.
Customer Satisfaction (CSAT)
[Your Company Name] collects post-purchase CSAT feedback from customers. In [Quarter] [Year], the CSAT survey results were as follows:
Very Satisfied (5): 70%
Satisfied (4):
Neutral (3):
Dissatisfied (2):
Very Dissatisfied (1):
The average CSAT score for [Quarter] [Year] is [0], reflecting a high level of customer satisfaction.
Customer Feedback And Testimonials
[Your Company Name] actively encourages customers to provide feedback and testimonials. In the last quarter, we received [00] positive testimonials highlighting our excellent product quality and exceptional customer service.
Specific feedback from customers:
"[Your Company Name] saved our business with their prompt tech support." - Customer A
"The product exceeded our expectations, and the sales team was fantastic!" - Customer B
These Customer Feedback and Satisfaction Metrics provide insight into customer sentiment, loyalty, and the quality of products and services offered by [Your Company Name] They help gauge how well the company meets customer expectations and identifies areas for improvement. Positive feedback and high retention rates indicate a strong customer-centric approach.
X. Conclusion
This Sales Lead Metrics Document for [Your Company Name] provides a comprehensive overview of our lead generation and conversion efforts. By tracking the various stages of our sales funnel and analyzing key performance indicators, we gain valuable insights into the effectiveness of our strategies.
The data presented highlights the importance of lead quality and the need to continually refine our lead nurturing and engagement processes. Our conversion rates, average deal size, and customer acquisition costs are essential metrics for optimizing our sales and marketing efforts.
Moreover, the analysis of the lead-to-customer lifecycle metrics reveals the time it takes for leads to evolve into loyal customers and the associated costs and benefits. These insights guide our decision-making processes and enable us to allocate resources efficiently and set realistic targets for future growth.
Moving forward, the data presented in this document will serve as a foundational resource for our team, helping us adapt to market changes, fine-tune our strategies, and maintain a focus on customer satisfaction. As we continue to monitor and refine these metrics, we are better equipped to drive our company's success and ensure sustainable growth.
In this dynamic business landscape, data-driven decision-making remains a cornerstone of our strategy, and this Sales Lead Metrics Document is a testament to our commitment to achieving excellence in lead generation and customer conversion.
