Data Analyst Resume Design
Address: [Your Address]
Email: [Your Email]
Phone: [Your Phone Number]
LinkedIn: [Your LinkedIn Profile]
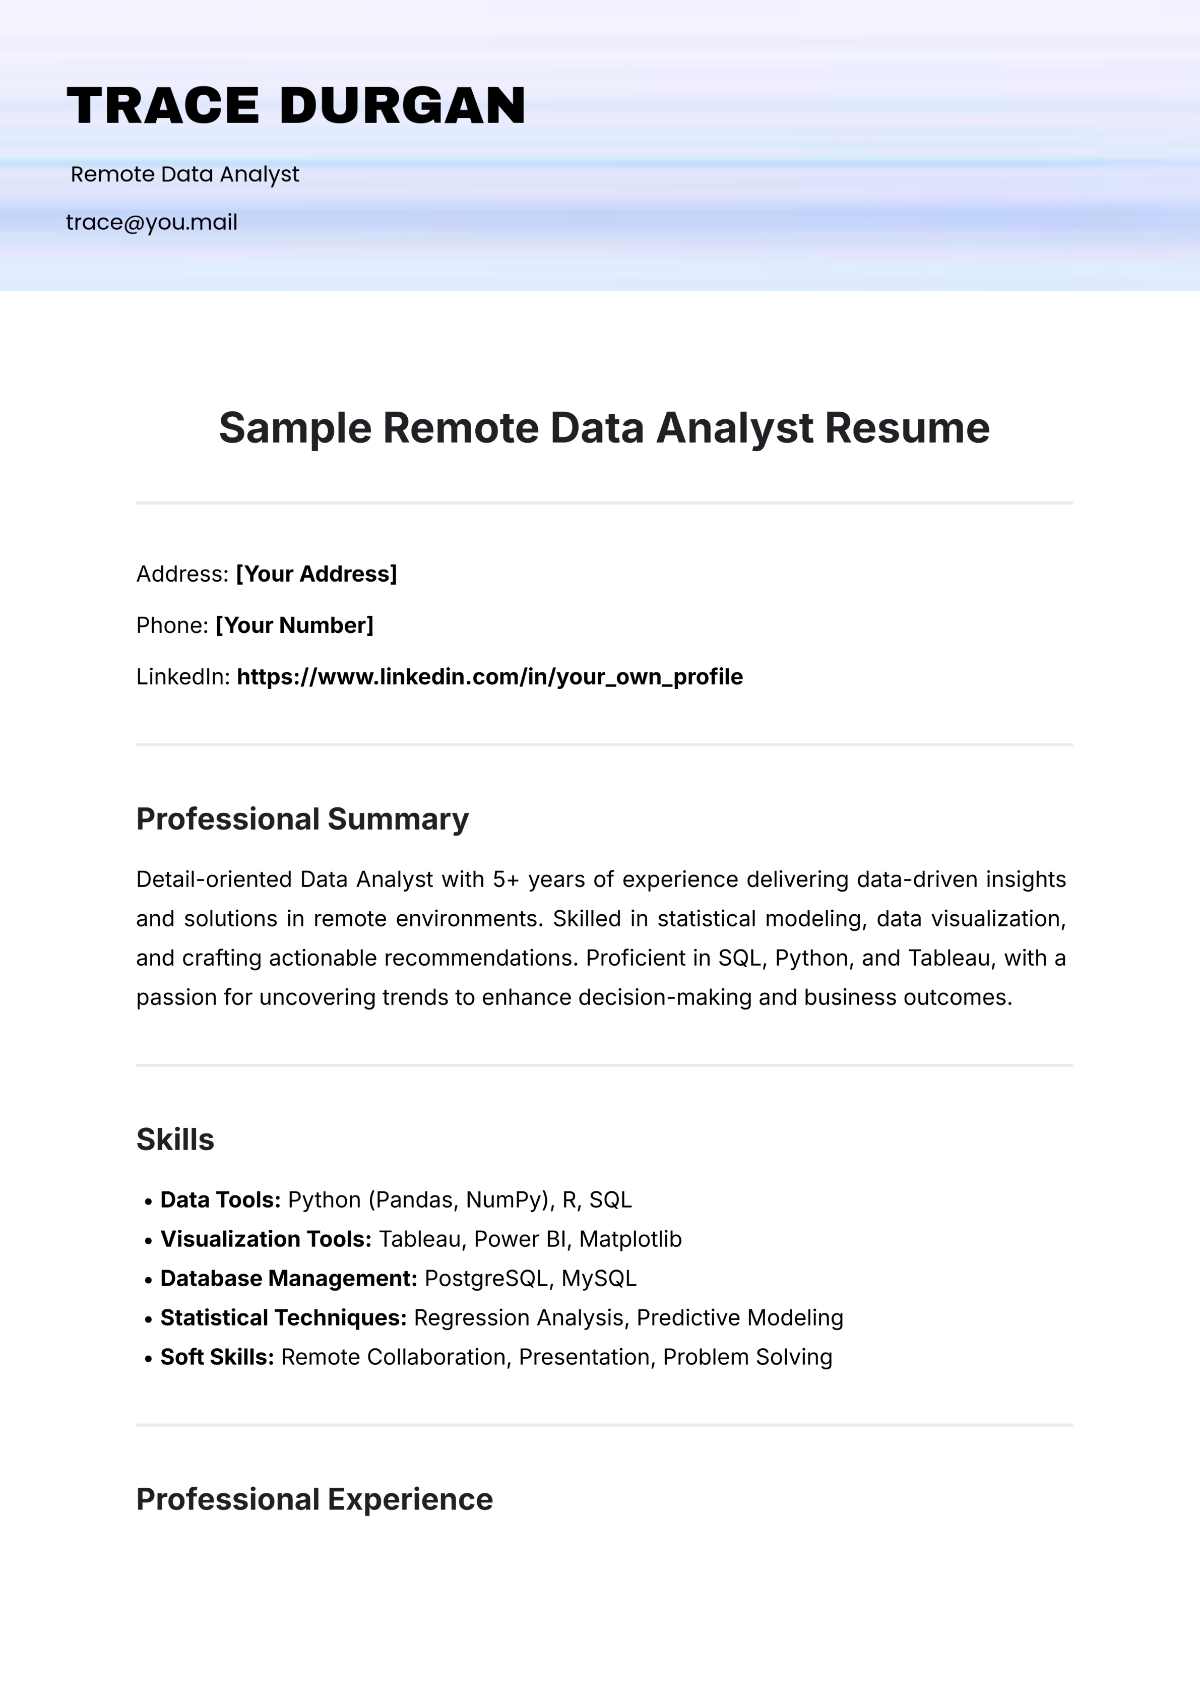
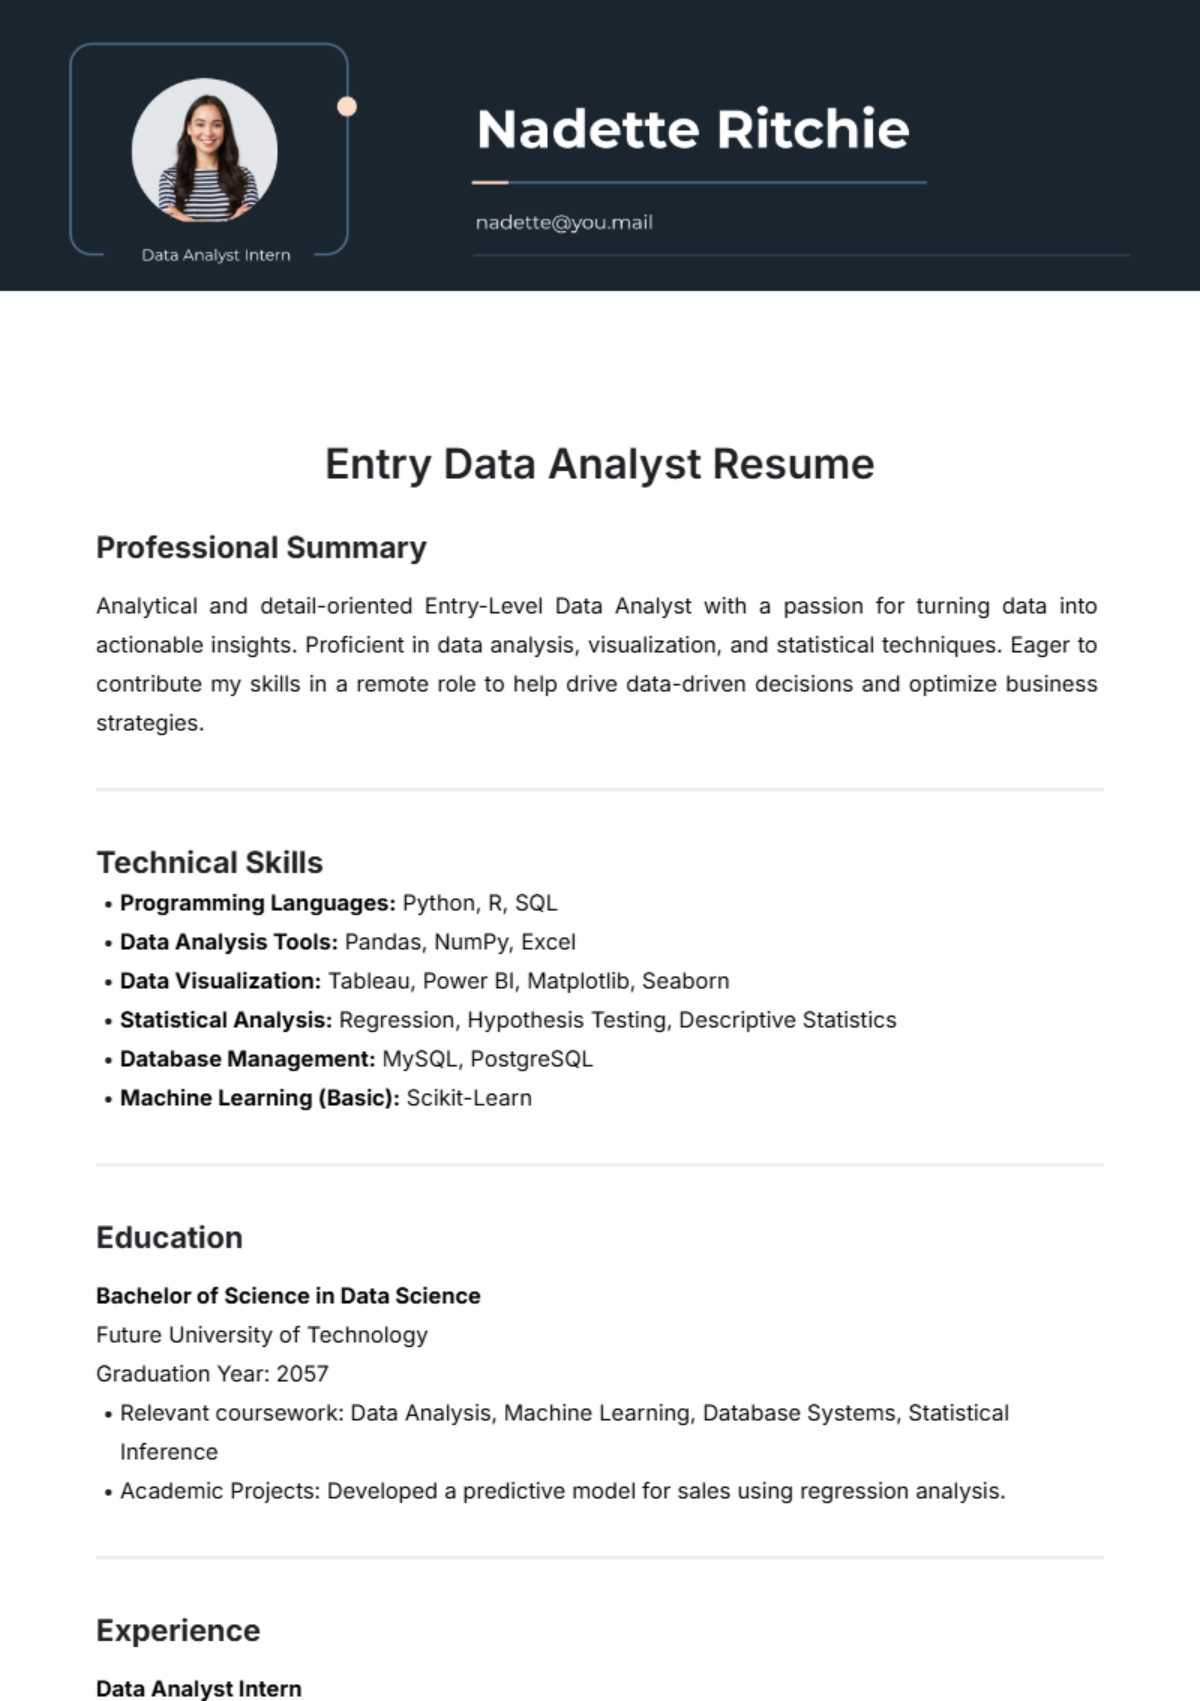
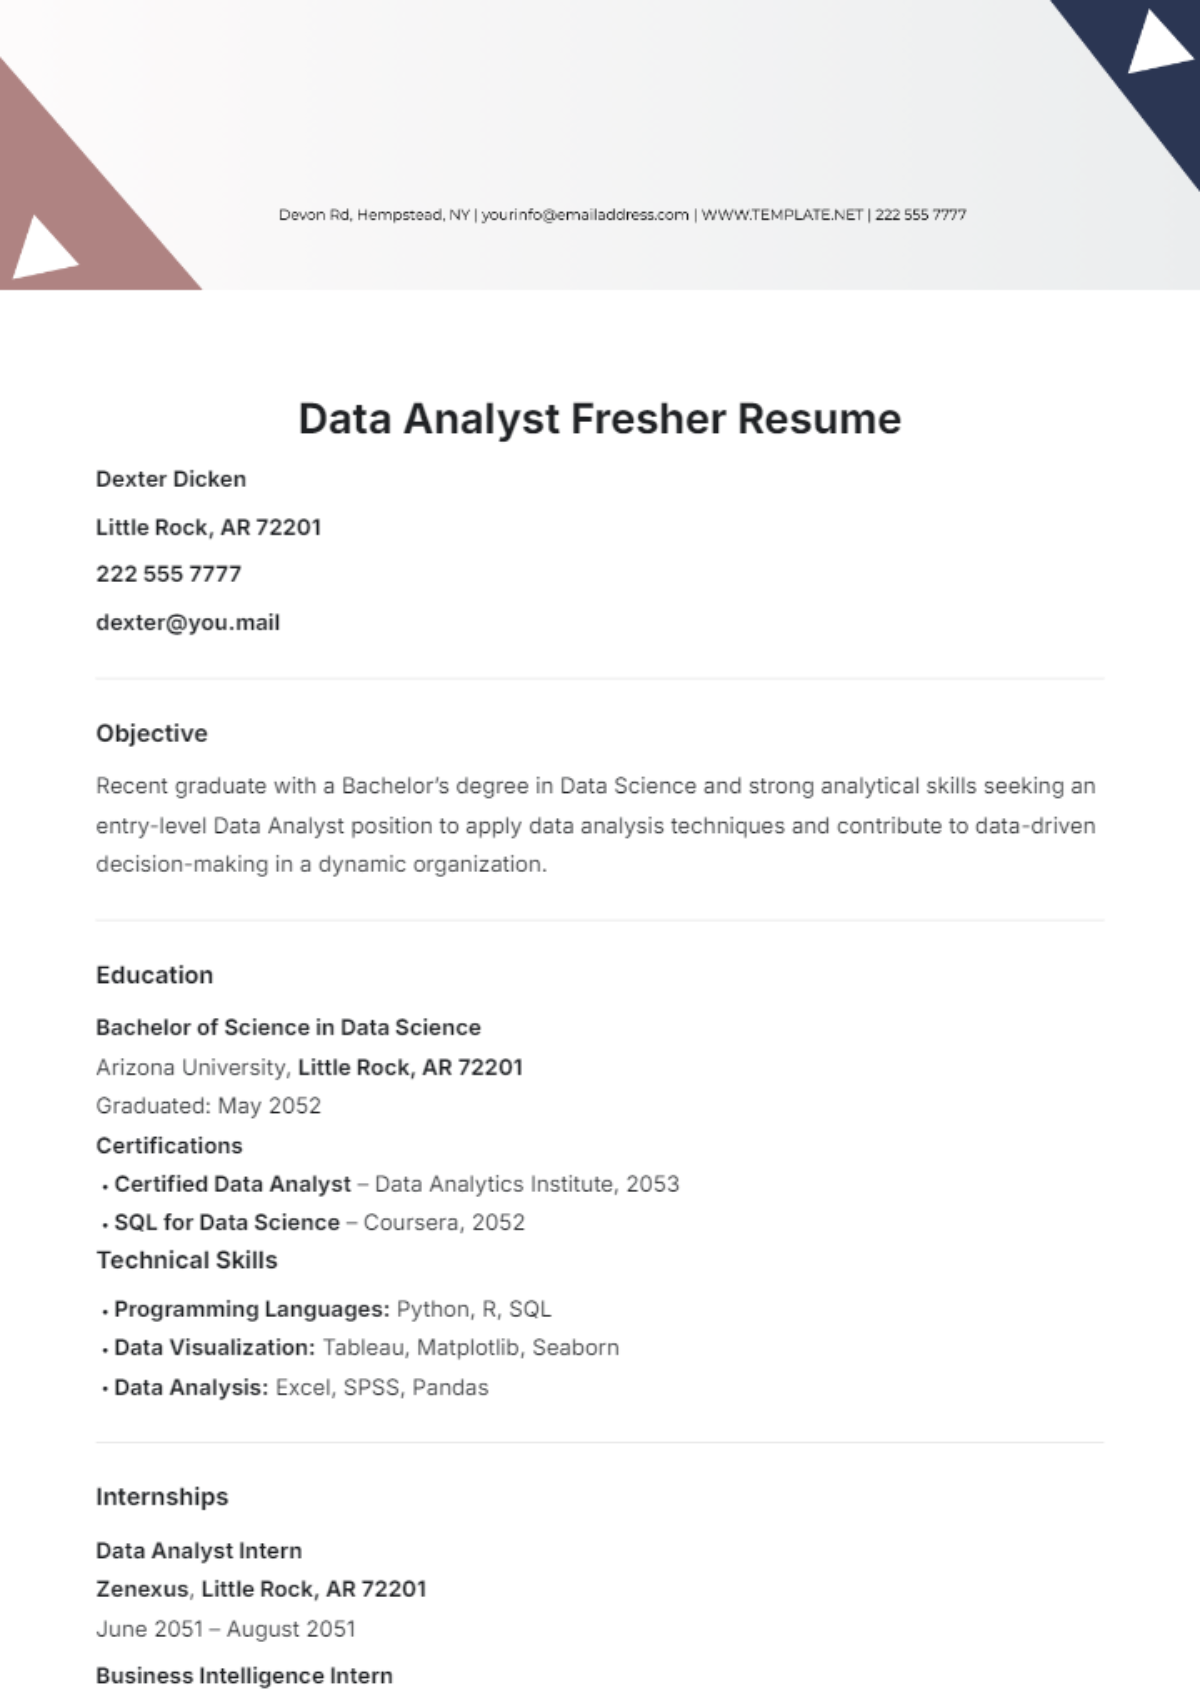
Professional Summary
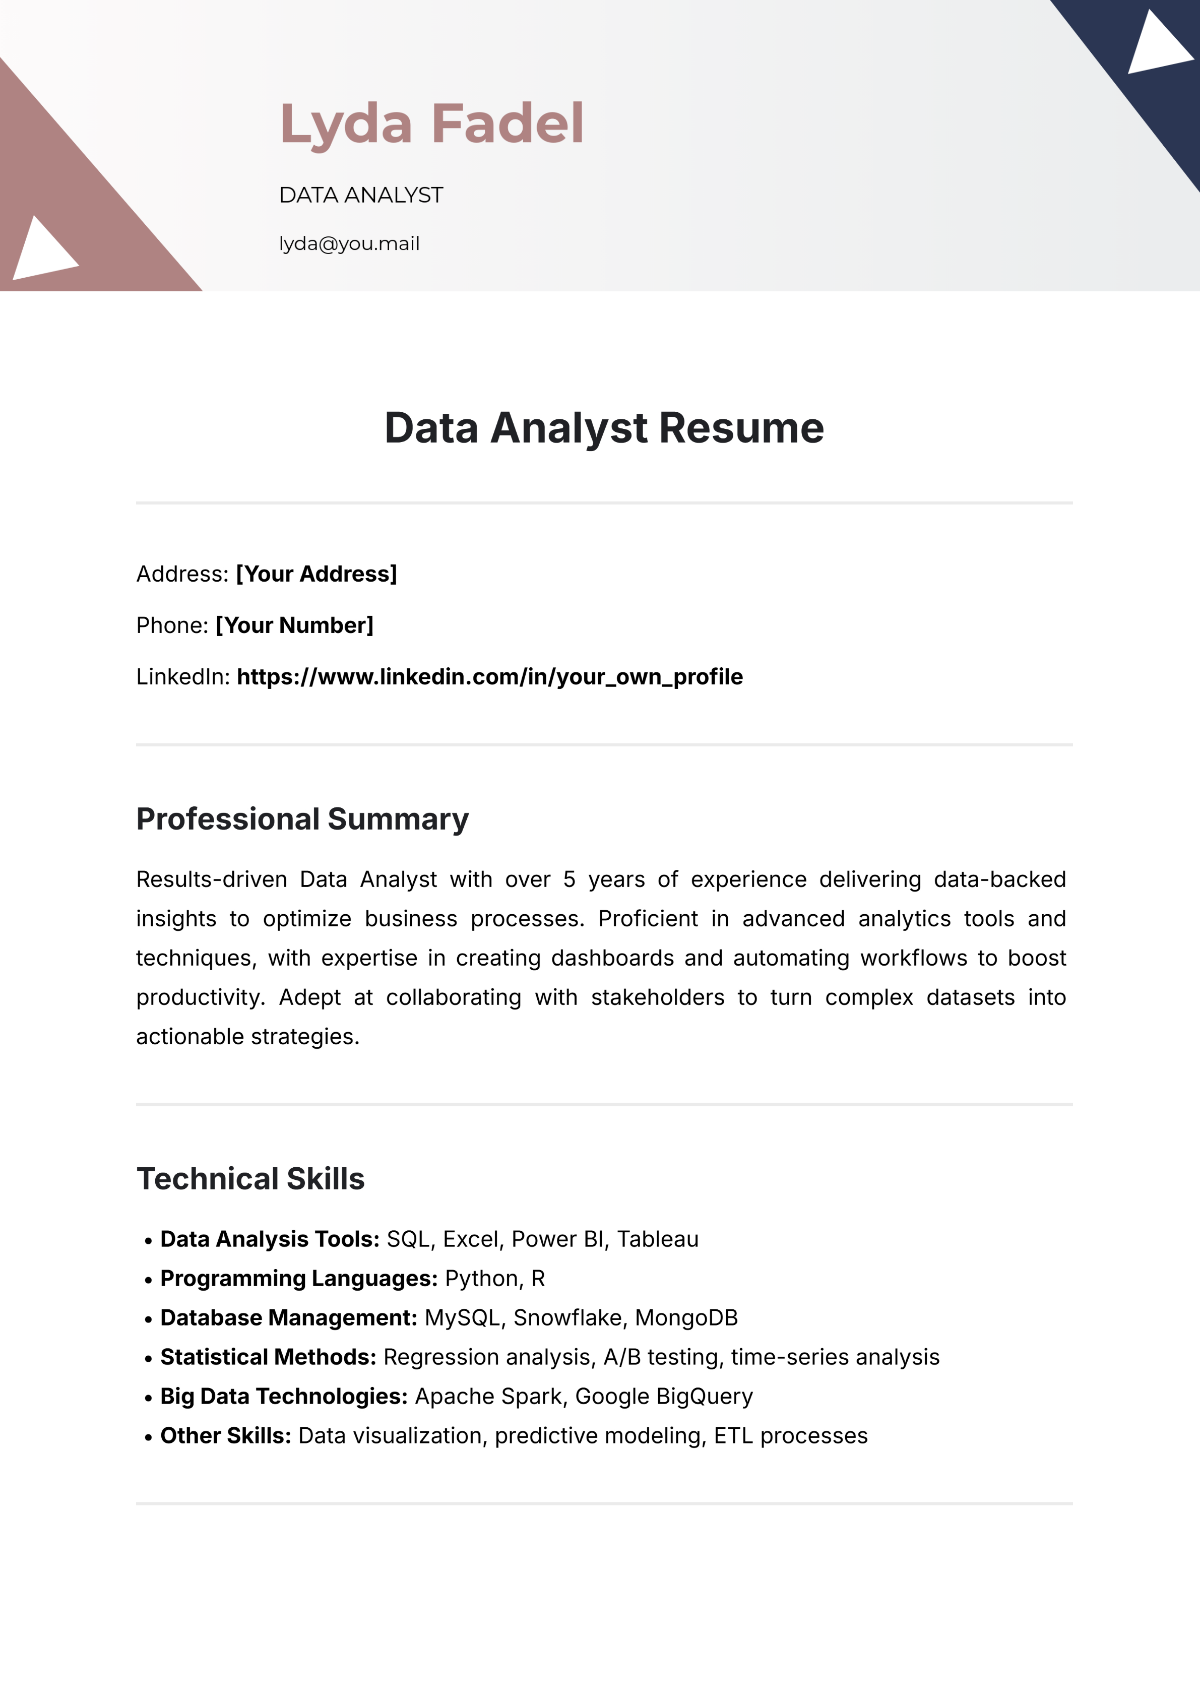
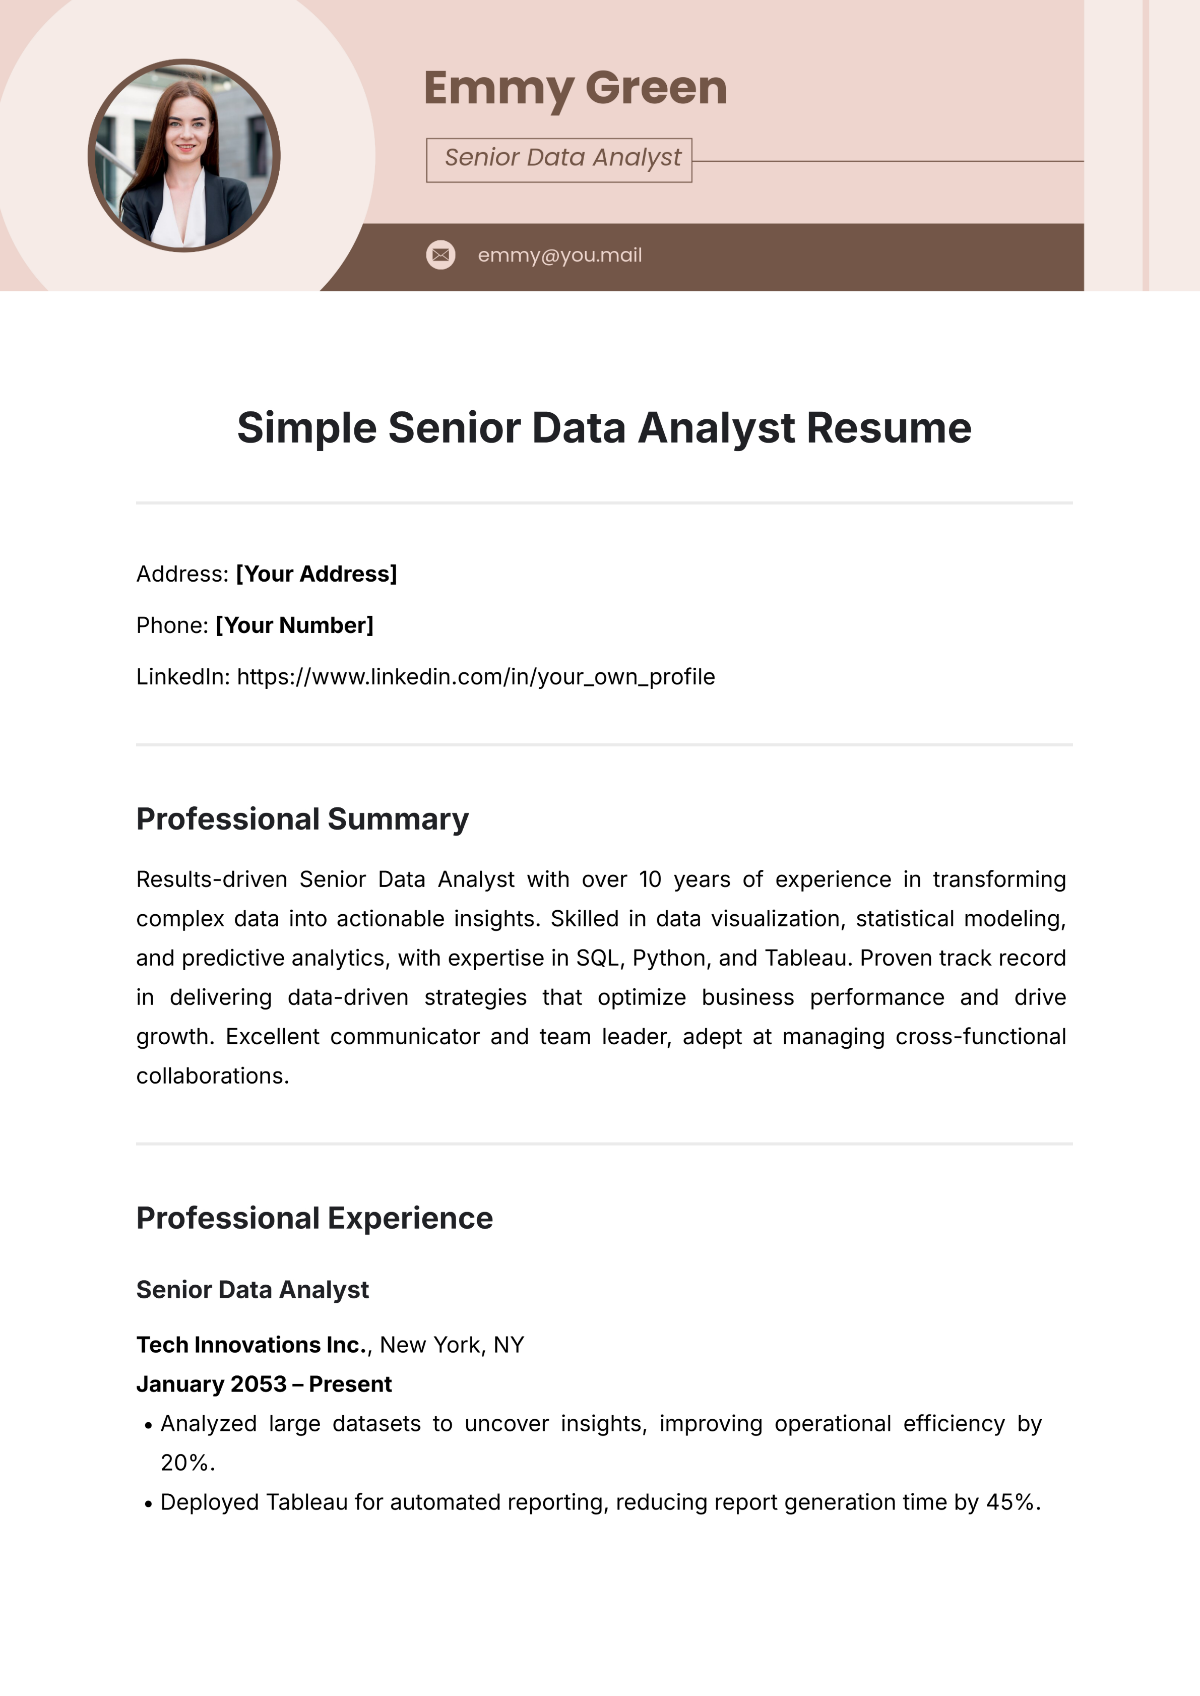
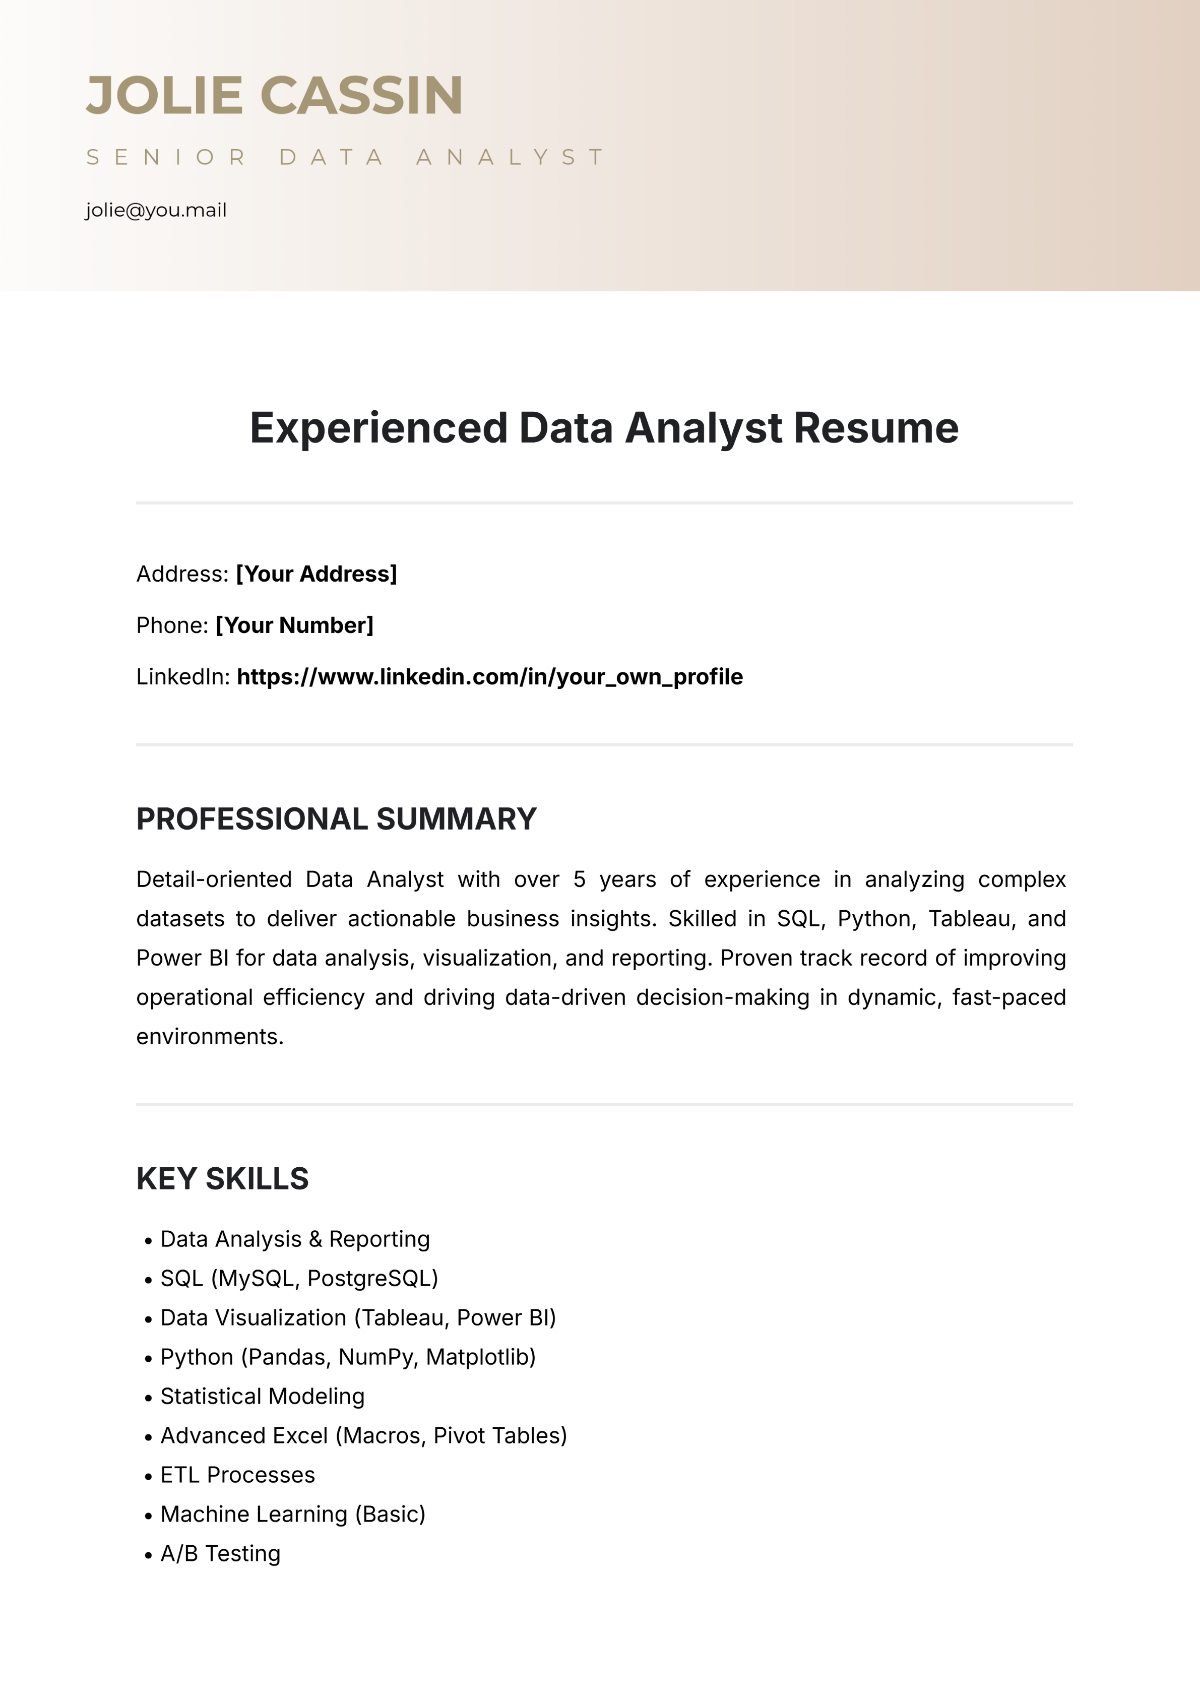
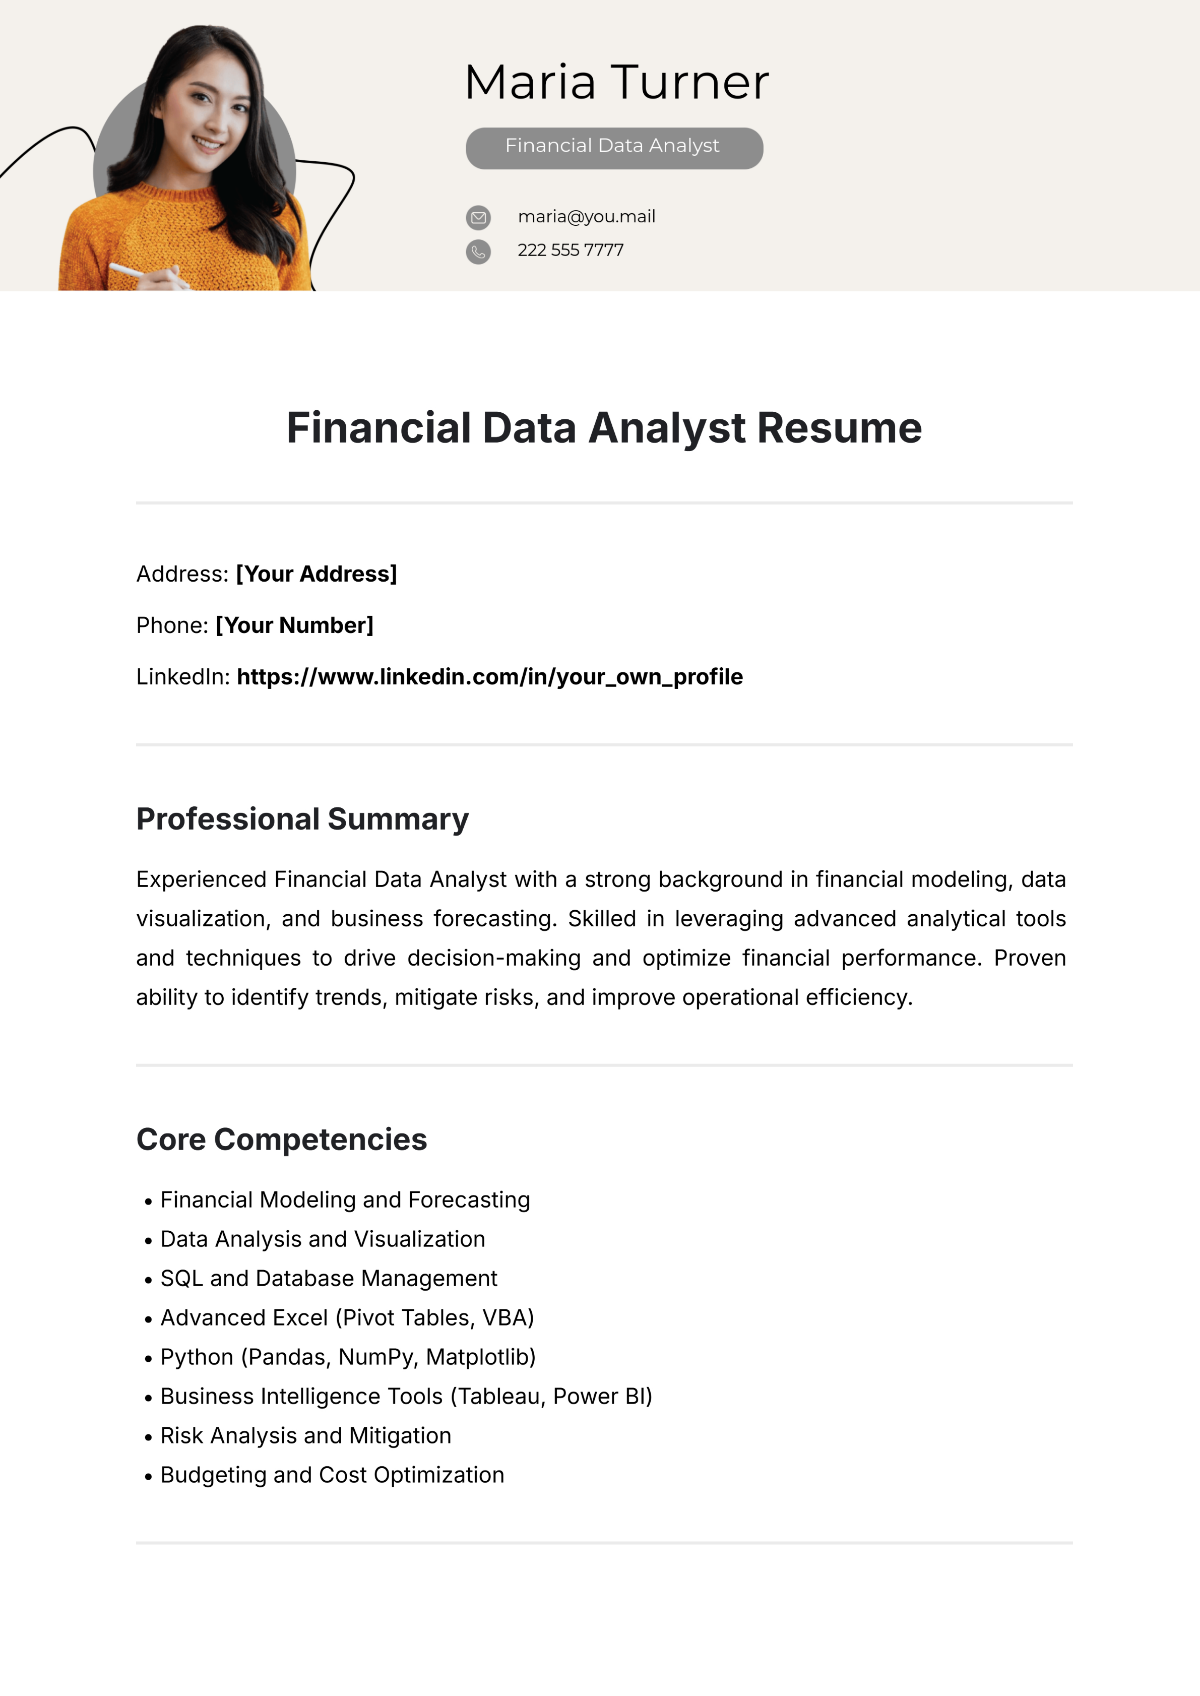
Results-driven Data Analyst with a strong foundation in data manipulation, statistical analysis, and data visualization. Skilled at transforming raw data into actionable insights to drive business decision-making. Adept at using tools like Excel, Python, R, SQL, and Tableau to analyze trends and generate reports. Seeking to leverage analytical skills to contribute to a dynamic team.
Core Competencies
Data Analysis & Visualization
Data Cleaning & Preprocessing
Statistical Analysis
SQL, Python, R
Data Visualization Tools (Tableau, Power BI)
Machine Learning
Database Management
Reporting & Documentation
Business Intelligence
Professional Experience
Data Analyst
[Company Name] | [Location]
Month/Year – Present
Conducted data cleaning and transformation tasks to prepare datasets for analysis and reporting.
Developed custom dashboards and reports using Tableau and Power BI, presenting key business insights to stakeholders.
Utilized SQL to extract and manipulate large datasets from relational databases for ad-hoc queries.
Performed statistical analysis to identify trends, correlations, and actionable business insights.
Automated reporting processes, reducing the time spent on weekly reports by 30%.
Collaborated with cross-functional teams to understand business requirements and provide data-driven solutions.
Education
Bachelor of Science in Data Science
[University Name] | [Location]
Month/Year of Graduation
Relevant Coursework: Statistical Analysis, Machine Learning, Data Visualization, Database Management, Predictive Analytics.
Technical Skills
Programming Languages: Python, R, SQL
Data Analysis: Pandas, NumPy, SciPy, StatsModels
Data Visualization: Tableau, Power BI, Matplotlib, Seaborn
Database Management: MySQL, PostgreSQL, MongoDB
Tools: Excel, Jupyter, Git, Docker
Machine Learning: Scikit-Learn, TensorFlow
Certifications
Google Data Analytics Professional Certificate – Coursera
Tableau Desktop Specialist – Tableau
SQL for Data Science – Coursera
Projects
Sales Data Analysis
Analyzed sales data from an e-commerce platform to identify trends and suggest improvements in inventory management.
Used Python (Pandas and Matplotlib) to create visualizations showing sales trends over time.
Customer Segmentation Using K-Means
Utilized K-Means clustering to segment customers based on purchasing behaviors.
Created a report outlining different customer segments, providing insights for targeted marketing strategies.
Languages
English (Fluent)
Spanish (Conversational)
