Printable Grocery Store Budget Analysis Statement
For the Fiscal Year Ended [Month Day, Year]
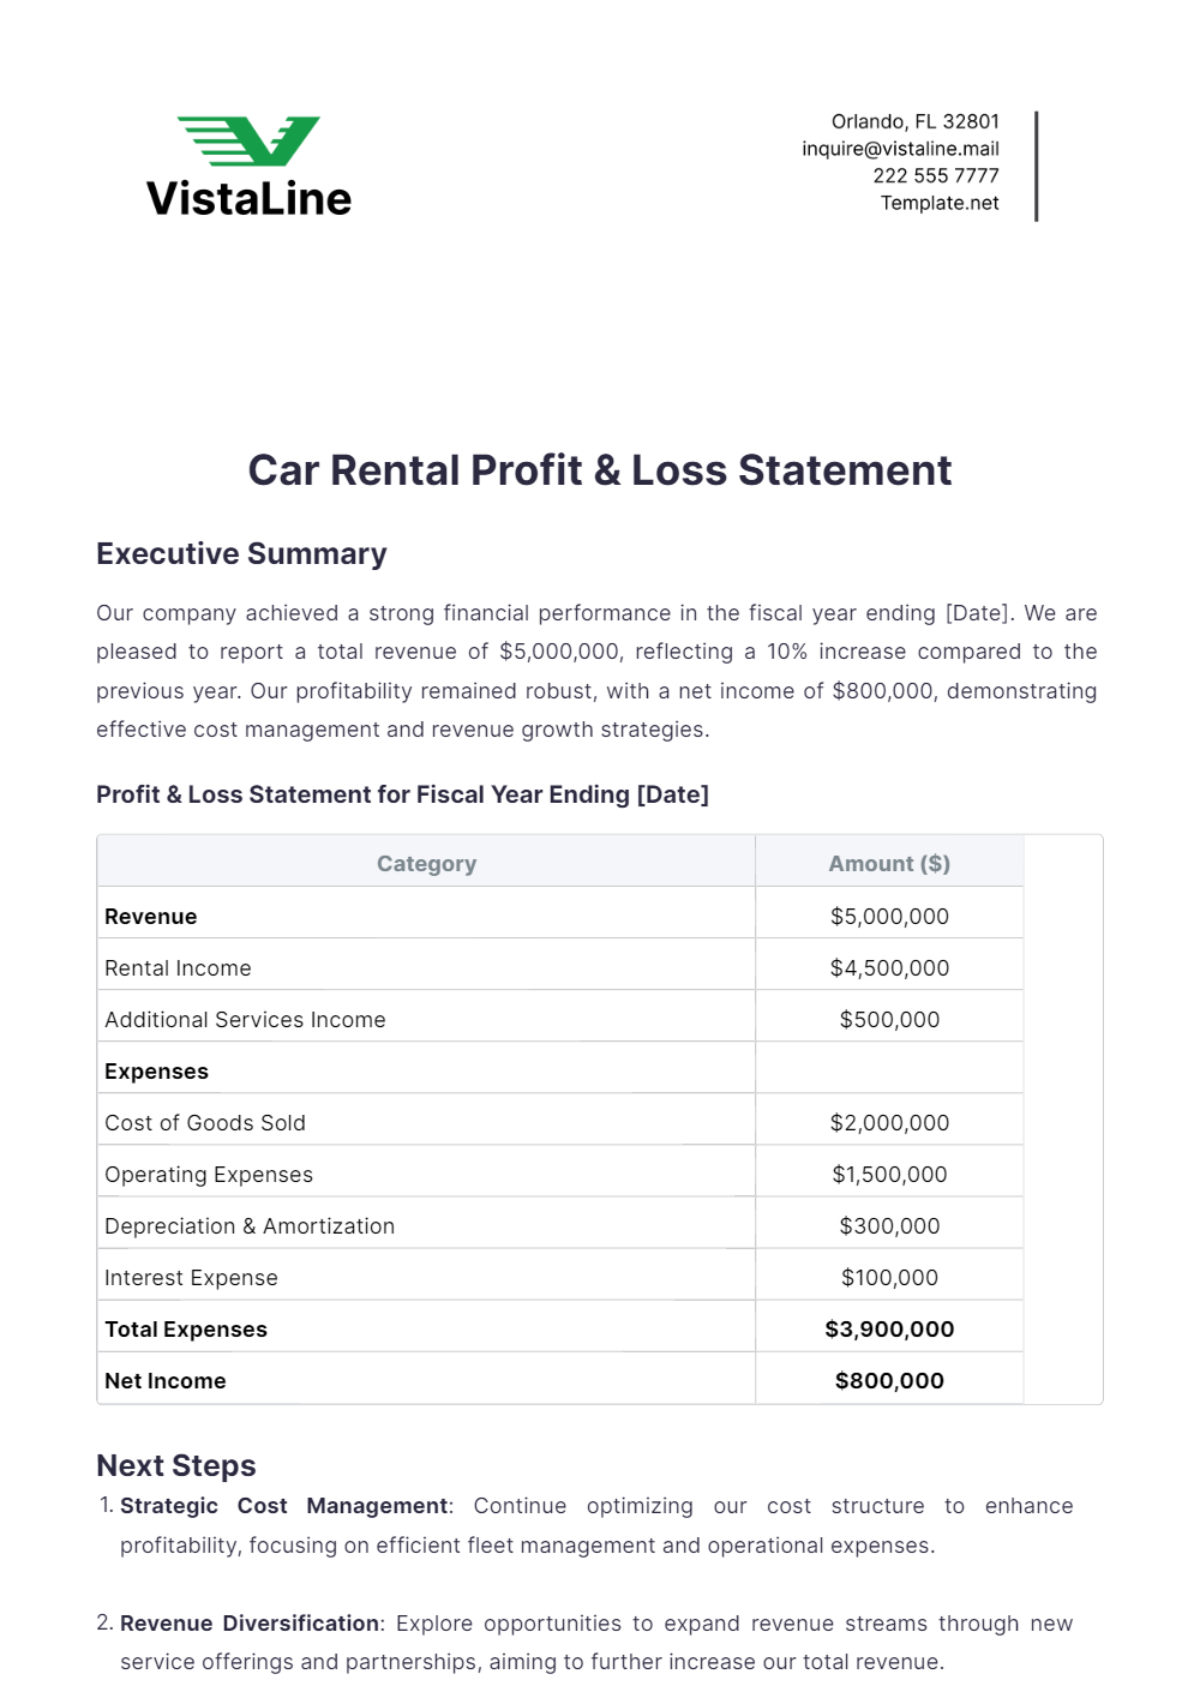
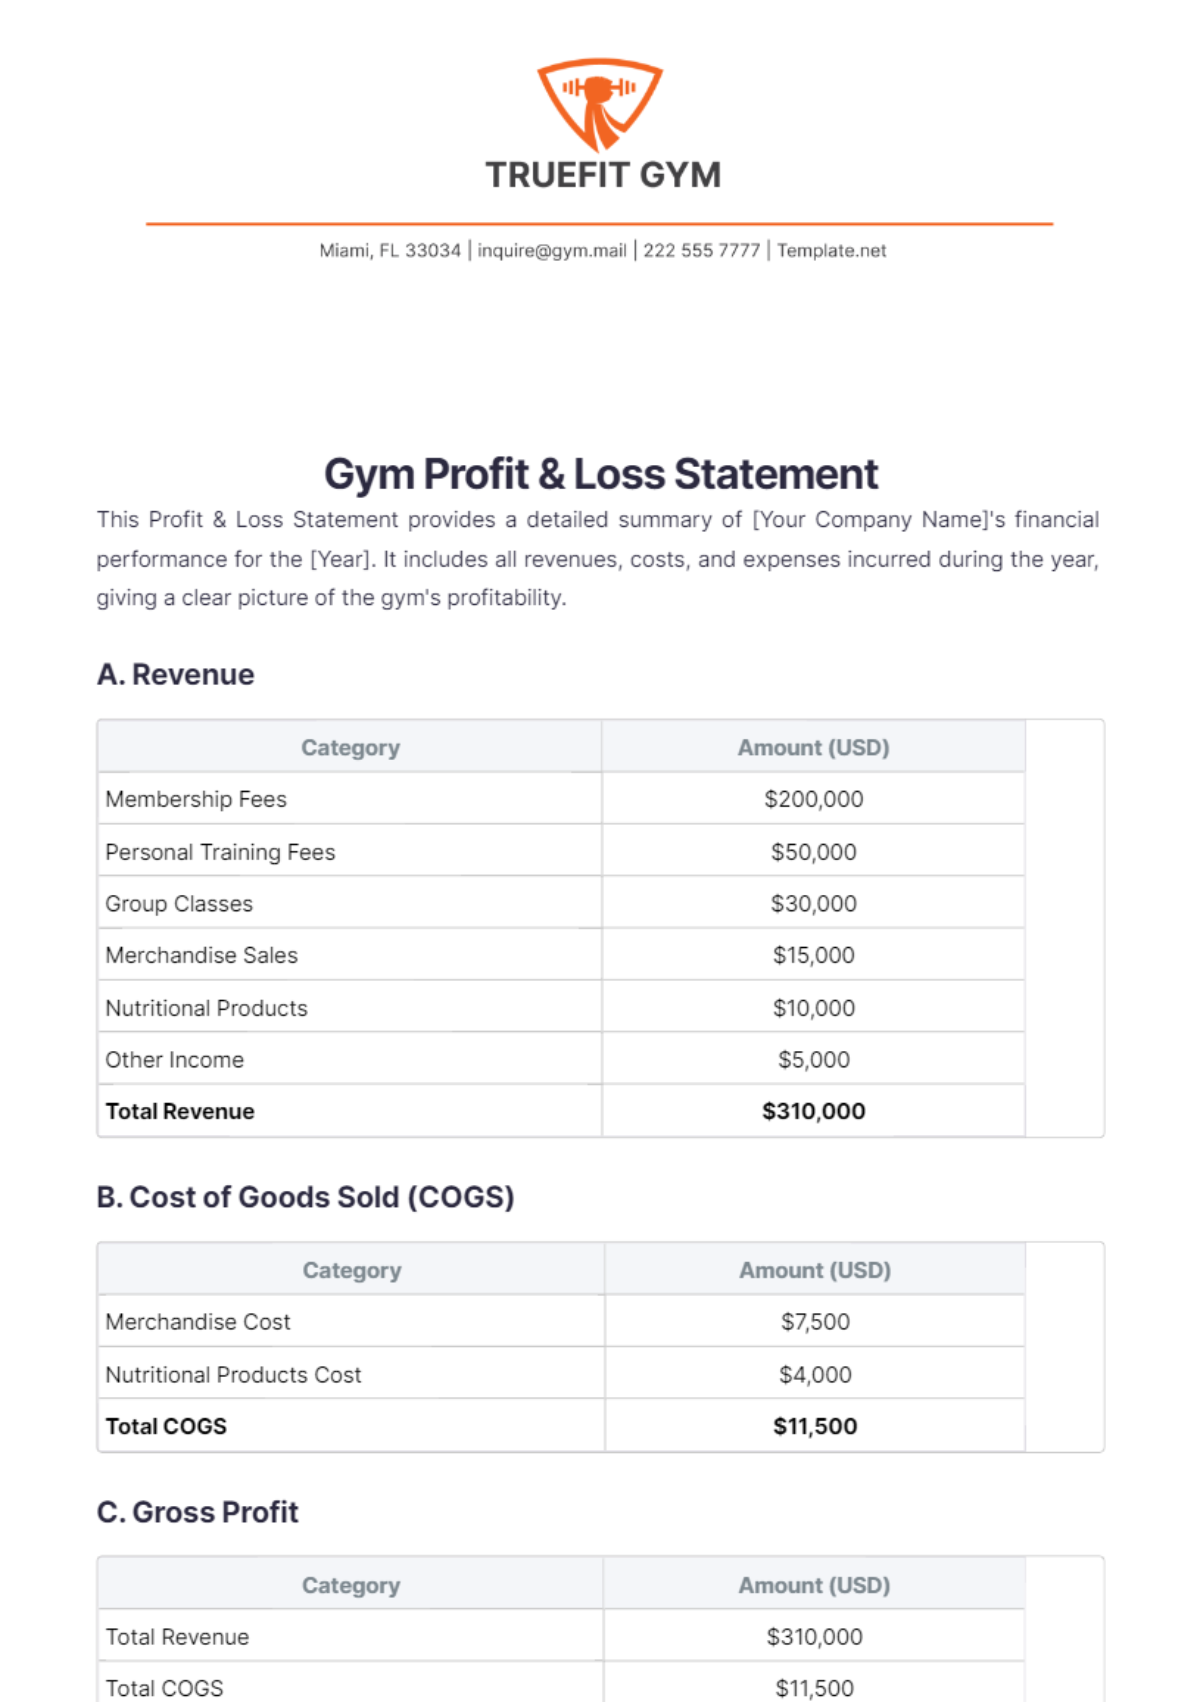
This Grocery Store Budget Analysis Statement provides a comprehensive overview of the financial performance of [Your Company Name]. By examining our revenue streams, operating expenses, and net profit margins, we aim to identify areas for improvement and strategic growth. This budget analysis will serve as a foundation for future financial planning and decision-making, ensuring our store remains competitive and profitable.
I. Revenue Analysis
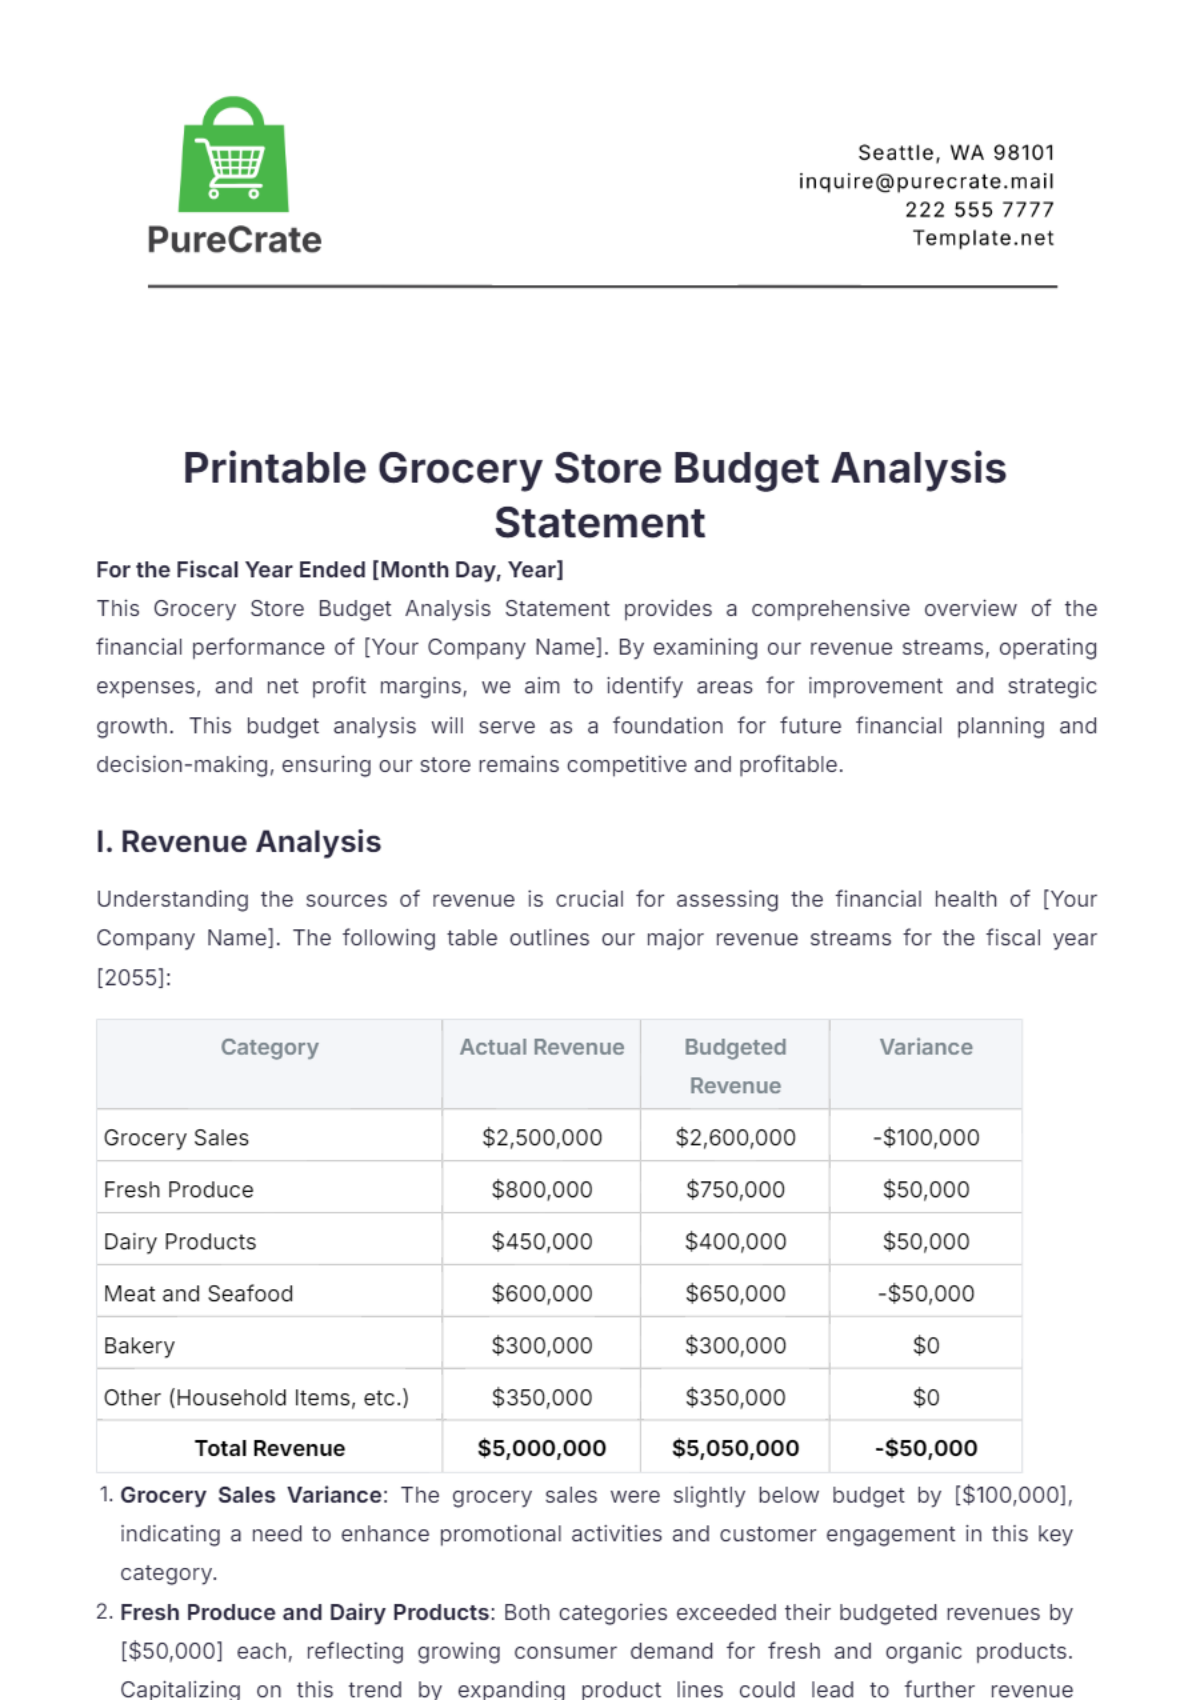
Understanding the sources of revenue is crucial for assessing the financial health of [Your Company Name]. The following table outlines our major revenue streams for the fiscal year [2055]:
Category | Actual Revenue | Budgeted Revenue | Variance |
|---|---|---|---|
Grocery Sales | $2,500,000 | $2,600,000 | -$100,000 |
Fresh Produce | $800,000 | $750,000 | $50,000 |
Dairy Products | $450,000 | $400,000 | $50,000 |
Meat and Seafood | $600,000 | $650,000 | -$50,000 |
Bakery | $300,000 | $300,000 | $0 |
Other (Household Items, etc.) | $350,000 | $350,000 | $0 |
Total Revenue | $5,000,000 | $5,050,000 | -$50,000 |
Grocery Sales Variance: The grocery sales were slightly below budget by [$100,000], indicating a need to enhance promotional activities and customer engagement in this key category.
Fresh Produce and Dairy Products: Both categories exceeded their budgeted revenues by [$50,000] each, reflecting growing consumer demand for fresh and organic products. Capitalizing on this trend by expanding product lines could lead to further revenue increases.
Meat and Seafood: The revenue in this category was [$50,000] below the budget. Reviewing pricing strategies and product assortment could help address this shortfall.
Overall Revenue: While the total revenue fell short of the budget by [$50,000], the strong performance in fresh produce and dairy products partially offset the underperformance in other categories.
Opportunities for Growth: Focusing on categories with positive variances and understanding consumer preferences will allow [Your Company Name] to adjust its strategies and improve future revenue projections.
II. Operating Expenses
A detailed analysis of operating expenses helps identify potential cost-saving measures and efficiency improvements. The table below summarizes the actual and budgeted expense categories for the fiscal year [2055]:
Category | Actual Expenses | Budgeted Expenses | Variance |
|---|---|---|---|
Cost of Goods Sold (COGS) | $3,000,000 | $2,900,000 | $100,000 |
Employee Salaries | $800,000 | $850,000 | -$50,000 |
Rent and Utilities | $300,000 | $300,000 | $0 |
Marketing and Advertising | $150,000 | $180,000 | -$30,000 |
Supplies and Equipment | $100,000 | $90,000 | $10,000 |
Miscellaneous Expenses | $50,000 | $50,000 | $0 |
Total Expenses | $4,400,000 | $4,370,000 | $30,000 |
COGS Variance: The cost of goods sold exceeded the budget by [$100,000]. This variance suggests a need to improve supplier negotiations and inventory management to control costs more effectively.
Employee Salaries: Actual salaries were [$50,000] below budget due to optimized staffing and improved productivity. Continuing to enhance employee efficiency through training and development will be beneficial.
Marketing and Advertising: Spending in this area was [$30,000] under budget, indicating room to invest in new marketing strategies that could drive revenue growth and brand recognition.
Overall Expense Management: Total expenses were slightly above budget by [$30,000]. While some areas experienced overruns, others, like salaries and marketing, offered savings opportunities that can be optimized further.
Cost Control Opportunities: Reviewing and adjusting budgets for high-variance categories will help align future expenses with financial goals and improve profitability.
III. Net Profit Analysis
The net profit analysis highlights our store's profitability after accounting for all expenses:
Category | Actual Amount | Budgeted Amount | Variance |
|---|---|---|---|
Total Revenue | $5,000,000 | $5,050,000 | -$50,000 |
Total Expenses | $4,400,000 | $4,370,000 | $30,000 |
Net Profit | $600,000 | $680,000 | -$80,000 |
Profit Variance: The net profit of [$600,000] was [$80,000] below the budget. This was primarily due to the shortfall in revenue and the slight overrun in expenses, indicating a need to realign operational strategies with financial targets.
Profit Margin: Despite the variance, the profit margin remains healthy at [12]%, reflecting solid financial management. Continuous efforts to enhance revenue and control costs will be crucial in achieving future profit targets.
Strategic Investments: The available net profit allows for reinvestment in the business. Priority areas include upgrading store infrastructure, expanding product lines, and enhancing customer experience to drive long-term growth.
Risk Mitigation: Establishing a financial reserve will help mitigate risks associated with market volatility and unforeseen expenses, ensuring the store’s stability in challenging economic conditions.
Future Planning: The insights gained from this analysis will inform future budgeting and strategic planning. Adjustments to marketing strategies, cost controls, and investment decisions will support continued profitability and growth.
This Grocery Store Budget Analysis Statement of [Your Company Name] reveals a strong financial foundation with opportunities for improvement. By addressing revenue shortfalls and optimizing expense management, the store can enhance profitability and sustain its competitive edge. Ongoing analysis of market trends, customer preferences, and operational efficiencies will be vital in achieving these objectives and ensuring long-term success. If you have any questions or clarifications regarding the statement, please contact [Your Name], [Your Role/Position] at [Your Email].
