Accounting Financial Statement
The Accounting Financial Statement is a critical document that provides a comprehensive overview of the financial performance and position of [Your Company Name].
1. Balance Sheet
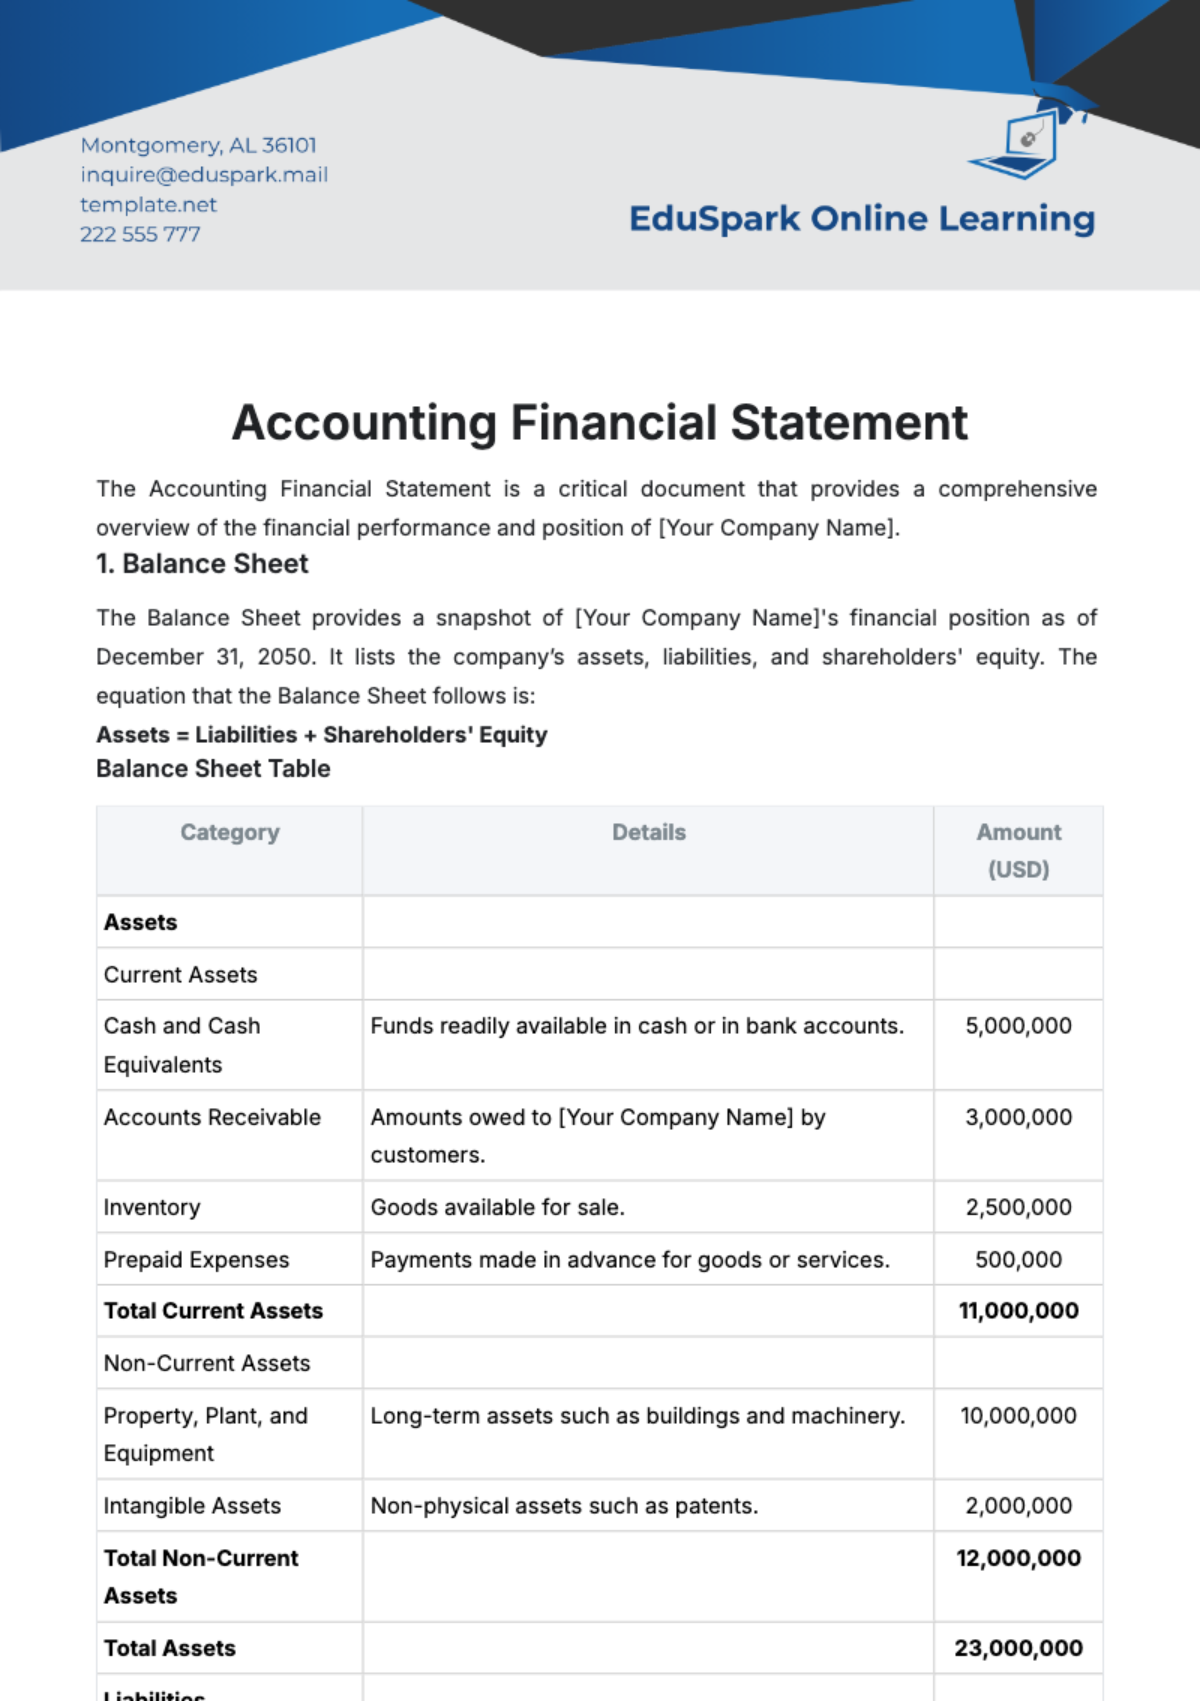
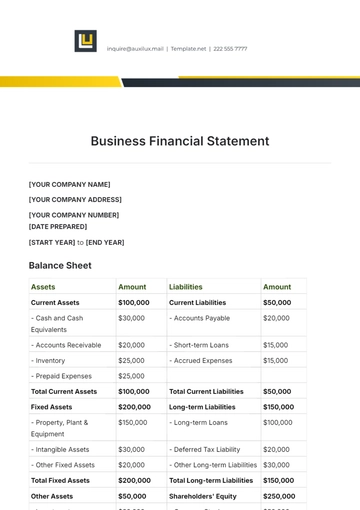
The Balance Sheet provides a snapshot of [Your Company Name]'s financial position as of December 31, 2050. It lists the company’s assets, liabilities, and shareholders' equity. The equation that the Balance Sheet follows is:
Assets = Liabilities + Shareholders' Equity
Balance Sheet Table
Category | Details | Amount (USD) |
|---|
Assets | | |
Current Assets | | |
Cash and Cash Equivalents | Funds readily available in cash or in bank accounts. | 5,000,000 |
Accounts Receivable | Amounts owed to [Your Company Name] by customers. | 3,000,000 |
Inventory | Goods available for sale. | 2,500,000 |
Prepaid Expenses | Payments made in advance for goods or services. | 500,000 |
Total Current Assets | | 11,000,000 |
Non-Current Assets | | |
Property, Plant, and Equipment | Long-term assets such as buildings and machinery. | 10,000,000 |
Intangible Assets | Non-physical assets such as patents. | 2,000,000 |
Total Non-Current Assets | | 12,000,000 |
Total Assets | | 23,000,000 |
Liabilities | | |
Current Liabilities | | |
Accounts Payable | Amounts [Your Company Name] owes to suppliers. | 2,000,000 |
Short-Term Loans | Loans due within a year. | 1,000,000 |
Accrued Expenses | Expenses incurred but not yet paid. | 800,000 |
Total Current Liabilities | | 3,800,000 |
Non-Current Liabilities | | |
Long-Term Debt | Loans due after more than a year. | 7,000,000 |
Deferred Tax Liabilities | Taxes owed in the future due to timing differences. | 500,000 |
Total Non-Current Liabilities | | 7,500,000 |
Total Liabilities | | 11,300,000 |
Shareholders' Equity | | |
Common Stock | Equity investment by shareholders. | 6,000,000 |
Retained Earnings | Cumulative profits retained in the business. | 5,700,000 |
Total Shareholders' Equity | | 11,700,000 |
Total Liabilities and Shareholders' Equity | | 23,000,000 |
2. Income Statement
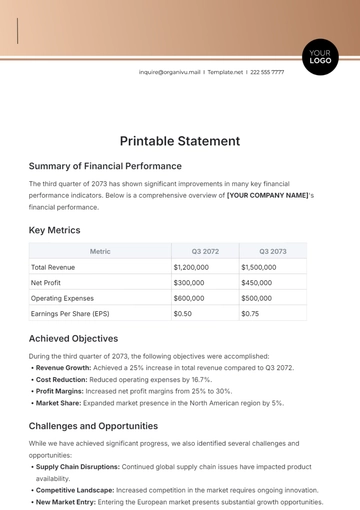
The Income Statement, also known as the Profit and Loss Statement, summarizes [Your Company Name]'s revenues, costs, and expenses over the fiscal year ending December 31, 2050. It provides a clear picture of the company's profitability.
Income Statement Table
Category | Details | Amount (USD) |
|---|
Revenue | | |
Sales Revenue | Income from the sale of goods or services. | 20,000,000 |
Other Income | Income from non-core business activities. | 500,000 |
Total Revenue | | 20,500,000 |
Expenses | | |
Cost of Goods Sold (COGS) | Direct costs attributable to the production of goods sold. | 10,000,000 |
Operating Expenses | | |
Salaries and Wages | Payments made to employees. | 3,000,000 |
Rent Expense | Cost of leasing premises. | 500,000 |
Utilities | Payments for electricity, water, etc. | 300,000 |
Depreciation and Amortization | Reduction in the value of tangible and intangible assets. | 400,000 |
Total Operating Expenses | | 4,200,000 |
Total Expenses | | 14,200,000 |
Operating Income | Revenue minus operating expenses. | 6,300,000 |
Interest Expense | Payments on borrowed funds. | 500,000 |
Income Before Taxes | | 5,800,000 |
Income Tax Expense | Provision for taxes on the year’s income. | 1,740,000 |
Net Income | Profit after all expenses have been deducted from revenue. | 4,060,000 |
3. Cash Flow Statement
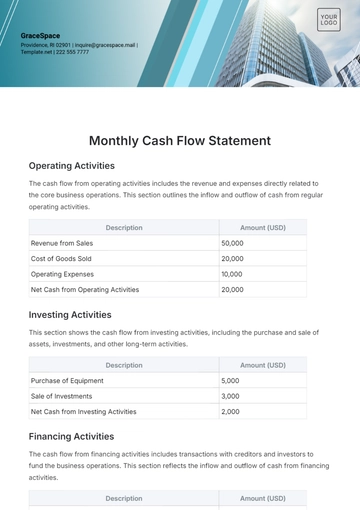
The Cash Flow Statement shows the cash inflows and outflows for [Your Company Name] over the fiscal year ending December 31, 2050. It is divided into three sections: Operating Activities, Investing Activities, and Financing Activities.
Cash Flow Statement Table
Category | Details | Amount (USD) |
|---|
Operating Activities | | |
Cash Receipts from Customers | Cash received from sales. | 18,500,000 |
Cash Paid to Suppliers and Employees | Payments for goods and services. | 11,500,000 |
Net Cash Provided by Operating Activities | | 7,000,000 |
Investing Activities | | |
Purchase of Property, Plant, and Equipment | Cash used for acquiring long-term assets. | 4,000,000 |
Sale of Investments | Cash received from selling investments. | 1,000,000 |
Net Cash Used in Investing Activities | | (3,000,000) |
Financing Activities | | |
Proceeds from Issuing Common Stock | Cash received from shareholders. | 2,000,000 |
Repayment of Long-Term Debt | Cash used to repay loans. | 2,500,000 |
Net Cash Used in Financing Activities | | (500,000) |
Net Increase in Cash | | 3,500,000 |
Cash at Beginning of Year | | 1,500,000 |
Cash at End of Year | | 5,000,000 |
Accounting Templates @ Template.net
