Free Bank Financial Statement Analysis
I. Executive Summary
A. Purpose of the Analysis
The purpose of this analysis is to evaluate the financial health and performance of the bank as of the end of fiscal year 2050. This report aims to assess key financial ratios, liquidity, profitability, and risk levels to provide a comprehensive overview of the bank's financial stability. The analysis will also offer recommendations for strategic decisions to improve operational efficiency and capital management.
B. Overview of Key Findings
The bank's financial position remains strong, with a stable asset base and improved profitability compared to previous years. The capital adequacy ratio stands above regulatory requirements, and non-performing loans have decreased, signaling improved asset quality. Liquidity ratios indicate a healthy cash flow situation, though the bank faces increased competition in the digital banking sector.
C. Key Ratios and Metrics Summary
D. Recommendations
The bank should consider expanding its digital services to capture a larger market share of tech-savvy customers. Additionally, the bank should maintain its focus on cost efficiency while continuing to strengthen its loan loss provisions to mitigate future credit risks. It is also recommended to further diversify the bank’s investment portfolio to hedge against market volatility.
II. Introduction
A. Objective of the Financial Statement Analysis
This analysis aims to provide a detailed review of the bank's financial statements for the fiscal year 2050 to understand its current performance and financial health. Key objectives include assessing profitability, liquidity, capital adequacy, and risk management. The report also serves to identify trends and benchmarks to guide future strategic decisions.
B. Scope of the Analysis
The analysis covers the full fiscal year 2050, including all quarterly financial statements and annual reports. Data from previous years (2048-2049) is also included for comparison and trend analysis. Key focus areas are the bank's income statement, balance sheet, cash flow statement, and key financial ratios.
C. Time Period Covered
The time period covered by this analysis is from January 1, 2050, to December 31, 2050. Comparisons with the preceding two fiscal years (2049 and 2048) are included to gauge performance trends over a three-year period. All figures in the analysis reflect year-end values for 2050 unless otherwise specified.
D. Sources of Data
Data for this report has been sourced from the bank’s official financial statements, including the audited balance sheet, income statement, and cash flow statement. Additional insights were gathered from quarterly filings, regulatory disclosures, and internal reports. Benchmarking data was obtained from industry reports and financial databases.
III. Bank Overview
A. General Overview of the Bank
Founded in 1980, the bank has grown to become one of the largest financial institutions in the region, offering a wide range of services, including retail banking, commercial lending, and wealth management. With a robust digital presence, the bank has expanded its customer base to include millennials and Gen Z, who prefer online and mobile banking solutions. The bank operates in over 20 countries and has a significant market share in North America and Europe.
B. Business Model and Key Operations
The bank’s core business model revolves around a diversified portfolio of loans, deposits, and investments, with a strong focus on digital banking and fintech innovations. It has also ventured into sustainable financing, offering green bonds and sustainable investment products. The bank’s wealth management division serves high-net-worth individuals, while its corporate banking division focuses on lending to medium and large businesses.
C. Market Position and Competitive Landscape
As of 2050, the bank holds a top 10 position in the global banking industry. It faces increasing competition from both traditional banking institutions and emerging fintech companies offering digital-only services. Despite this, the bank has managed to maintain its competitive edge through continuous investment in technology and customer service.
D. Key Management and Leadership Team
The bank is led by CEO Anna Rodriguez, who has been with the bank for 15 years. Under her leadership, the bank has adopted a digital-first strategy and expanded into emerging markets. The leadership team is highly experienced, with executives overseeing divisions such as risk management, technology, and sustainability.
IV. Financial Statements Review
A. Balance Sheet
The balance sheet as of December 31, 2050, reflects a stable financial position, with total assets increasing by [00]% year-over-year (YoY). The bank’s capital base has remained strong, and liabilities have increased due to higher customer deposits and borrowings. The asset quality has improved, with non-performing loans (NPLs) declining from [00]% in 2049 to [00]% in 2050.
Balance Sheet (in millions USD)
Assets | Amount (2050) | Amount (2049) |
|---|---|---|
Total Assets | 1,200,000 | 1,120,000 |
B. Income Statement
The income statement for 2050 shows a significant increase in net interest income, driven by higher loan growth and improved lending rates. Non-interest income also rose, mainly due to increased fee income from digital banking services. However, operating expenses increased slightly due to investment in technology and staff expansion.
Income Statement (in millions USD)
Item | Amount (2050) | Amount (2049) |
|---|---|---|
Net Interest Income | 35,000 | 32,000 |
C. Cash Flow Statement
The bank generated positive cash flow from operating activities, reflecting strong income generation. Cash flow from investing activities was negative, reflecting investments in technology and sustainability projects. Financing activities showed an increase in borrowings to support loan growth and expansion.
Cash Flow Statement (in millions USD)
Cash Flow Activity | Amount (2050) | Amount (2049) |
|---|---|---|
Operating Activities | 25,000 | 22,000 |
V. Key Financial Ratios and Metrics
A. Profitability Ratios
The bank achieved a solid return on assets (ROA) of [00]% and return on equity (ROE) of [00]%. Net Interest Margin (NIM) improved to [00]%, benefiting from a higher loan-to-deposit ratio and increased interest rates. These profitability metrics indicate the bank’s strong ability to generate returns from its assets and equity.
B. Liquidity Ratios
The Loan-to-Deposit Ratio (LDR) is [00]%, reflecting a prudent balance between loans and deposits. The Cash Ratio is [00]%, demonstrating strong liquidity to meet short-term obligations. The Current Ratio stands at 1.5, indicating that the bank can easily cover its current liabilities with its current assets.
C. Capital Adequacy Ratios
The bank’s Capital Adequacy Ratio (CAR) stands at [00]%, well above the regulatory minimum of [00]%. The Tier 1 Capital Ratio is [00]%, reflecting a solid base of core capital relative to risk-weighted assets. These ratios highlight the bank’s robust financial stability and capital buffer against potential losses.
VI. Trend Analysis
Key Metric | 2050 | 2049 | 2048 | CAGR (2048-2050) |
|---|---|---|---|---|
Total Assets (in millions USD) | 1,200,000 | 1,120,000 | 1,050,000 | 6.3% |
Net Income (in millions USD) | ||||
Return on Assets (ROA) | ||||
Return on Equity (ROE) | ||||
Net Interest Margin (NIM) | ||||
Loan-to-Deposit Ratio (LDR) | ||||
Non-Performing Loan (NPL) Ratio | ||||
Cost-to-Income Ratio |
A. Financial Performance Trends Over Time
Over the past three years, the bank has shown steady growth in total assets, with a compounded annual growth rate (CAGR) of [00]%. Net income has grown consistently, with a [00]% increase from 2049 to 2050, driven by higher net interest income and non-interest income from digital banking. However, the cost-to-income ratio has slightly increased, reflecting the investment in technology and expansion efforts.
B. Year-over-Year (YoY) Comparison of Key Financial Figures
The bank's total assets increased by [00]% in 2050 compared to 2049, primarily due to an increase in loans and cash equivalents. Net income for 2050 grew by [00]% YoY, reflecting an increase in profitability despite higher operational costs. Return on equity (ROE) improved from [00]% in 2049 to [00]% in 2050, indicating stronger profitability from shareholders' investments.
C. Historical Analysis of Key Ratios and Metrics
A historical analysis shows that the bank's profitability ratios, such as ROA and ROE, have been consistently improving over the last three years. The bank's net interest margin (NIM) has increased steadily from [00]% in 2048 to [00]% in 2050, reflecting more efficient asset management. Liquidity ratios, such as the loan-to-deposit ratio (LDR), have remained well within acceptable thresholds, supporting the bank's ability to manage its obligations.
D. Comparative Analysis with Peers/Industry Standards
Compared to industry peers, the bank’s capital adequacy ratio (CAR) of [00]% is higher than the average CAR of [00]% among leading banks in the region. Similarly, its non-performing loan (NPL) ratio of [00]% is better than the industry average of [00]%, indicating superior asset quality. The bank's ROE of [00]% is also above the industry average of [00]%, demonstrating stronger returns on shareholder equity.
VII. Risk Assessment
A. Credit Risk
Credit risk remains a key concern, though the bank has made significant progress in improving its loan portfolio. Non-performing loans (NPLs) decreased from [00]% in 2049 to [00]% in 2050, signaling better loan quality and improved underwriting standards. The bank’s loan loss provisions are adequate, but it should continue to monitor exposure to sectors vulnerable to economic downturns, such as real estate.
B. Market Risk
The bank faces moderate market risk due to its exposure to interest rate fluctuations and foreign exchange volatility. However, its diversified investment portfolio has helped mitigate potential losses from market downturns. The bank has hedging strategies in place, but it should remain vigilant to market shifts that could impact its returns.
C. Liquidity Risk
The bank has maintained a healthy liquidity position, with the loan-to-deposit ratio (LDR) at [00]% and a cash ratio of [00]%. Despite this, the bank’s increased reliance on digital deposits and short-term funding requires ongoing monitoring of liquidity levels, particularly during periods of market instability. The bank should also consider diversifying its funding sources to reduce liquidity risk.
D. Operational Risk
Operational risk is relatively low, but with ongoing investments in technology and digital banking, the bank must be cautious of cybersecurity risks. The bank has increased its cybersecurity budget by [00]% in 2050 to bolster defenses against potential threats. Additionally, the shift to digital banking models requires constant updates to operational systems to ensure seamless customer experiences and compliance with regulations.
E. Regulatory and Compliance Risk
The bank has maintained strong regulatory compliance, with all capital adequacy and liquidity ratios exceeding regulatory minimums. However, ongoing changes in global banking regulations, particularly related to digital currencies and sustainability reporting, may pose future challenges. The bank is actively engaging with regulators to ensure compliance with evolving financial regulations.
F. Contingent Liabilities and Off-Balance Sheet Risks
The bank has minimal off-balance sheet liabilities, with most contingent liabilities stemming from loan guarantees and other commitments. These off-balance sheet exposures are well-managed and disclosed in the bank’s annual report. The bank should continue to monitor these risks and maintain adequate provisions to cover any potential exposures.
VIII. Conclusion
A. Summary of Key Findings
In 2050, the bank has demonstrated strong financial performance, with significant improvements in profitability, liquidity, and capital adequacy. Non-performing loans have decreased, and the bank’s profitability ratios are above industry averages. While market and operational risks remain, the bank is well-positioned to address these challenges with its solid risk management framework.
B. Assessment of the Bank’s Financial Health
Overall, the bank’s financial health is robust, with a solid capital base, improved profitability, and a prudent approach to risk management. The bank's liquidity position is strong, and its capital ratios exceed regulatory requirements. Despite increased competition and evolving market conditions, the bank’s strategic investments in technology and sustainability will likely continue to support long-term growth.
C. Outlook and Forecast for Future Performance
Looking forward, the bank is expected to maintain its upward trajectory in terms of profitability, with projected net income growth of [00]% annually over the next three years. The digital transformation strategy should drive further revenue growth from tech-savvy customers and digital banking services. However, external factors such as interest rate fluctuations and regulatory changes may impact growth prospects in the short term.
D. Strategic Recommendations
To further strengthen its financial position, it is recommended that the bank continue investing in digital banking capabilities and diversify its revenue streams. The bank should also focus on expanding its sustainable finance offerings to align with global environmental trends. Additionally, enhancing its risk management framework to mitigate market and operational risks will be crucial for sustaining profitability.
- 100% Customizable, free editor
- Access 1 Million+ Templates, photo’s & graphics
- Download or share as a template
- Click and replace photos, graphics, text, backgrounds
- Resize, crop, AI write & more
- Access advanced editor
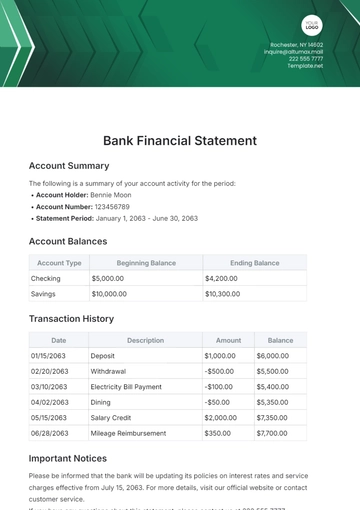
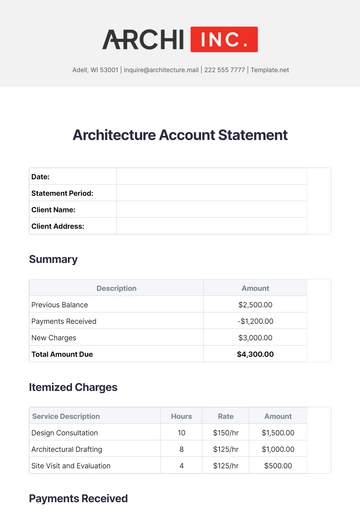
Ensure your bank's financial statement analysis is precise and professional with the Bank Financial Statement Analysis Template from Template.net. Fully editable and customizable, this template allows you to tailor financial data and insights to your specific needs. Plus, with the integrated AI Editor Tool, making updates and adjustments has never been easier or more efficient.
