Free Data Visualization Analyst Resume Template
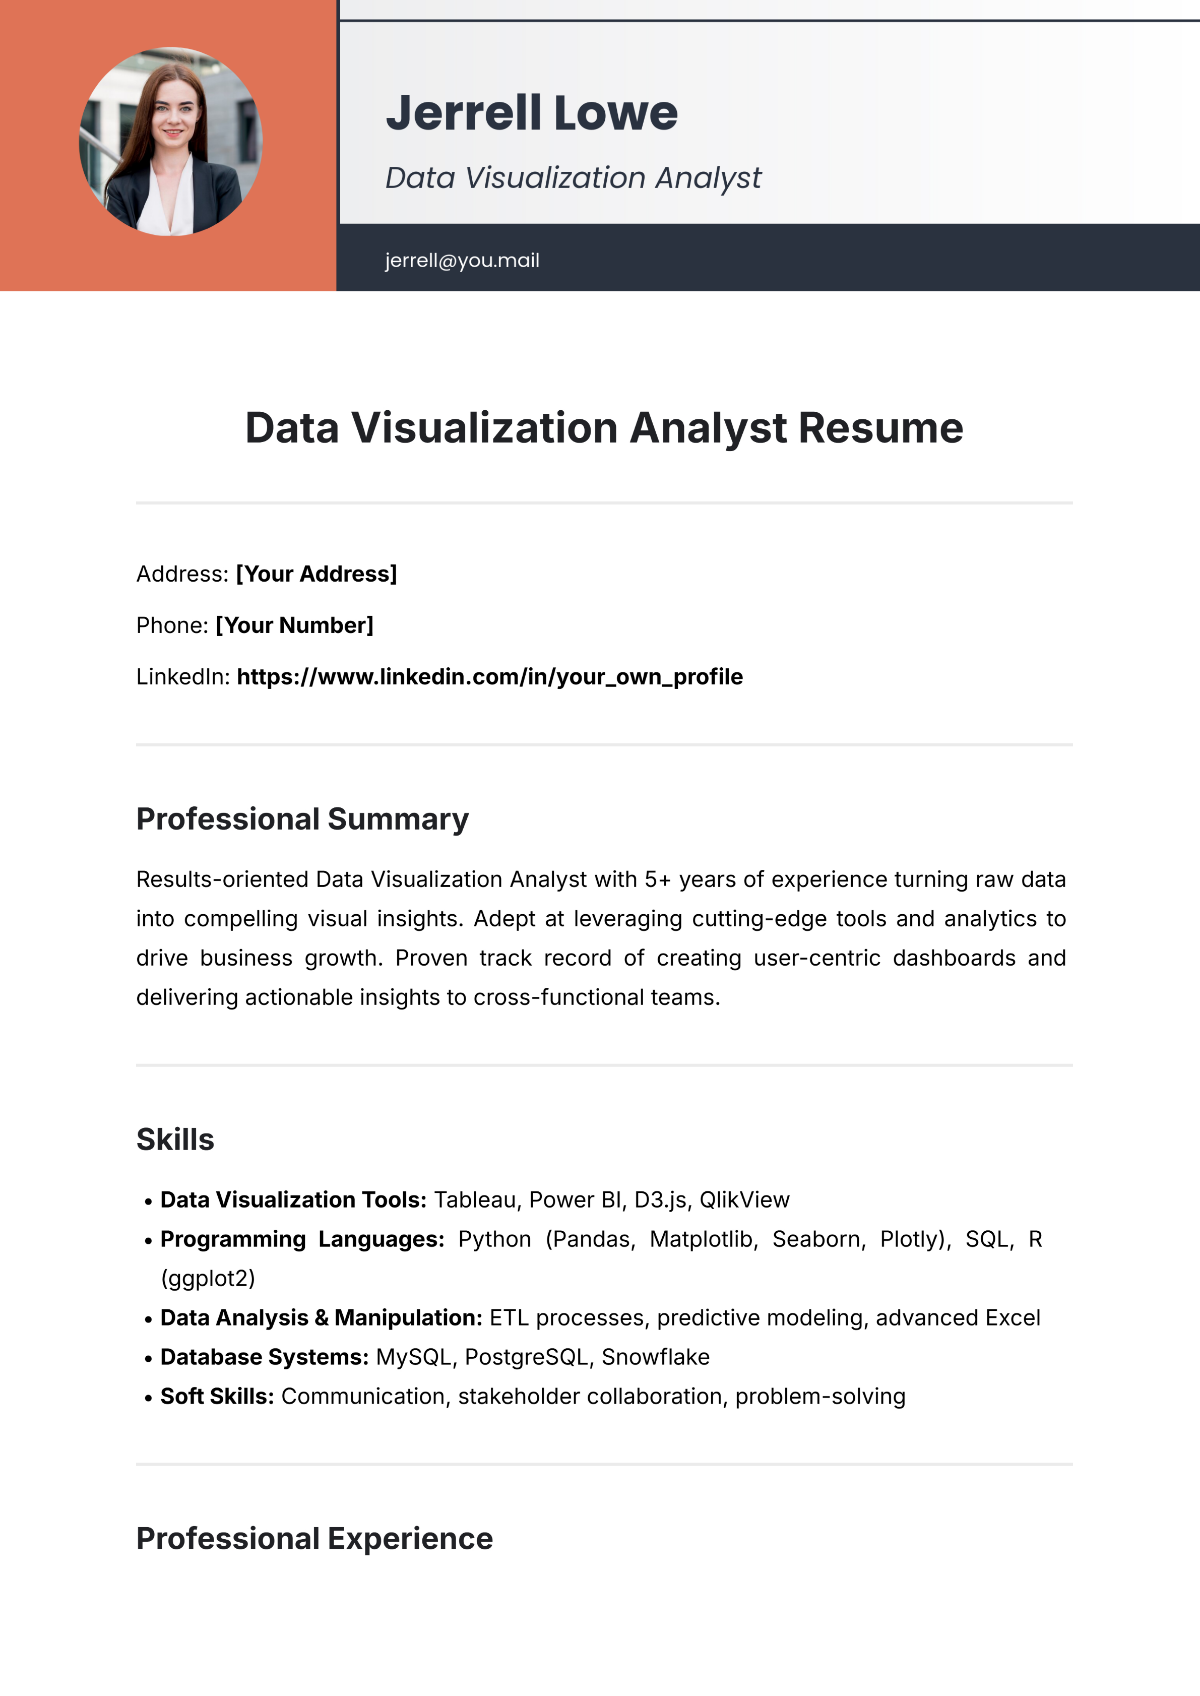
Data Visualization Analyst Resume
Address: [Your Address]
Phone: [Your Number]
LinkedIn: https://www.linkedin.com/in/your_own_profile
Professional Summary
Results-oriented Data Visualization Analyst with 5+ years of experience turning raw data into compelling visual insights. Adept at leveraging cutting-edge tools and analytics to drive business growth. Proven track record of creating user-centric dashboards and delivering actionable insights to cross-functional teams.
Skills
Data Visualization Tools: Tableau, Power BI, D3.js, QlikView
Programming Languages: Python (Pandas, Matplotlib, Seaborn, Plotly), SQL, R (ggplot2)
Data Analysis & Manipulation: ETL processes, predictive modeling, advanced Excel
Database Systems: MySQL, PostgreSQL, Snowflake
Soft Skills: Communication, stakeholder collaboration, problem-solving
Professional Experience
Data Visualization Analyst
Future Analytics Corp. | Jan 2055 – Present | Apex City, CA
Designed and deployed Tableau dashboards for executive reporting, leading to a 25% improvement in decision-making efficiency.
Developed real-time KPI tracking systems that helped reduce operational bottlenecks by 18%.
Automated ETL processes using Python and SQL, reducing manual data preparation time by 40%.
Collaborated with product and marketing teams to visualize customer trends, driving a 12% increase in customer retention.
Trained 20+ team members on best practices for data visualization and analytics tools.
Business Intelligence Analyst
NextGen Insights LLC | May 2051 – Dec 2054 | Horizon City, FL
Built Power BI dashboards that analyzed customer behavior, influencing a 15% growth in subscription renewals.
Created SQL-based ETL pipelines to consolidate data from CRM, sales, and web analytics platforms.
Developed a Python predictive model to forecast quarterly sales with 92% accuracy, enabling better inventory planning.
Presented insights and visualizations to senior management, informing strategic initiatives across departments.
Education
Bachelor of Science in Data Analytics
Bright Futures University | Class of 2050
Relevant Coursework: Data Visualization, Machine Learning, Advanced Statistics, Data Ethics
Certifications
Tableau Desktop Specialist (2052)
Microsoft Certified: Data Analyst Associate (2052)
Google Data Analytics Professional Certificate (2052)
Projects
Customer Churn Prediction Dashboard
Built an interactive Power BI dashboard to track churn indicators, reducing churn rate by 20%.
Utilized Python for data preprocessing and Power BI for visualization.
Sales Forecasting Tool
Designed a predictive sales model in Python, achieving 90% accuracy in monthly revenue predictions.
Visualized findings in Tableau, enhancing sales team planning efficiency.
References
Available upon request.
