How to Calculate Margin of Error in Microsoft Excel
Microsoft Excel simplifies the process of calculating the margin of error, enabling you to measure the accuracy of your statistical…
Apr 24, 2024
Microsoft Excel simplifies calculating the payback period, a crucial metric for assessing investment returns. This guide teaches you to quickly evaluate when an investment will pay back, essential for professionals and students aiming for precise financial insights.
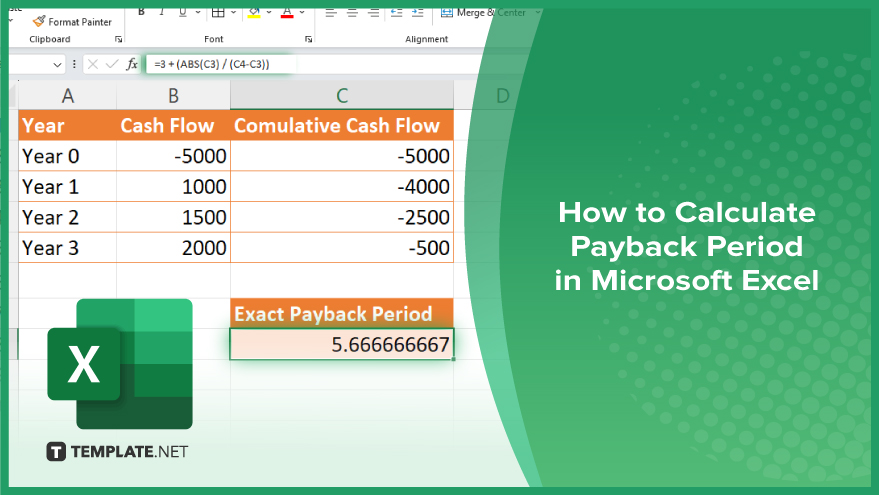
Calculating the payback period in Microsoft Excel is an efficient way to determine the time it takes for an investment to return its initial cost. Follow these straightforward steps to master this essential financial calculation.
Start by inputting your investment data into Excel. In column A, list each year (Year 0, Year 1, Year 2, etc.). In column B, list the corresponding cash flow, starting with the initial investment amount in Year 0 as a negative number (e.g., -5000), followed by the annual cash inflows (e.g., 1000, 1500, 2000).
Locate the cell with the initial investment amount, which is your negative number in column B next to Year 0 (e.g., B1: -5000).
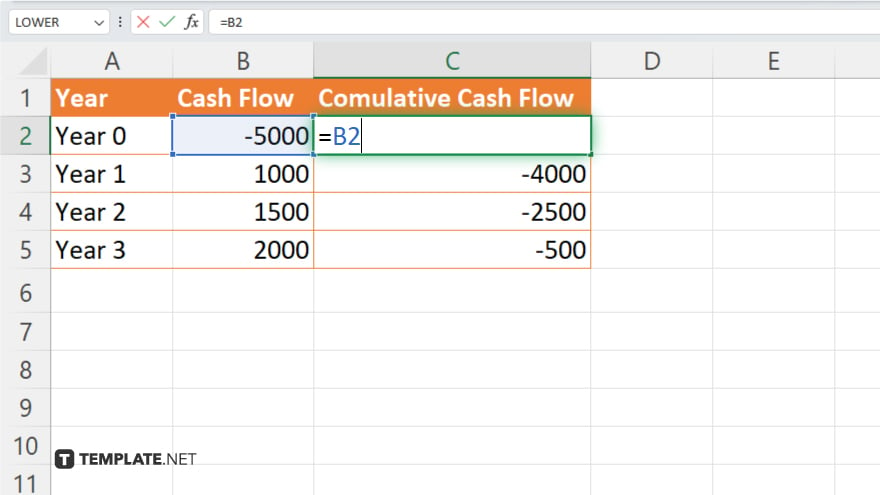
In column C, start calculating the cumulative cash flow. In C2, repeat the initial investment (e.g., =B2).
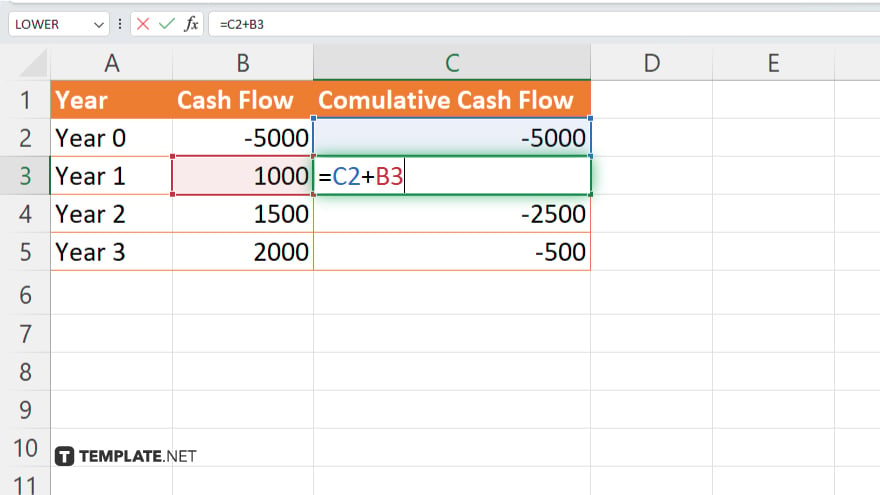
For C3 and the rest, add the current year’s cash flow to the previous year’s cumulative cash flow (e.g., in C3, input =C2+B3). Drag this formula down the column to calculate the cumulative cash flow for each year.
Scan column C to find the first instance where the cumulative cash flow becomes positive. This identifies the year just after the investment starts to pay back. If C4 is the first positive number, the investment starts paying back in Year 3.
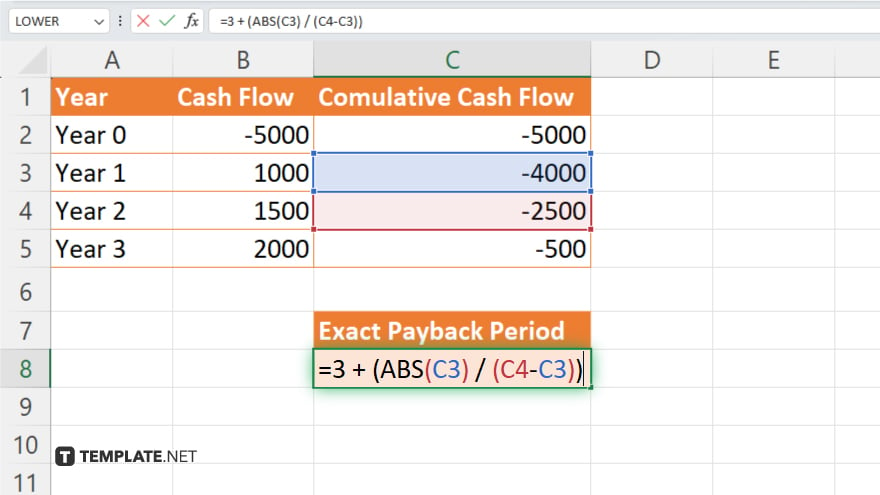
For an exact payback period, you’ll use the cumulative cash flows of the year before and the year of payback. Assuming C3 is the last negative value and C4 is the first positive, the formula in a new cell (e.g., D1) would be: “=3 + (ABS(C3) / (C4-C3)).” This calculates the year before payback and adds the fraction of the year needed to reach a zero cumulative cash flow, giving you the precise payback period.
You may also find valuable insights in the following articles offering tips for Microsoft Excel:
Yes, you can calculate monthly payback periods by listing monthly cash flows and adjusting the final calculation for months instead of years.
If the investment doesn’t pay back within the projected period, the cumulative cash flow will not turn positive in your Excel sheet, indicating the payback period exceeds your projections.
Include negative cash flows in your calculations as they occur; they will extend the payback period by reducing the cumulative cash flow.
Excel doesn’t have a built-in function for the payback period, but you can use formulas and the process outlined to calculate it manually.
Yes. You can create a graph with your cash flows and cumulative cash flows to visually identify the payback period.

Microsoft Excel simplifies the process of calculating the margin of error, enabling you to measure the accuracy of your statistical…
Microsoft Excel users often need to format data within a single cell, and one common requirement is to indent text…
In Microsoft Excel, dealing with infinite columns can be a headache, cluttering your workspace and slowing your workflow.…

Microsoft Excel revolutionizes teamwork by allowing multiple users to edit spreadsheets simultaneously. This collaborative feature streamlines workflow and boosts productivity…
In Microsoft Excel, simplifying data entry just got easier with calendar drop-downs. Learn how to integrate this feature into…

Microsoft Excel users, have you ever encountered the frustration of being unable to edit or interact with a…
Microsoft Excel is not just for crunching numbers—it can also be transformed into a powerful planning tool by integrating interactive…

Microsoft Excel users, are you struggling to effectively visualize your data? In this article, we’ll show you how…
Microsoft Excel provides versatile tools to refine your data, including removing leading characters from cell values. This skill is crucial…