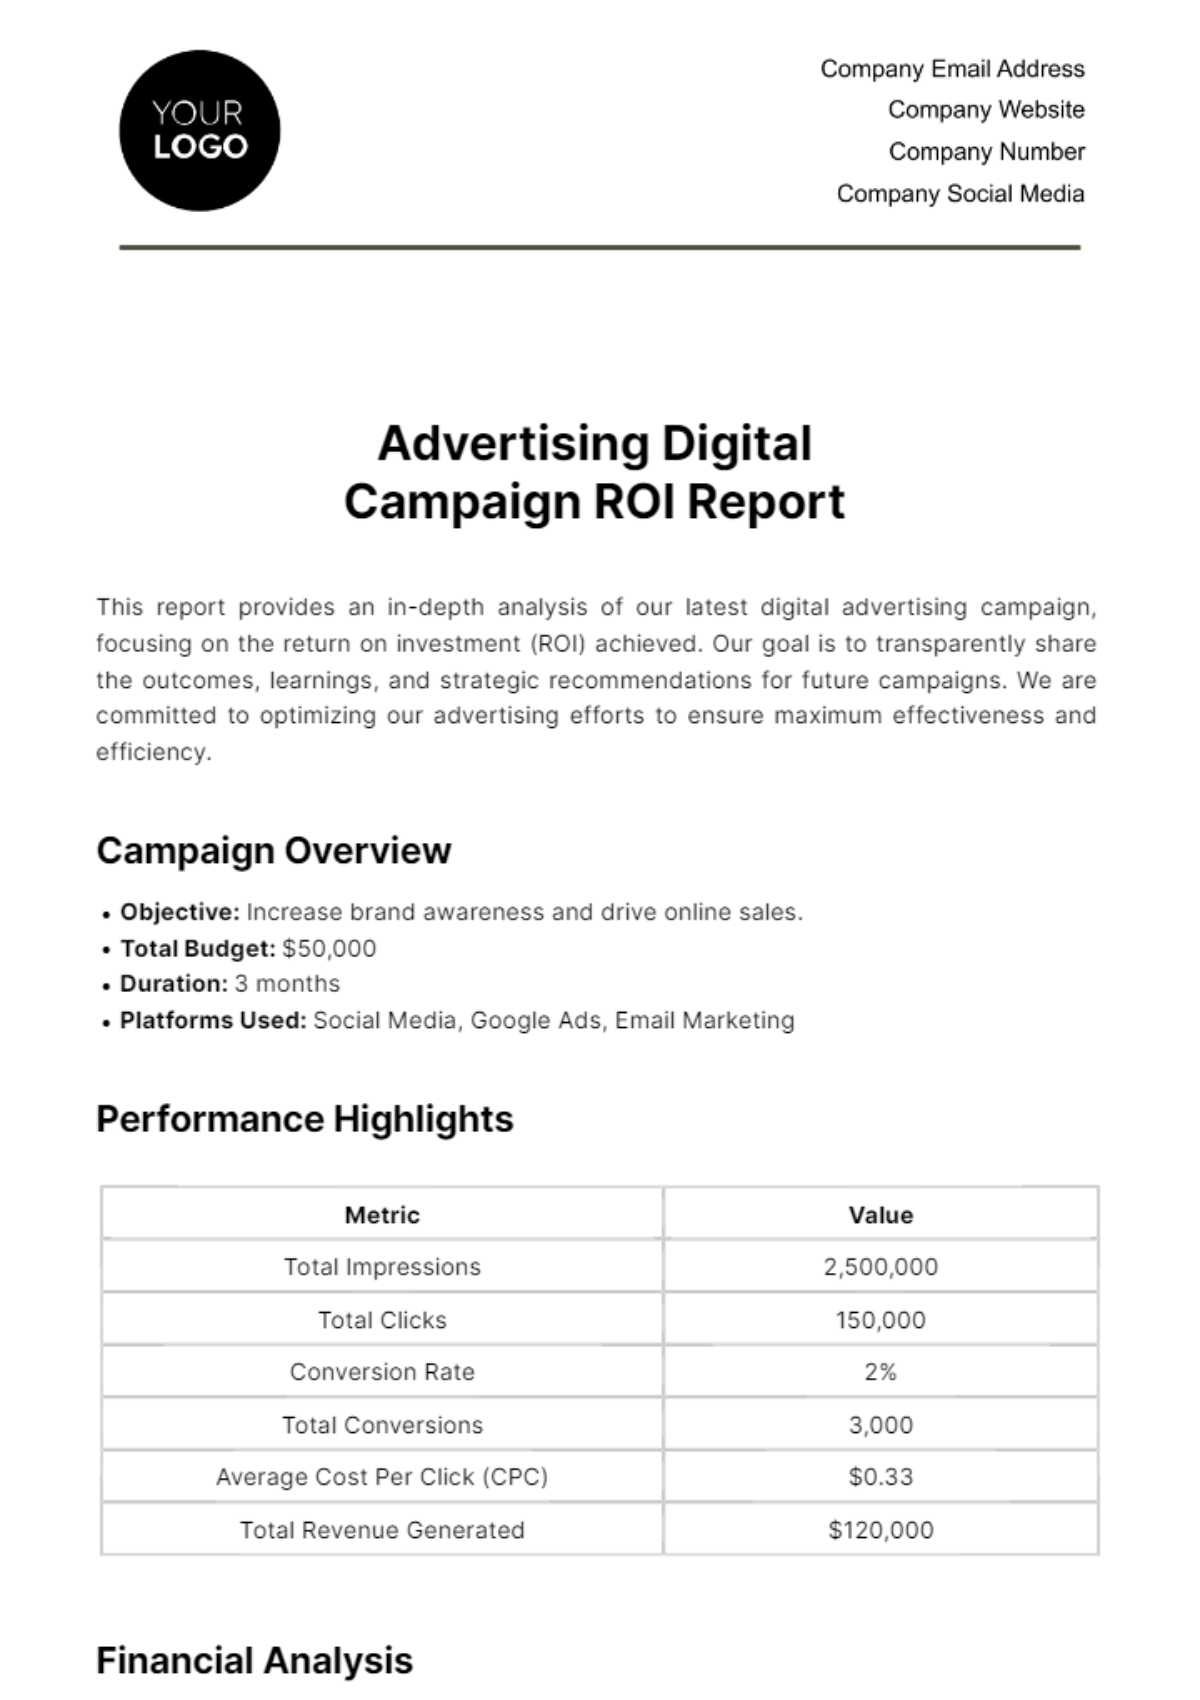
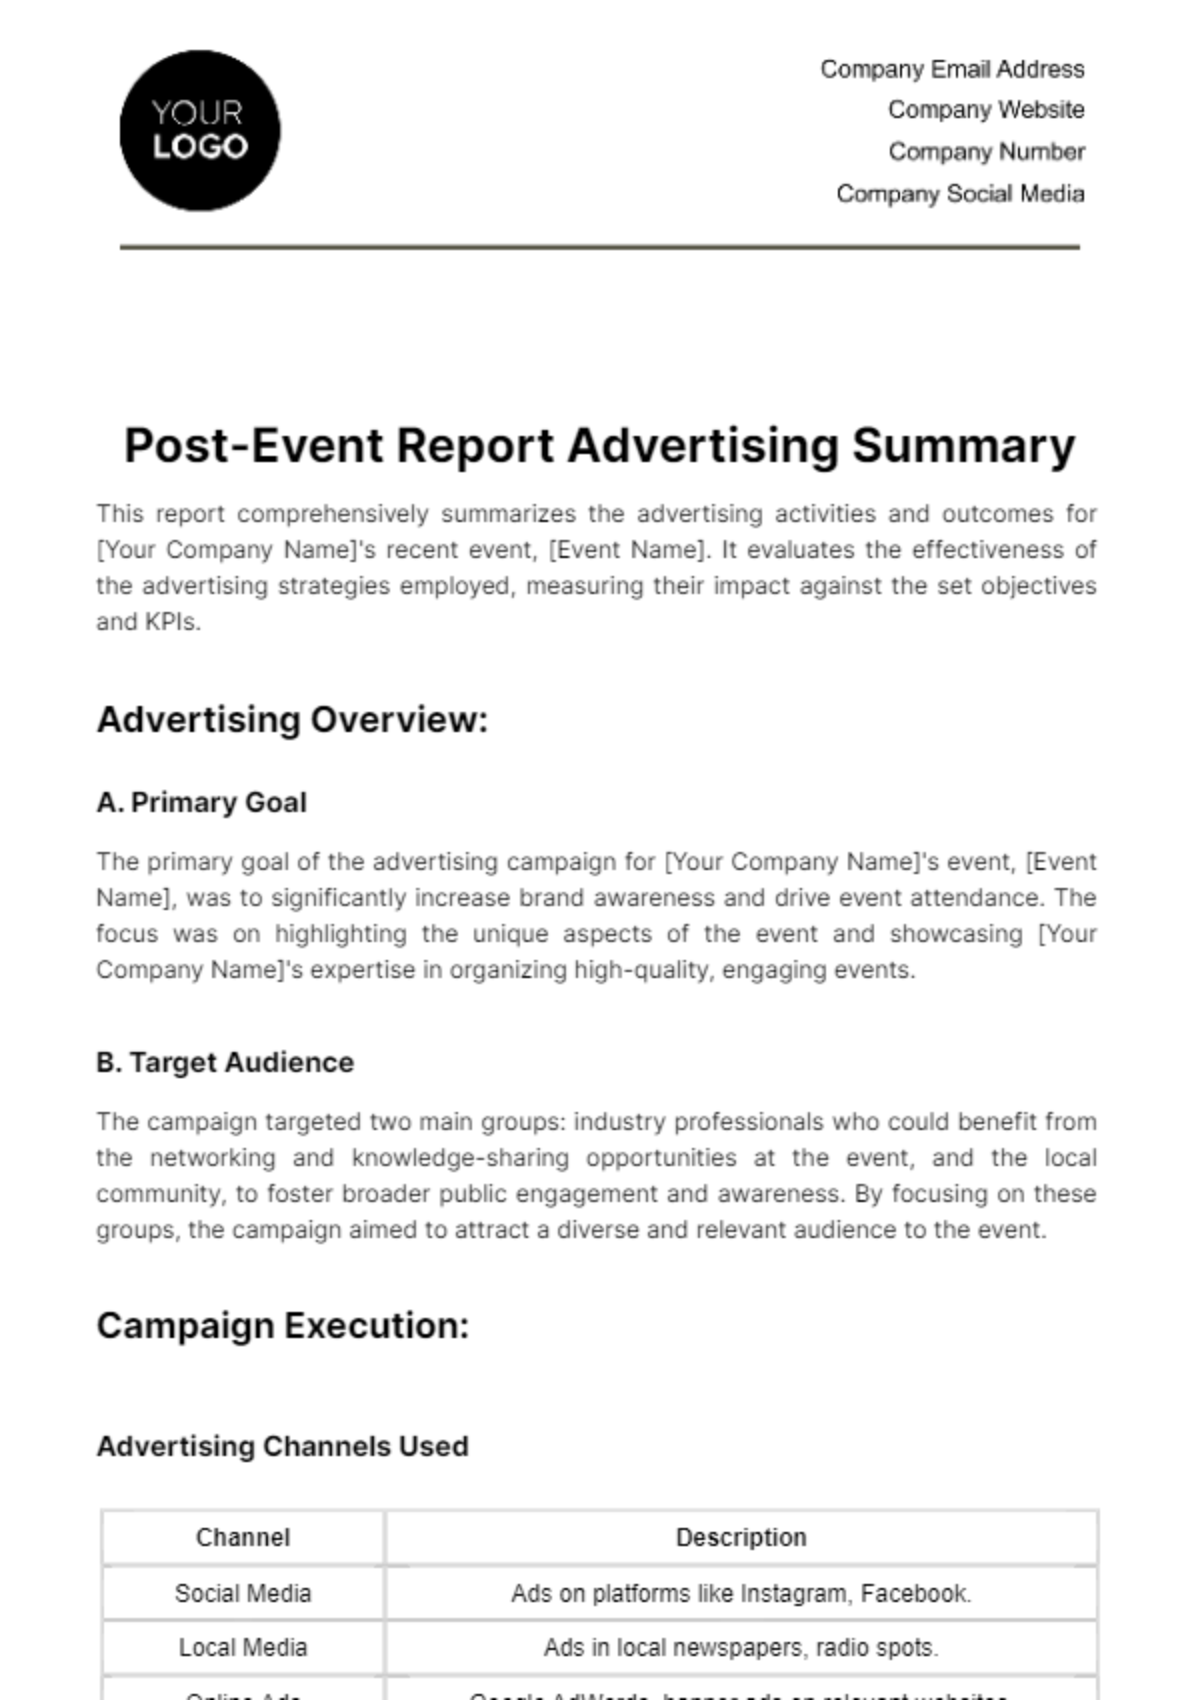
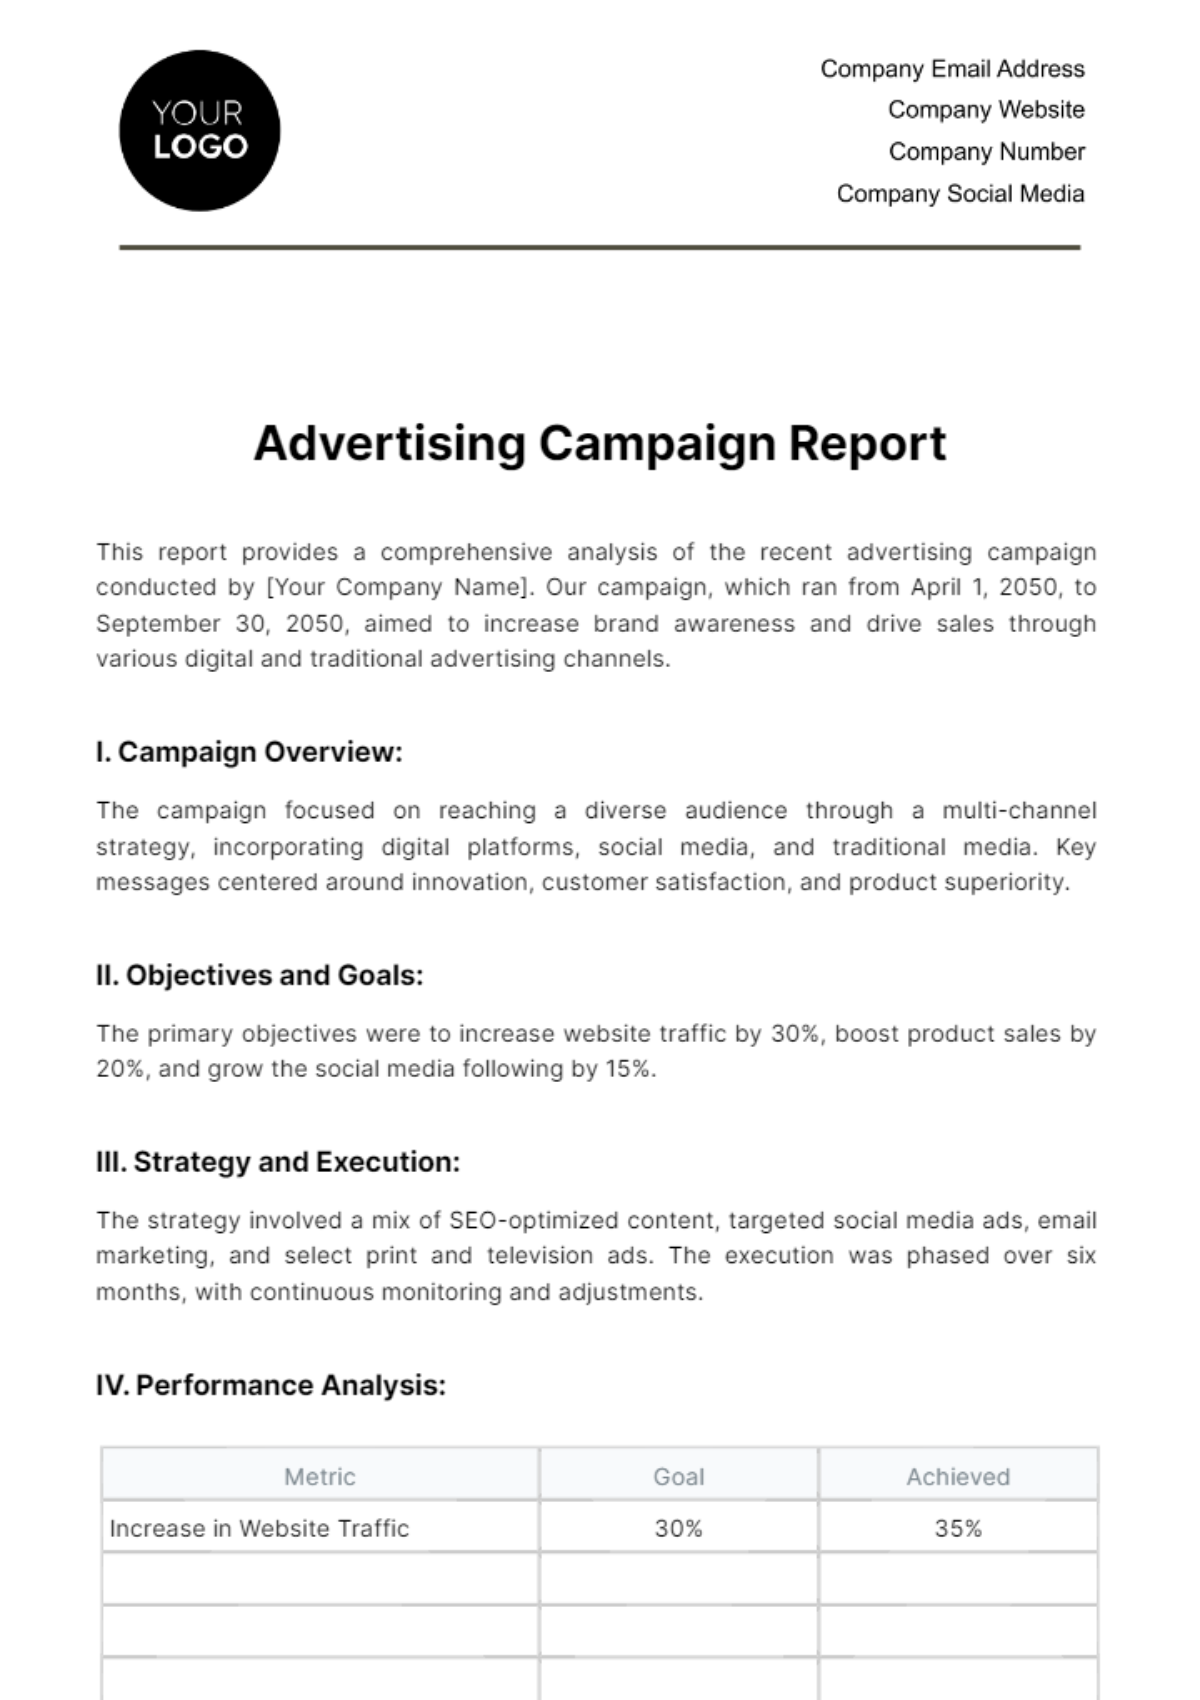
This report provides a detailed analysis of the recent digital advertising campaign conducted by [Your Company Name]. The campaign, aimed at increasing brand awareness and driving sales, ran from [Month Day, Year], to [Month Day, Year].
I. Campaign Overview
The following table showcases the campaign details:
Campaign Name: | [Campaign Name] |
Duration: | [Month Day, Year] to [Month Day, Year] |
Total Budget: | [$000,000] |
Platforms Use: | [Google Ads, Facebook, Instagram and LinkedIn] |
The campaign was structured to maximize reach and engagement across various digital platforms, utilizing both organic and paid strategies. The primary focus was on leveraging data-driven insights to optimize ad performance throughout the campaign duration.
II. Audience Demographics
The demographics are outlined in the table below:
Age Group | Percentage |
18-24 | 15% |
25-34 | |
35-44 | |
45-54 | |
55+ |
The campaign's success among the [25-34 age group] indicates a strong alignment of the product with this demographic's preferences. The geographical concentration in urban areas suggests potential for expansion into suburban and rural markets.
III. Performance Metrics
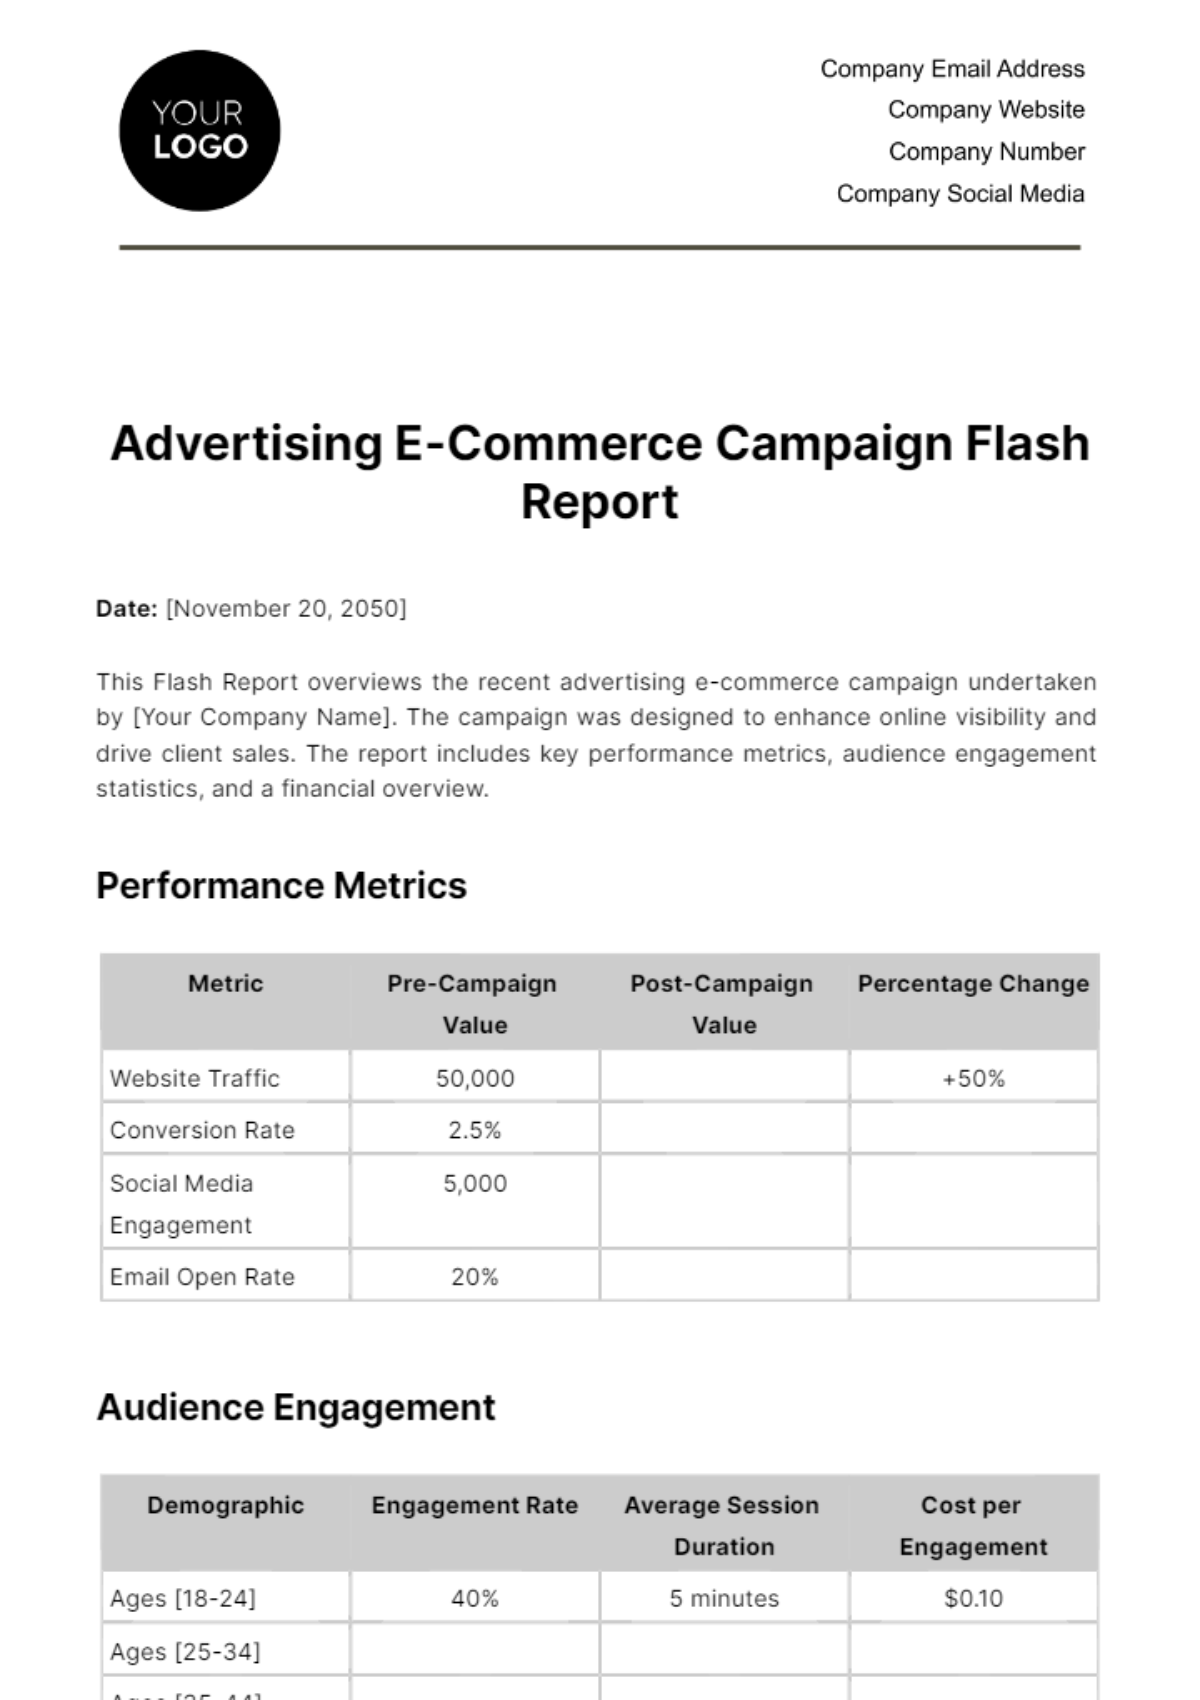
Each metric and value are showcased in the following table:
Metric | Value |
Impressions | 2,000,000 |
Clicks | |
Conversion Rate | |
Average CTR | |
ROAS |
The high CTR and conversion rate reflect the campaign's effective targeting and compelling ad creatives. A Return on Ad Spend of [120%] indicates a positive return, surpassing the initial projections.
Here is the breakdown per platform:
Platform | Impressions | Clicks | CTR |
Google Ads | 800,000 | 120,000 | 15% |
Each platform contributed uniquely to the campaign's success, with [Google Ads] leading in impressions and [Facebook] in CTR.
IV. Budget Allocation and ROI
The table below showcases the allocated budget per platform:
Platform | Budget Allocation | Spent Amount | Percentage of Total Budget |
Google Ads | 40% | $200,000 | 40% |
The budget allocation was strategically designed to optimize reach and engagement across different platforms. [Google Ads] received the largest share due to its wide reach and robust targeting options.
The total Total Revenue Generated is [$600,000]. This ROI demonstrates the campaign's effectiveness in not only reaching but also converting the target audience. The positive ROI is a clear indicator of the campaign's success in terms of financial performance.
V. Campaign Effectiveness
A. Strengths
High engagement and conversion rates in the [25-34 age group].
Strong performance on [Facebook and Instagram] in terms of CTR.
The effectiveness in this demographic indicates a strong market fit for the product.
The high CTR on [Facebook and Instagram] shows successful creative design and targeting.
B. Areas for Improvement
Increase [LinkedIn] engagement and conversion rates.
Explore new platforms for audience expansion.
Strategies for improving [LinkedIn] performance could include more tailored content and professional targeting.
Investigating emerging platforms and trends could provide new opportunities for audience engagement.
VI. Recommendations for Future Campaigns
Here are suggested actions:
Targeted Content for [35-44 Age Group]: Increase focus on this demographic with tailored content.
Enhanced [LinkedIn] Strategy: Develop a more engaging content strategy for LinkedIn.
A/B Testing for Ad Creatives: Implement A/B testing to determine the most effective ad creatives.
Budget Reallocation: Consider reallocating more budget towards higher performing platforms.
VII. Conclusion
[Campaign Name] had successfully met its objectives of increasing website traffic and boosting sales. Key takeaways include the importance of demographic targeting and platform-specific strategies. Continued monitoring and adaptation will be necessary for future campaigns to maintain and enhance these results. This campaign sets a benchmark for future digital marketing endeavors by [Your Company Name].
