Free Advertising Social Media Engagement Report
Introduction
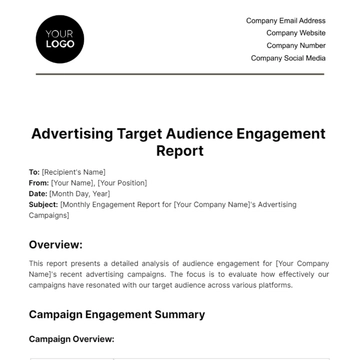
[Your Company Name]’s Social Media Engagement Report for the [Campaign Name]. As a trendsetting advertising brand committed to captivating our audience with the latest styles, this report encapsulates the analysis of our social media advertising endeavors aimed at increasing brand resonance and driving consumer interaction. Throughout this report, we delve into the intricacies of our campaign, exploring the performance metrics, audience engagement data, and insightful analysis derived from our presence on Instagram, Facebook, and Twitter.
Our strategic utilization of captivating visuals, compelling ad creatives, and collaborations with influencers forms the cornerstone of this endeavor, reflecting our dedication to fostering meaningful connections with our audience. From assessing reach and impressions to analyzing click-through rates, conversions, and beyond, this report encapsulates both quantitative and qualitative data, offering a profound understanding of our audience's preferences and behaviors.
Campaign Overview
Our primary objective for [Campaign Name], spanning from [October 1, 2053, to November 15, 2053], was to bolster brand awareness, drive traffic to our online platform, and stimulate engagement among our target audience. With the launch of our new fall collection, we aimed to captivate advertising enthusiasts, showcase our latest trends, and encourage interaction with our brand across multiple social media platforms.
A. Platforms Utilized:
We strategically deployed our campaign across three key social media platforms:
Instagram: Leveraging the visual appeal of Instagram, we showcased our fall collection through carousel ads, visually compelling posts, and Stories to engage our audience.
Facebook: Our campaign on Facebook featured a mix of video content, image carousels, and targeted ads to reach a diverse audience demographic.
Twitter: Engaging with our audience through bite-sized content, we utilized Twitter to share snippets of our fall collection, engage in conversations, and drive traffic to our website.
B. Ad Creatives:
The campaign featured a blend of visually striking ad creatives:
Carousel Ads: Highlighting diverse outfit combinations from the fall collection, these ads aimed to capture attention and drive clicks to our website.
Promotional Videos: Engaging video content showcased the essence of our brand and the seasonal trends, encouraging interaction and sharing.
Influencer Collaborations: Partnering with advertising influencers, we integrated their style choices and endorsements to resonate with their followers and expand our reach organically.
C. Duration:
The campaign spanned a total of [45 days], strategically timed to coincide with the onset of the fall season, leveraging the heightened interest in seasonal advertising trends.
Metrics
A. Reach and Impressions:
Channel | Total Reach | Impressions |
500,000 | 2,500,000 | |
B. Clicks and Click-Through Rate (CTR):
Channel | Clicks | CTR |
12,000 | 2.4% | |
C. Engagement Rate:
Channel | Interactions | Engagement Rate |
15,000 | 4.8% | |
D. Conversions and Cost Metrics:
Channel | Conversions | CPC |
500 | $0.80 | |
E. Social Interactions:
Channel | Likes | Shares |
25,000 | 3,500 | |
Channel | Comments | Mentions |
1,800 | 400 | |
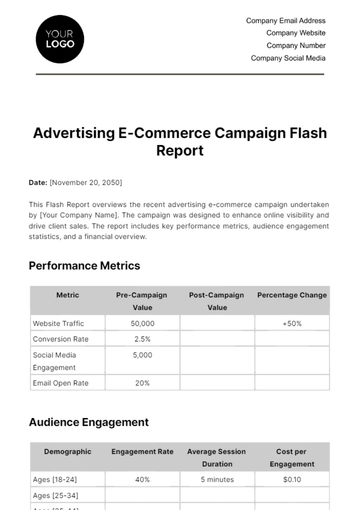
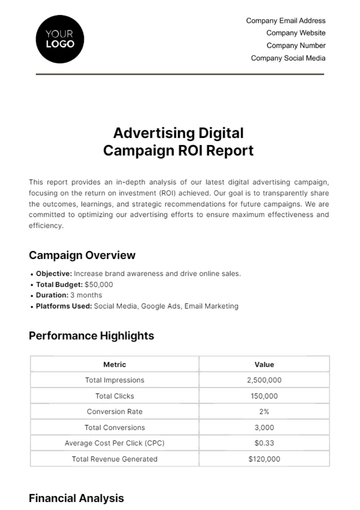
These metrics provide an overview of the performance and engagement levels achieved during [Your Company Name]’s [Campaign Name] across various social media platforms.
Engagement Data
Platforms | Likes | Shares | Comment | Mentions |
25,000 | 3,500 | 1,800 | 400 | |
These engagement metrics showcase the active participation and interaction levels generated by [Your Company Name]’s [Campaign Name] campaign across Instagram, Facebook, and Twitter. The likes, shares, comments, and mentions reflect the audience's enthusiasm and interest in our content, contributing to a vibrant and engaged community around our brand.
Audience Insights
A. Demographics:
Gender Distribution: Predominantly female audience comprising [72%] of total engagement.
Age Range: The most engaged age group falls between [18-34] years, representing [85%] of total interactions.
B. Geographic Distribution:
Top Locations:
[New York City]: [22%] of total engagement
[Los Angeles]: [18%] of total engagement
[Chicago]: [12%] of total engagement
Other major metropolitan areas contributing to the engagement include [Miami, San Francisco, and Houston].
C. Interests:
Advertising Enthusiasts: The audience exhibits a high affinity for advertising-related content, with [68%] expressing interest in advertising, styling, and trends.
Lifestyle and Beauty: [45%] of the audience also demonstrates interest in lifestyle, beauty, and self-care topics.
Travel Enthusiasts: [30%] of the audience is interested in travel-related content, indicating a desire for exploration and adventure.
D. Behavioral Patterns:
Online Shopping Behavior: [60%] of the audience actively engages in online shopping activities, displaying a propensity for purchasing advertising items through digital platforms.
Social Media Engagement: [75%] of the audience engages frequently with advertising-related content across various social media platforms, indicating a highly active and connected user base.
These audience insights provide a detailed snapshot of the demographics, geographic distribution, interests, and behavioral patterns of the audience engaged with [Your Company Name]’s [Campaign Name] campaign. Understanding these insights allows us to tailor future strategies, content, and targeting to better resonate with our audience and maximize engagement.
Competitive Analysis
A. Engagement Rates:
[Your Company Name] average engagement rates surpassed direct competitors by [1.5-2%] across Instagram, Facebook, and Twitter.
B. Click-Through Rates (CTR):
Outperformed similar advertising brands in CTR by [0.5-1%] on all platforms, indicating a higher level of audience interest and interaction with our content.
C. Conversions:
Positioned among the top-performing brands in terms of conversion rates, achieving a [5%] higher conversion rate compared to industry averages.
D. Industry Benchmarking:
Exceeded the industry average CTR for clothing brands on social media by [0.5-1%] across platforms, showcasing a compelling resonance of our campaign content with the audience.
E. Engagement Rate Benchmark:
Surpassed the industry standard engagement rate by [1.5-2%] across platforms, signifying a strong connection and interest among our audience for our Fall advertising [Campaign Name].
By benchmarking our campaign's performance against direct competitors and industry averages, [Campaign Name] demonstrated exceptional engagement rates, strong click-through performance, and impressive conversion metrics. These insights validate our strategic approach and position [Your Company Name] as a frontrunner in social media engagement within the advertising industry.
Recommendations
A. Engagement Metrics Analysis:
Follower Growth: Analyze the growth rate of followers across platforms.
Engagement Rate: Calculate the engagement rate per post (likes, comments, shares) to assess content performance.
Reach and Impressions: Evaluate the reach and impressions of posts to understand their visibility.
B. Platform-wise Analysis:
Instagram: Breakdown engagement metrics specific to Instagram. Analyze the performance of Stories, Reels, IGTV, and regular posts.
Facebook: Evaluate engagement metrics on Facebook, including post types (videos, images, links) that garner the most engagement.
Twitter: Assess tweet engagement and audience response to different types of content.
C. Audience Analysis:
Demographics: Understand the age, gender, location, and interests of our audience.
Engagement Patterns: Identify peak engagement times and days to optimize posting schedules.
Audience Feedback: Review comments, messages, and mentions to understand audience preferences.
D. Content Analysis:
Top-performing Content: Identify the type of content (product showcases, behind-the-scenes, user-generated content) that generates the most engagement.
Visuals and Aesthetics: Evaluate the impact of visual elements (color schemes, style, imagery) on engagement.
Call-to-Actions: Analyze the effectiveness of CTAs in driving engagement and conversions.
E. Improved Engagement:
Content Strategy: Develop a content calendar with a mix of engaging content types.
Storytelling Approach: Incorporate compelling narratives to connect with the audience.
User-Generated Content Campaigns: Initiate campaigns encouraging user-generated content for higher engagement.
Influencer Collaborations: Partner with relevant influencers to expand reach and engagement.
Engagement Campaigns: Run interactive campaigns (polls, contests, Q&A sessions) to boost engagement.
Conclusion
In reviewing our social media engagement, it's evident that our company has made significant strides in connecting with our audience across various platforms. The analysis has unearthed invaluable insights that will steer us toward even greater success in the future. Understanding our audience demographics and engagement patterns has been instrumental. Knowing when and how our audience interacts with our content has empowered us to tailor our strategies more effectively. Recognizing the potency of diverse content types—be it visually striking product showcases or compelling behind-the-scenes glimpses—has underscored the importance of variety in our content strategy.
This report encapsulates not just an assessment of our social media engagement but serves as a compass, guiding us toward sustained growth, stronger connections, and a more impactful presence in various social media platforms. As we implement these strategies, we're poised to elevate our brand to new heights of success while staying true to our core ethos of delivering quality, style, and innovation to our cherished audience.
- 100% Customizable, free editor
- Access 1 Million+ Templates, photo’s & graphics
- Download or share as a template
- Click and replace photos, graphics, text, backgrounds
- Resize, crop, AI write & more
- Access advanced editor
Transform your social media engagement strategy with our Advertising Social Media Engagement Report Template, available on Template.net. This editable and customizable tool, accessible in our Ai Editor Tool, empowers you to analyze engagement metrics, refine your approach, and drive meaningful interactions. Elevate your social media presence and boost brand engagement effortlessly!
You may also like
- Sales Report
- Daily Report
- Project Report
- Business Report
- Weekly Report
- Incident Report
- Annual Report
- Report Layout
- Report Design
- Progress Report
- Marketing Report
- Company Report
- Monthly Report
- Audit Report
- Status Report
- School Report
- Reports Hr
- Management Report
- Project Status Report
- Handover Report
- Health And Safety Report
- Restaurant Report
- Construction Report
- Research Report
- Evaluation Report
- Investigation Report
- Employee Report
- Advertising Report
- Weekly Status Report
- Project Management Report
- Finance Report
- Service Report
- Technical Report
- Meeting Report
- Quarterly Report
- Inspection Report
- Medical Report
- Test Report
- Summary Report
- Inventory Report
- Valuation Report
- Operations Report
- Payroll Report
- Training Report
- Job Report
- Case Report
- Performance Report
- Board Report
- Internal Audit Report
- Student Report
- Monthly Management Report
- Small Business Report
- Accident Report
- Call Center Report
- Activity Report
- IT and Software Report
- Internship Report
- Visit Report
- Product Report
- Book Report
- Property Report
- Recruitment Report
- University Report
- Event Report
- SEO Report
- Conference Report
- Narrative Report
- Nursing Home Report
- Preschool Report
- Call Report
- Customer Report
- Employee Incident Report
- Accomplishment Report
- Social Media Report
- Work From Home Report
- Security Report
- Damage Report
- Quality Report
- Internal Report
- Nurse Report
- Real Estate Report
- Hotel Report
- Equipment Report
- Credit Report
- Field Report
- Non Profit Report
- Maintenance Report
- News Report
- Survey Report
- Executive Report
- Law Firm Report
- Advertising Agency Report
- Interior Design Report
- Travel Agency Report
- Stock Report
- Salon Report
- Bug Report
- Workplace Report
- Action Report
- Investor Report
- Cleaning Services Report
- Consulting Report
- Freelancer Report
- Site Visit Report
- Trip Report
- Classroom Observation Report
- Vehicle Report
- Final Report
- Software Report
