Free Business Financial Report

I. Executive Summary
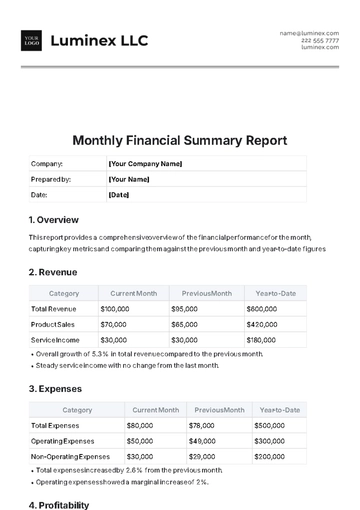
[Your Company Name] is pleased to present the financial report for the fiscal year 2050. This report provides a comprehensive overview of our financial performance, highlighting key metrics, trends, and insights to inform stakeholders and guide strategic decisions.
Key Highlights
Revenue: $25 million (increase of 10% from previous year)
Net Profit: $5 million (net profit margin of 20%)
EBITDA: $7 million (EBITDA margin of 28%)
Total Assets: $50 million
Equity: $30 million
II. Financial Statements
A. Income Statement
Item | 2050 | 2049 |
|---|---|---|
Revenue | $25,000,000 | $22,500,000 |
Cost of Goods Sold | $10,000,000 | $9,500,000 |
Gross Profit | $15,000,000 | $13,000,000 |
Operating Expenses | $8,000,000 | $7,500,000 |
Operating Income | $7,000,000 | $5,500,000 |
Net Profit | $5,000,000 | $3,800,000 |
B. Balance Sheet
Item | 2050 | 2049 |
|---|---|---|
Total Assets | $50,000,000 | $45,000,000 |
Total Liabilities | $20,000,000 | $18,000,000 |
Equity | $30,000,000 | $27,000,000 |
C. Cash Flow Statement
Item | 2050 | 2049 |
|---|---|---|
Cash Flow from Operating Activities | $6,000,000 | $5,500,000 |
Cash Flow from Investing Activities | -$2,000,000 | -$1,500,000 |
Cash Flow from Financing Activities | $1,500,000 | $1,000,000 |
Net Increase in Cash | $5,500,000 | $5,000,000 |
III. Financial Analysis
A. Ratio Analysis
Ratio | 2050 | 2049 |
|---|---|---|
Current Ratio | 2.5 | 2.3 |
Quick Ratio | 1.8 | 1.7 |
Debt to Equity Ratio | 0.67 | 0.67 |
Return on Assets (ROA) | 10% | 8.4% |
Return on Equity (ROE) | 16.7% | 14.1% |
B. Trend Analysis
Revenue Growth: Consistent increase in revenue over the past five years, averaging 8% annual growth.
Expense Management: Operating expenses have been kept under control, increasing by only 6% annually on average.
IV. Strategic Initiatives
A. Market Expansion
[Your Company Name] plans to expand into new markets, including Asia and South America, to diversify revenue streams and reduce dependency on current markets.
B. Product Innovation
Investment in research and development will continue to be a priority, with a focus on launching innovative products that meet emerging customer needs.
C. Operational Efficiency
Initiatives to improve operational efficiency, including automation and process optimization, are expected to reduce costs and increase profitability.
V. Future Outlook
A. Economic Environment
The global economic outlook for 2051 is positive, with expected GDP growth of 3%. This favorable environment is expected to benefit [Your Company Name]'s operations and financial performance.
B. Financial Projections
Metric | 2051 (Projected) |
|---|---|
Revenue | $28,000,000 |
Net Profit | $6,500,000 |
EBITDA | $8,000,000 |
Total Assets | $55,000,000 |
Equity | $33,000,000 |
VI. Charts and Graphs
Revenue Breakdown (2050)
[Product A] contributed the largest share of revenue, accounting for 40% of total sales with $10,000,000. [Product B] followed closely behind, comprising 30% of sales at $7,500,000. [Product C] contributed $5,000,000, representing 20% of total revenue. The remaining 10% came from other sources, totaling $2,500,000.
This breakdown underscores the significance of [Product A] in driving overall revenue, with [Product B] also playing a substantial role.
Yearly Revenue and Profit Growth (2046-2050)
Over the five-year period from 2046 to 2050, [Your Company Name] consistently demonstrated robust growth in both revenue and net profit. Starting at $18 million in revenue and $2.5 million in net profit in 2046, the company steadily increased its financial performance each year. By 2050, revenue soared to $25 million, accompanied by a net profit of $5 million.
This upward trajectory underscores the company's effective strategies and strong market position, driving sustained and substantial financial growth.
- 100% Customizable, free editor
- Access 1 Million+ Templates, photo’s & graphics
- Download or share as a template
- Click and replace photos, graphics, text, backgrounds
- Resize, crop, AI write & more
- Access advanced editor
You may also like
- Sales Report
- Daily Report
- Project Report
- Business Report
- Weekly Report
- Incident Report
- Annual Report
- Report Layout
- Report Design
- Progress Report
- Marketing Report
- Company Report
- Monthly Report
- Audit Report
- Status Report
- School Report
- Reports Hr
- Management Report
- Project Status Report
- Handover Report
- Health And Safety Report
- Restaurant Report
- Construction Report
- Research Report
- Evaluation Report
- Investigation Report
- Employee Report
- Advertising Report
- Weekly Status Report
- Project Management Report
- Finance Report
- Service Report
- Technical Report
- Meeting Report
- Quarterly Report
- Inspection Report
- Medical Report
- Test Report
- Summary Report
- Inventory Report
- Valuation Report
- Operations Report
- Payroll Report
- Training Report
- Job Report
- Case Report
- Performance Report
- Board Report
- Internal Audit Report
- Student Report
- Monthly Management Report
- Small Business Report
- Accident Report
- Call Center Report
- Activity Report
- IT and Software Report
- Internship Report
- Visit Report
- Product Report
- Book Report
- Property Report
- Recruitment Report
- University Report
- Event Report
- SEO Report
- Conference Report
- Narrative Report
- Nursing Home Report
- Preschool Report
- Call Report
- Customer Report
- Employee Incident Report
- Accomplishment Report
- Social Media Report
- Work From Home Report
- Security Report
- Damage Report
- Quality Report
- Internal Report
- Nurse Report
- Real Estate Report
- Hotel Report
- Equipment Report
- Credit Report
- Field Report
- Non Profit Report
- Maintenance Report
- News Report
- Survey Report
- Executive Report
- Law Firm Report
- Advertising Agency Report
- Interior Design Report
- Travel Agency Report
- Stock Report
- Salon Report
- Bug Report
- Workplace Report
- Action Report
- Investor Report
- Cleaning Services Report
- Consulting Report
- Freelancer Report
- Site Visit Report
- Trip Report
- Classroom Observation Report
- Vehicle Report
- Final Report
- Software Report
