Payroll Report For Production Team
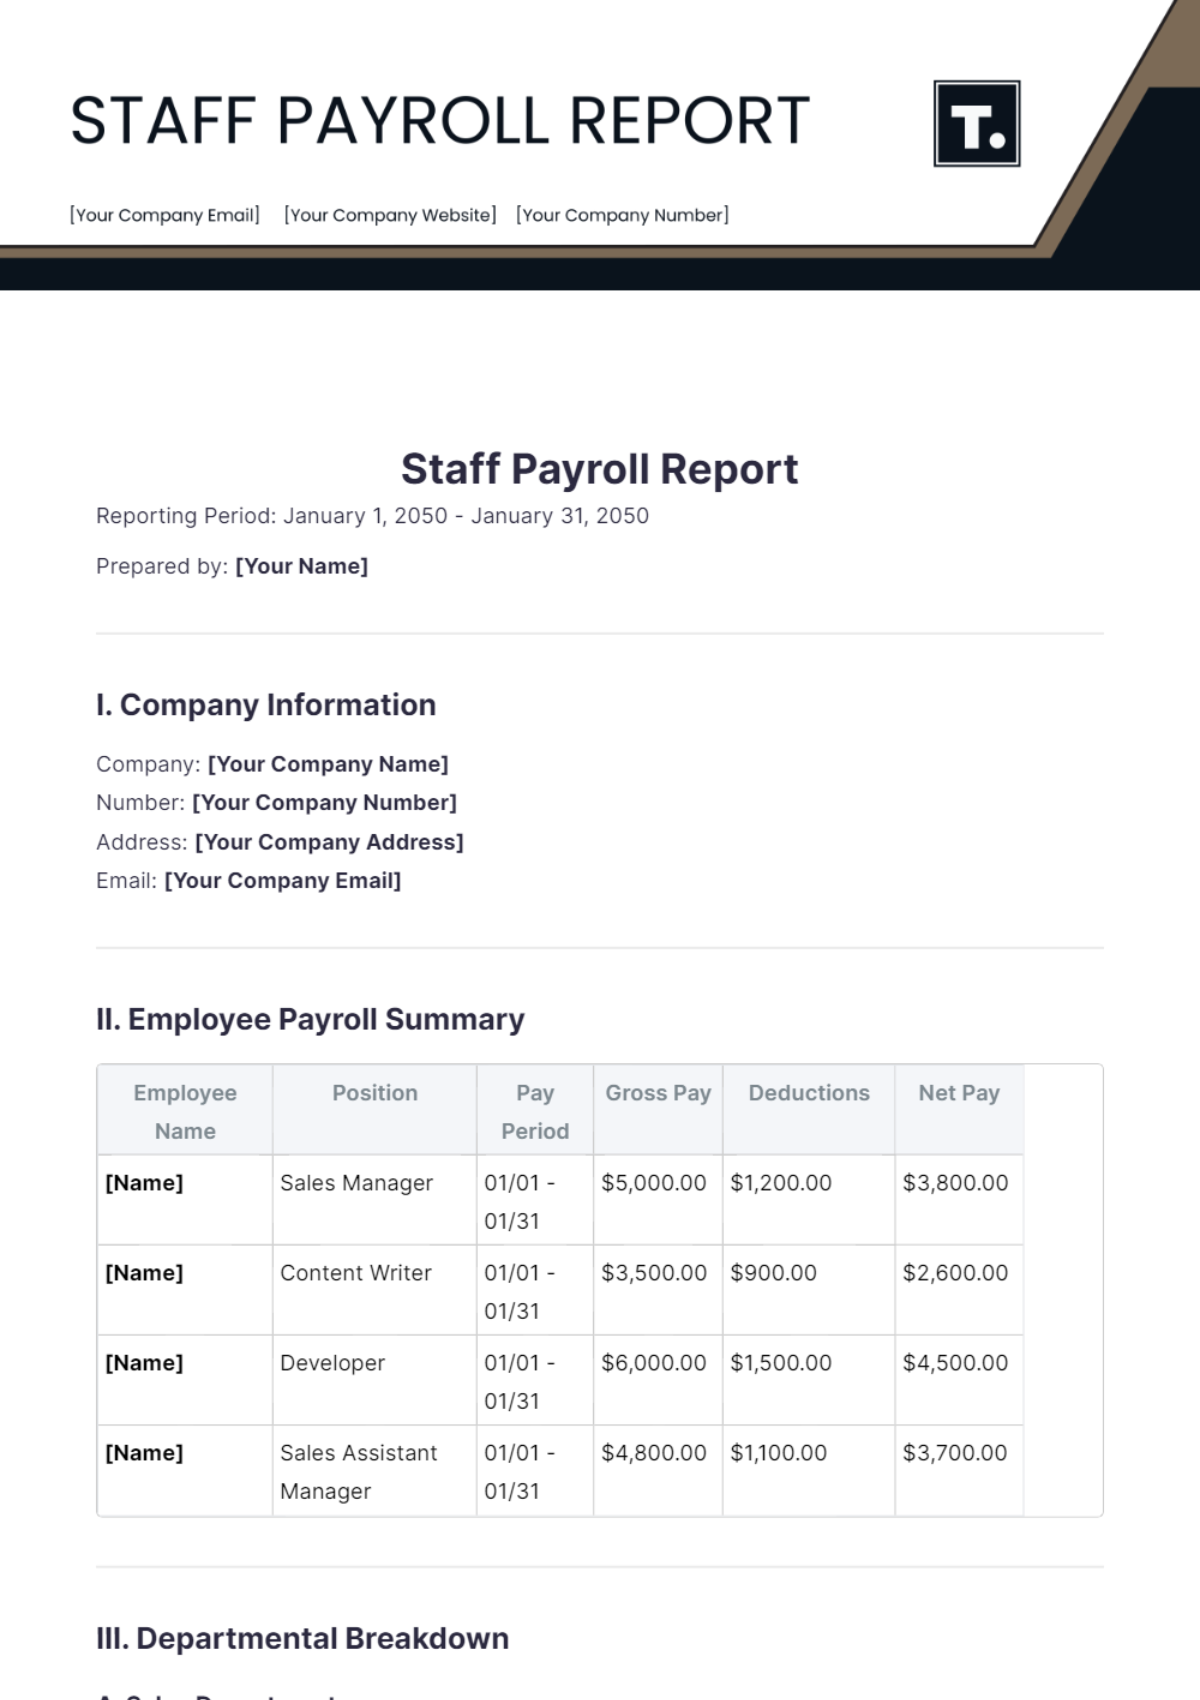
Prepared by: [Your Name]
I. Report Summary
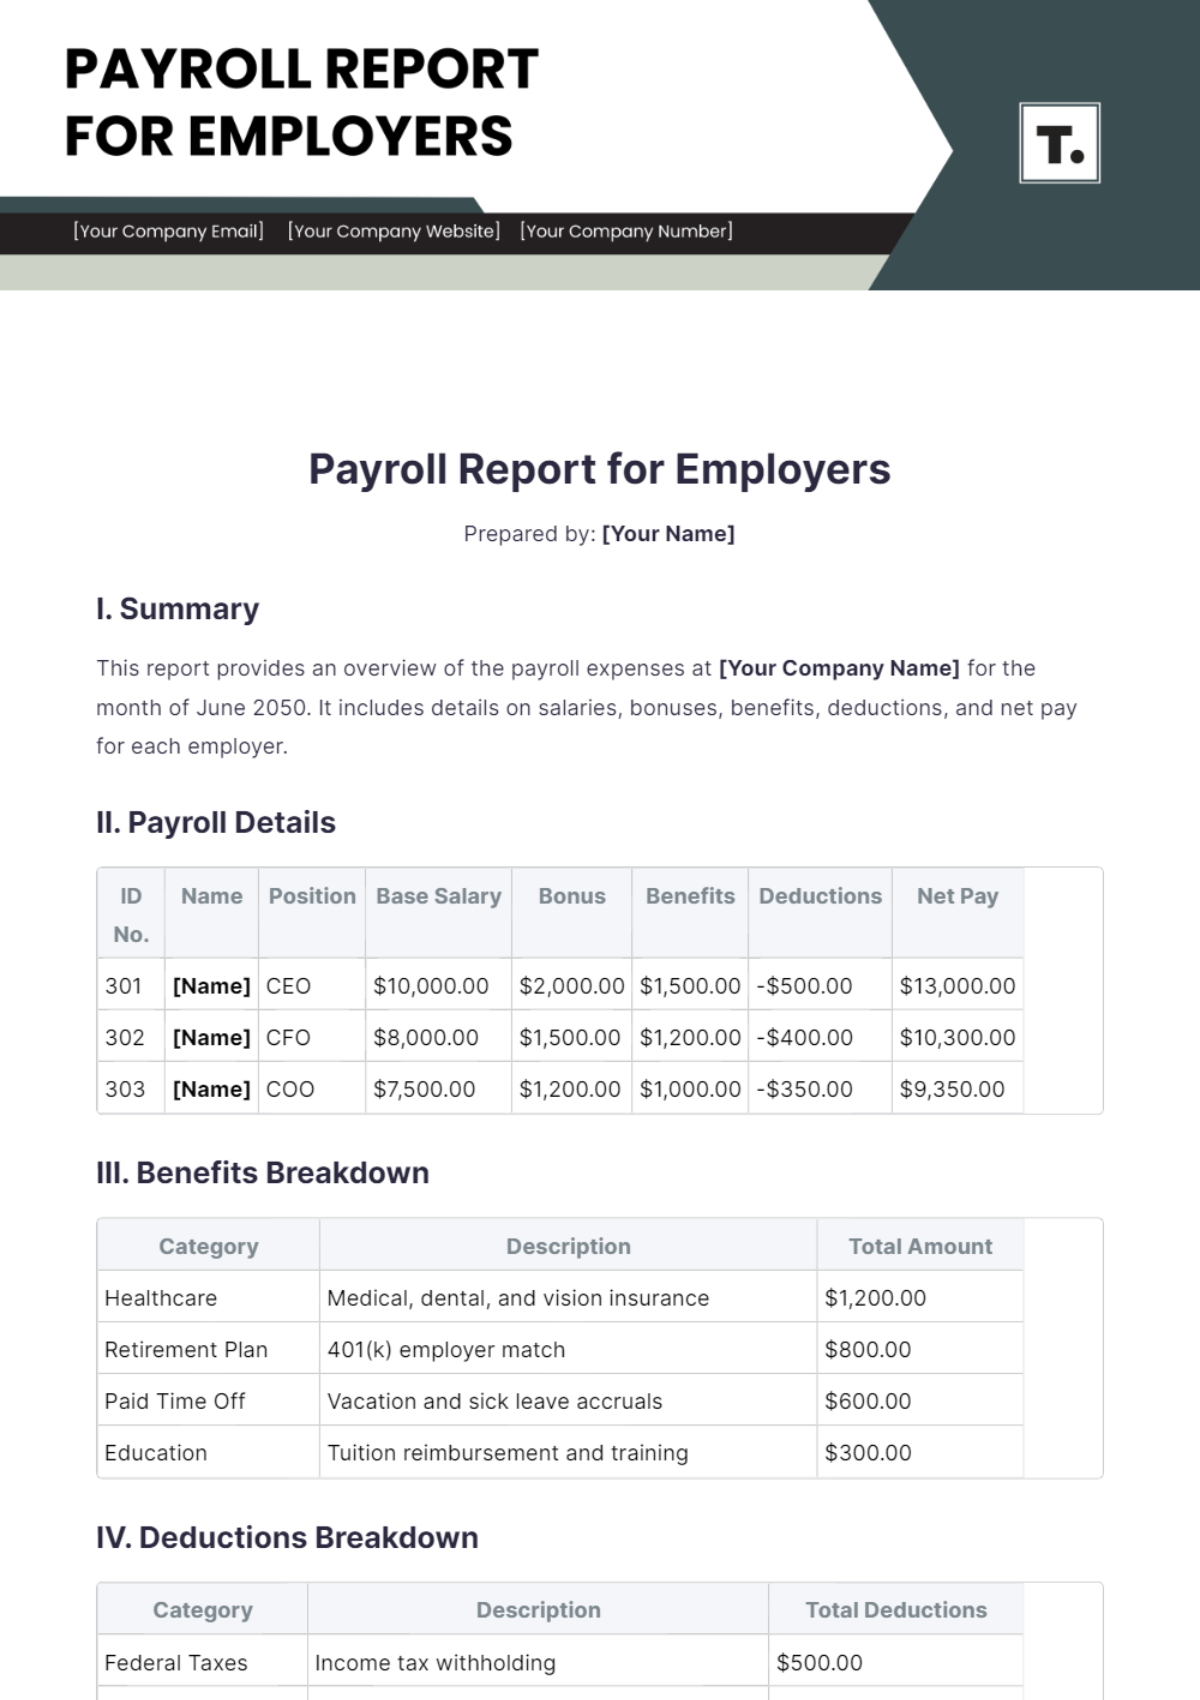
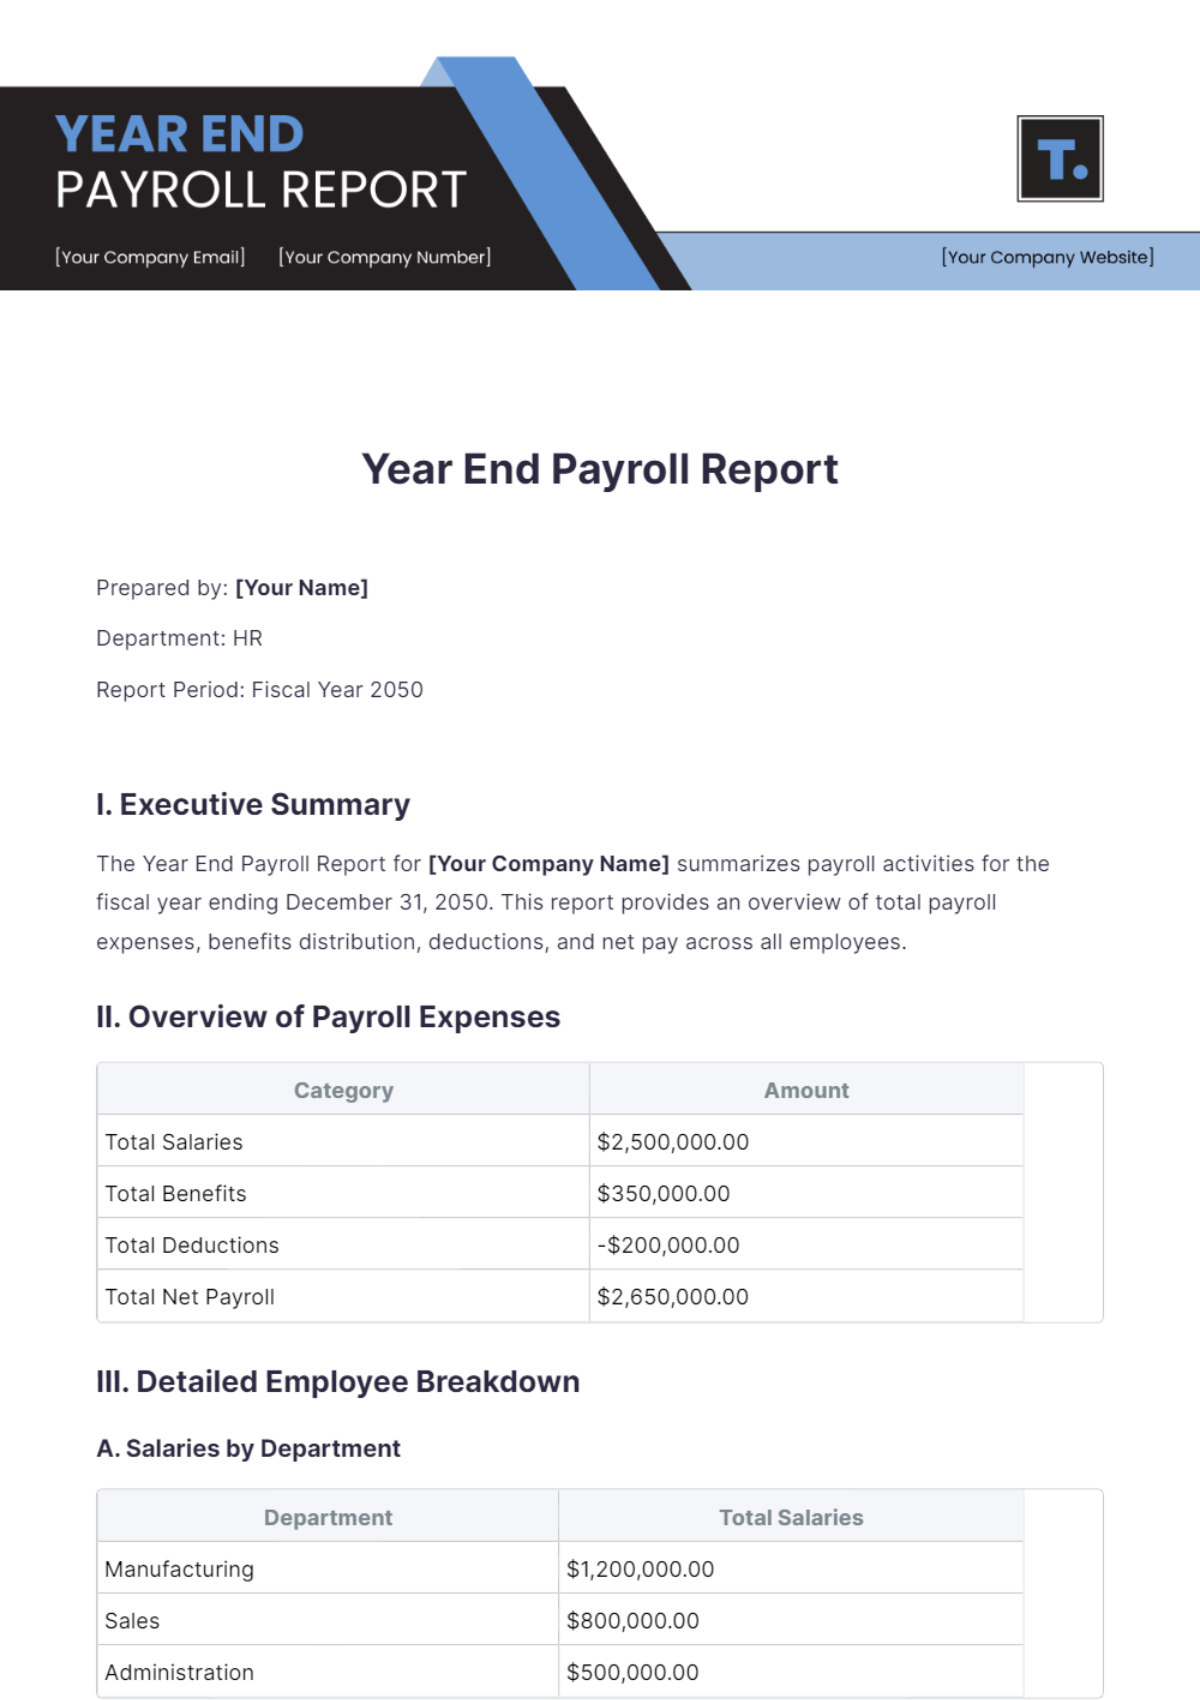
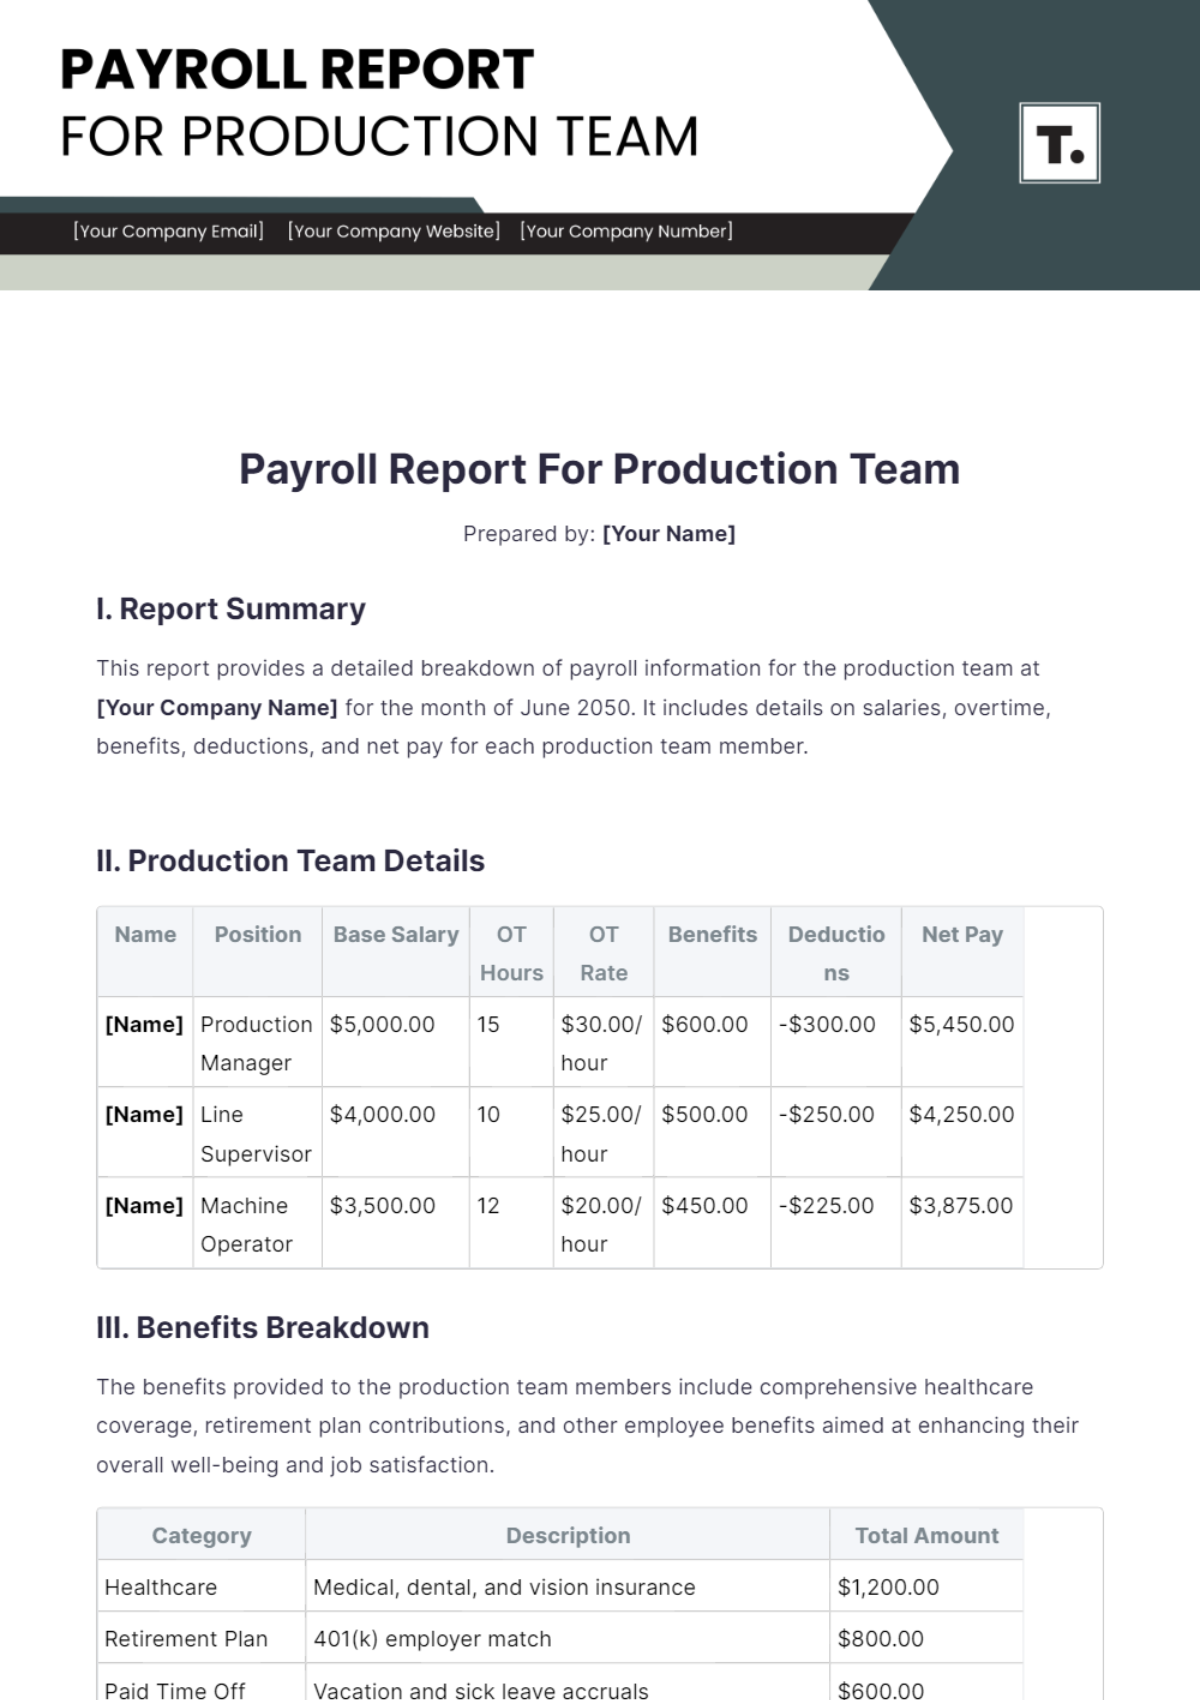
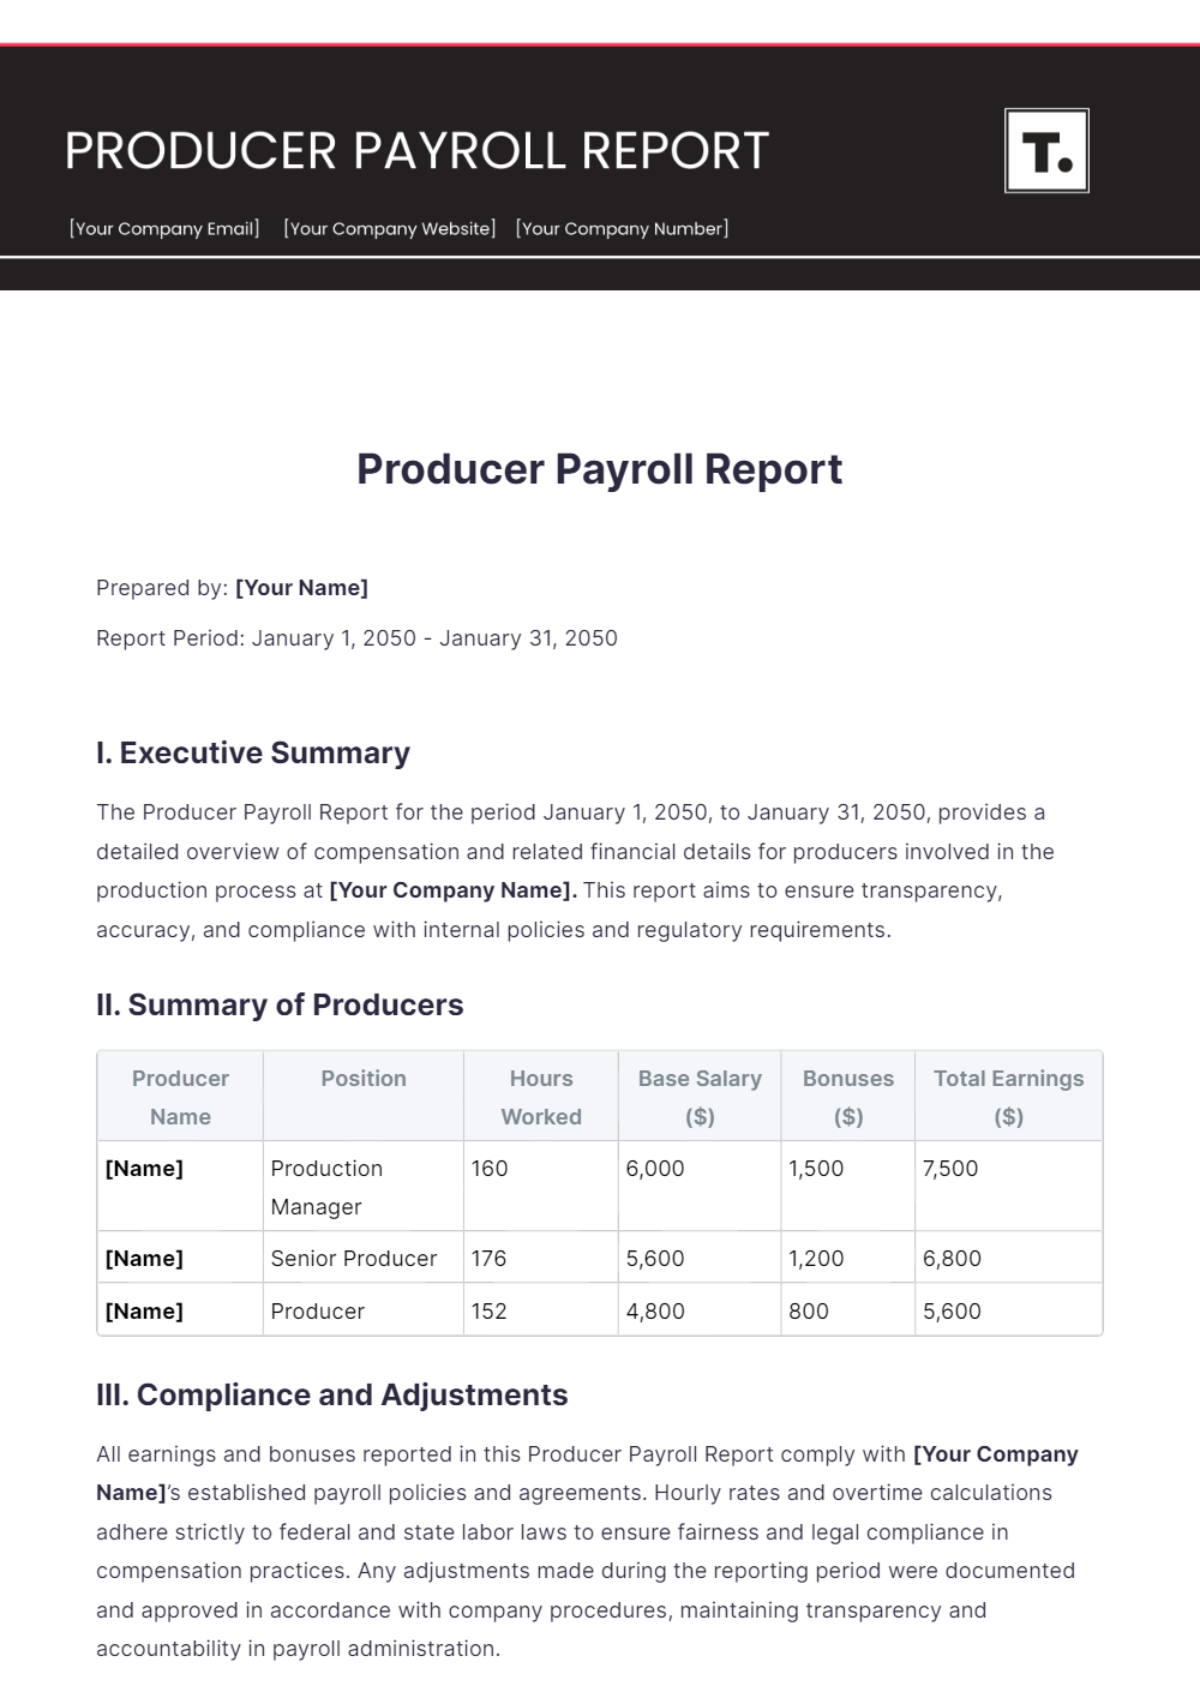
This report provides a detailed breakdown of payroll information for the production team at [Your Company Name] for the month of June 2050. It includes details on salaries, overtime, benefits, deductions, and net pay for each production team member.
II. Production Team Details
Name | Position | Base Salary | OT Hours | OT Rate | Benefits | Deductions | Net Pay |
|---|---|---|---|---|---|---|---|
[Name] | Production Manager | $5,000.00 | 15 | $30.00/hour | $600.00 | -$300.00 | $5,450.00 |
[Name] | Line Supervisor | $4,000.00 | 10 | $25.00/hour | $500.00 | -$250.00 | $4,250.00 |
[Name] | Machine Operator | $3,500.00 | 12 | $20.00/hour | $450.00 | -$225.00 | $3,875.00 |
III. Benefits Breakdown
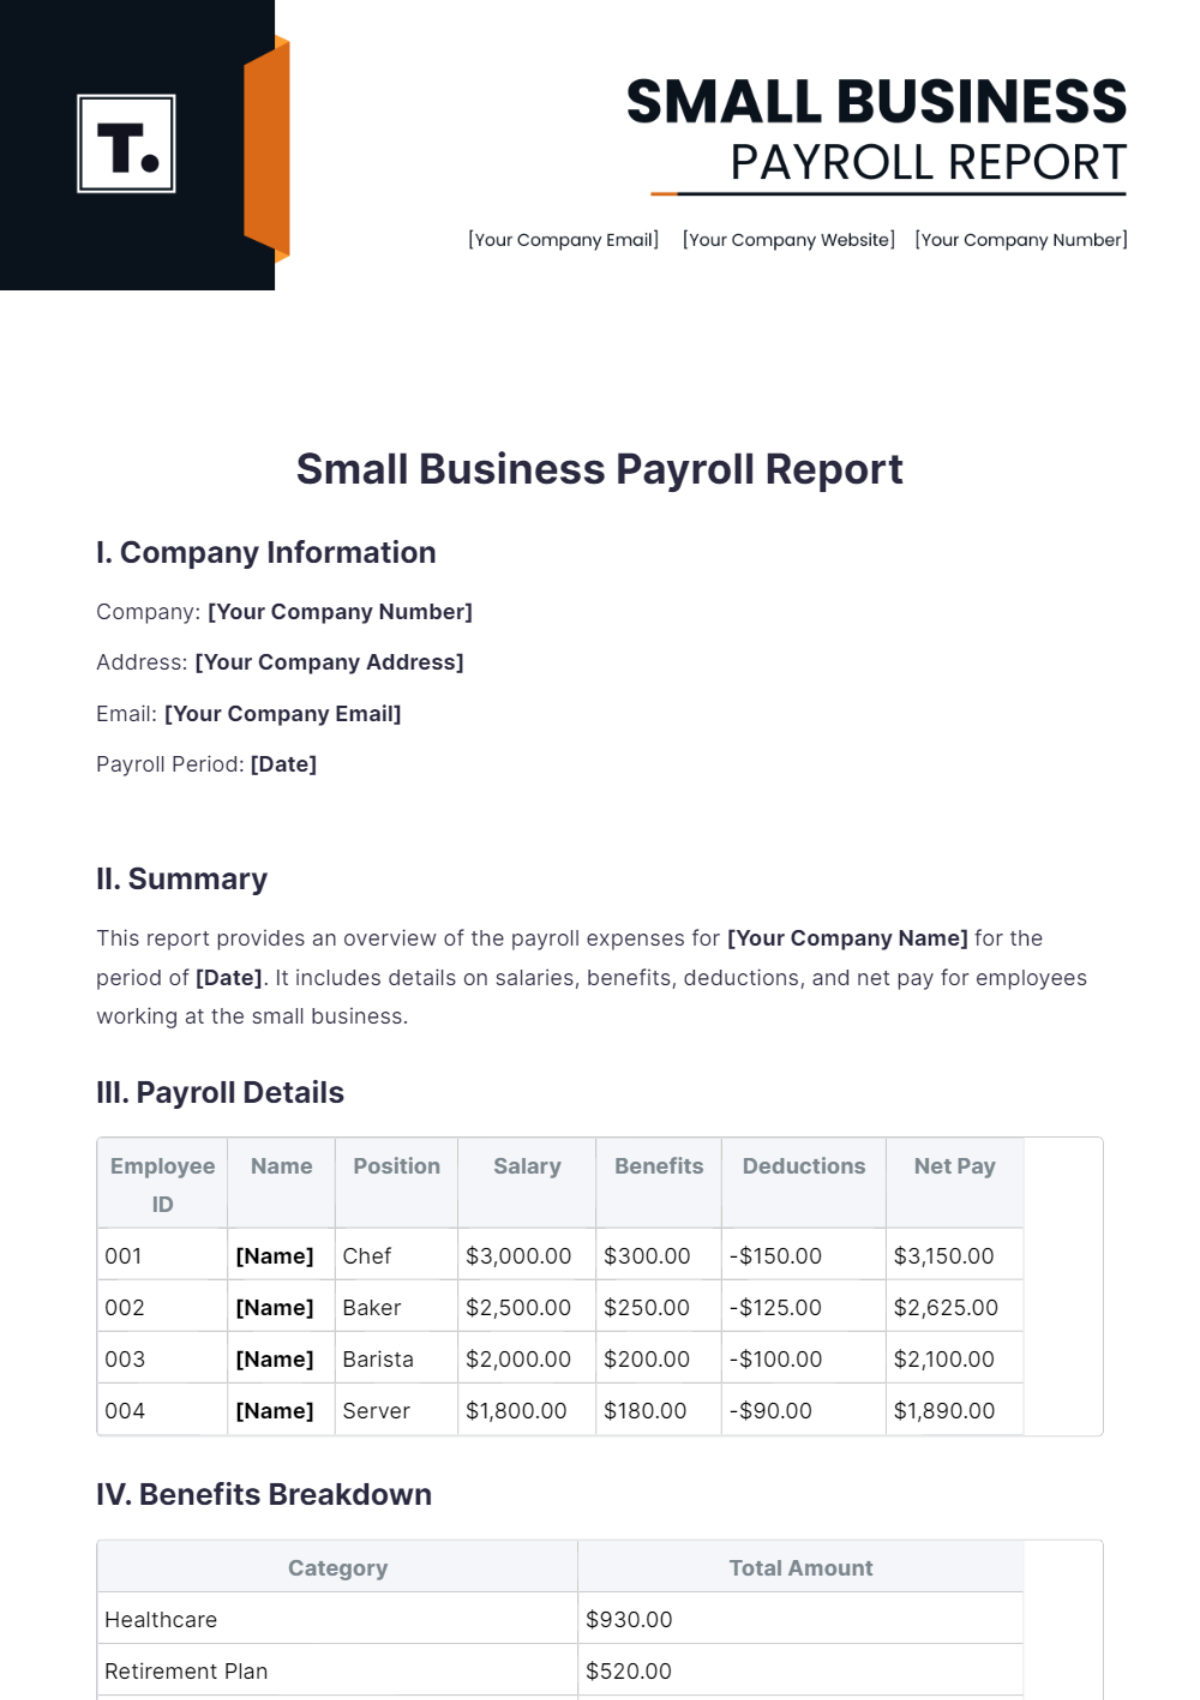
The benefits provided to the production team members include comprehensive healthcare coverage, retirement plan contributions, and other employee benefits aimed at enhancing their overall well-being and job satisfaction.
Category | Description | Total Amount |
|---|---|---|
Healthcare | Medical, dental, and vision insurance | $1,200.00 |
Retirement Plan | 401(k) employer match | $800.00 |
Paid Time Off | Vacation and sick leave accruals | $600.00 |
Education | Tuition reimbursement and training | $300.00 |
Other Benefits | Employee assistance programs and perks | $350.00 |
IV. Deductions Breakdown
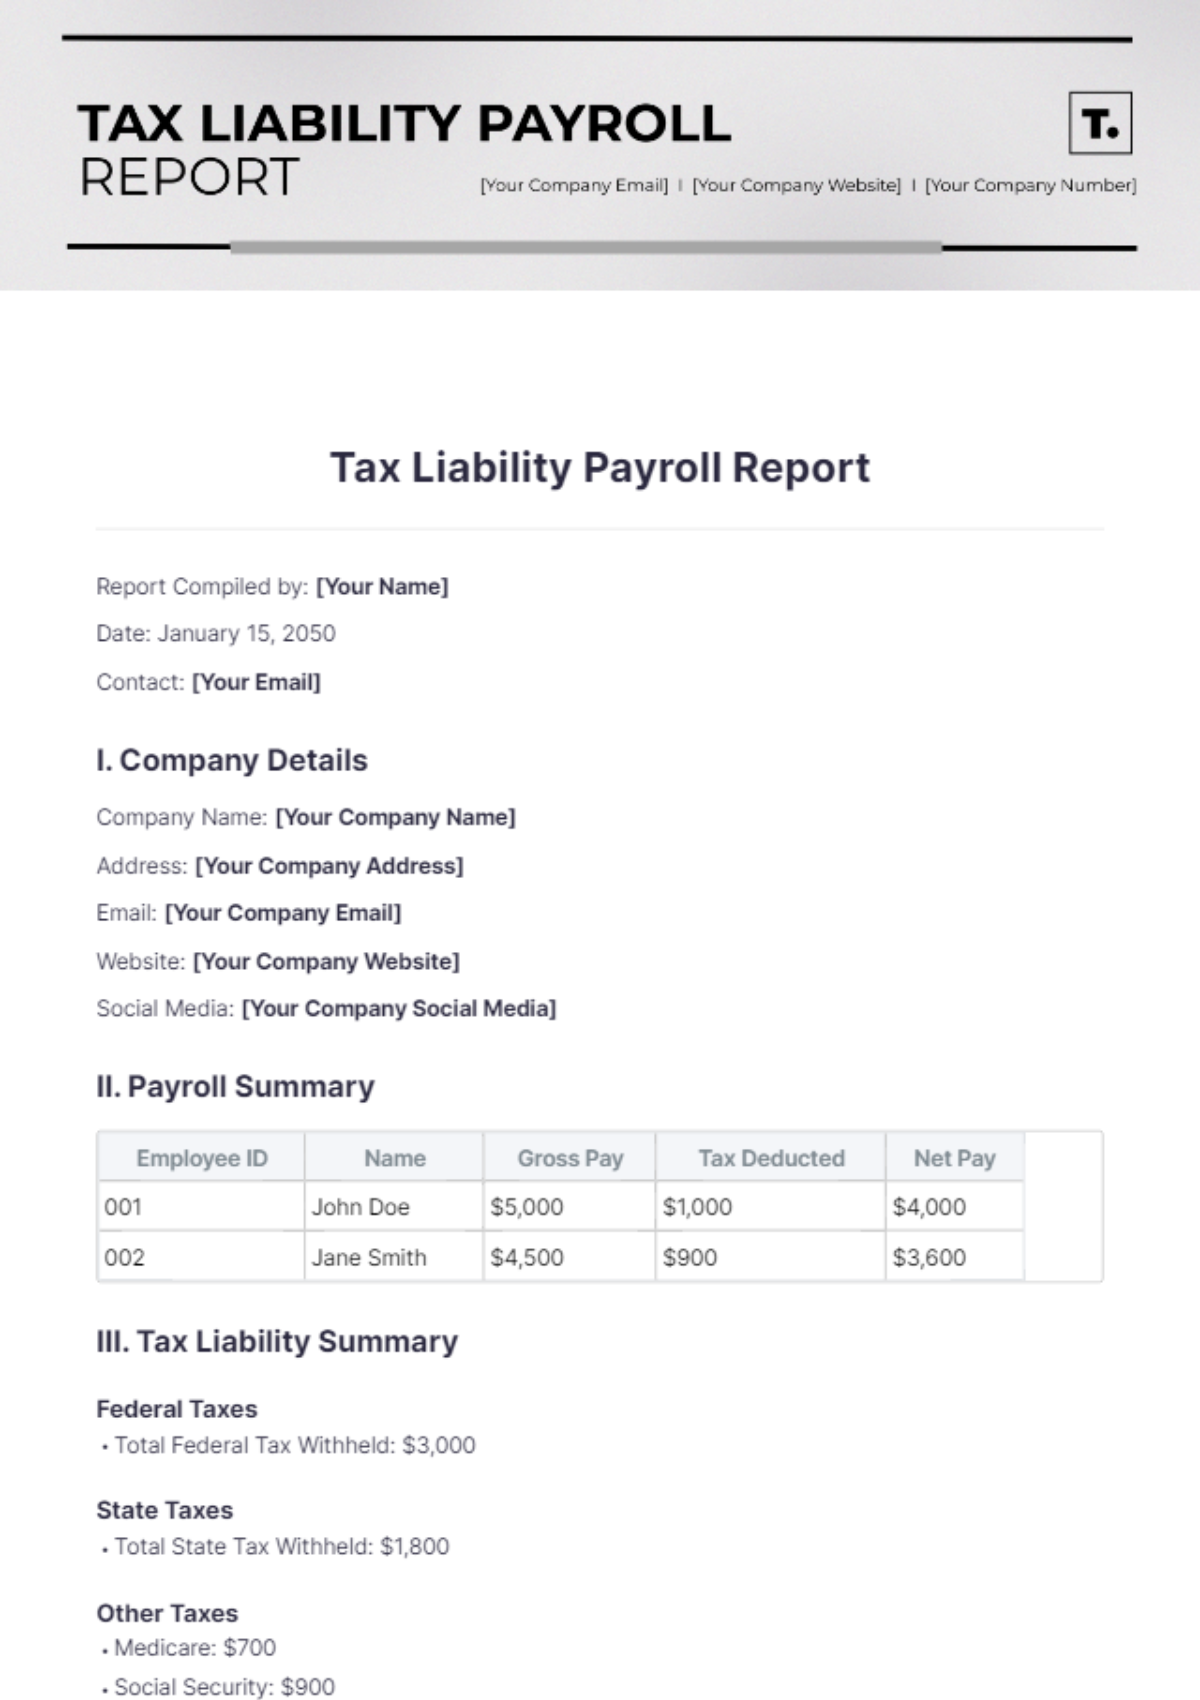
Deductions from the employees' paychecks include mandatory withholdings such as taxes and insurance premiums, as well as other voluntary deductions. The detailed breakdown is as follows:
Category | Description | Total Deductions |
|---|---|---|
Federal Taxes | Income tax withholding | $500.00 |
State Taxes | State income tax withholding | $150.00 |
Social Security | FICA Social Security contributions | $75.00 |
Medicare | FICA Medicare contributions | $50.00 |
V. Performance Metrics
The performance metrics for June 2050 show a significant increase in production efficiency within the team. The average production output increased by 20%, demonstrating improved workflows and employee productivity. This enhancement is attributed to optimized operational procedures and effective team management.
VI. Conclusion
The Payroll Report for the Production Team at [Your Company Name] for June 2050 highlights the total payroll expenses, benefits, deductions, and net pay for each team member. With a total net pay distribution of $20,025.00, the report reflects the company's dedication to fair compensation and employee welfare, contributing to enhanced production efficiency and operational success.

