Payroll Report for Employers
Prepared by: [Your Name]
I. Summary
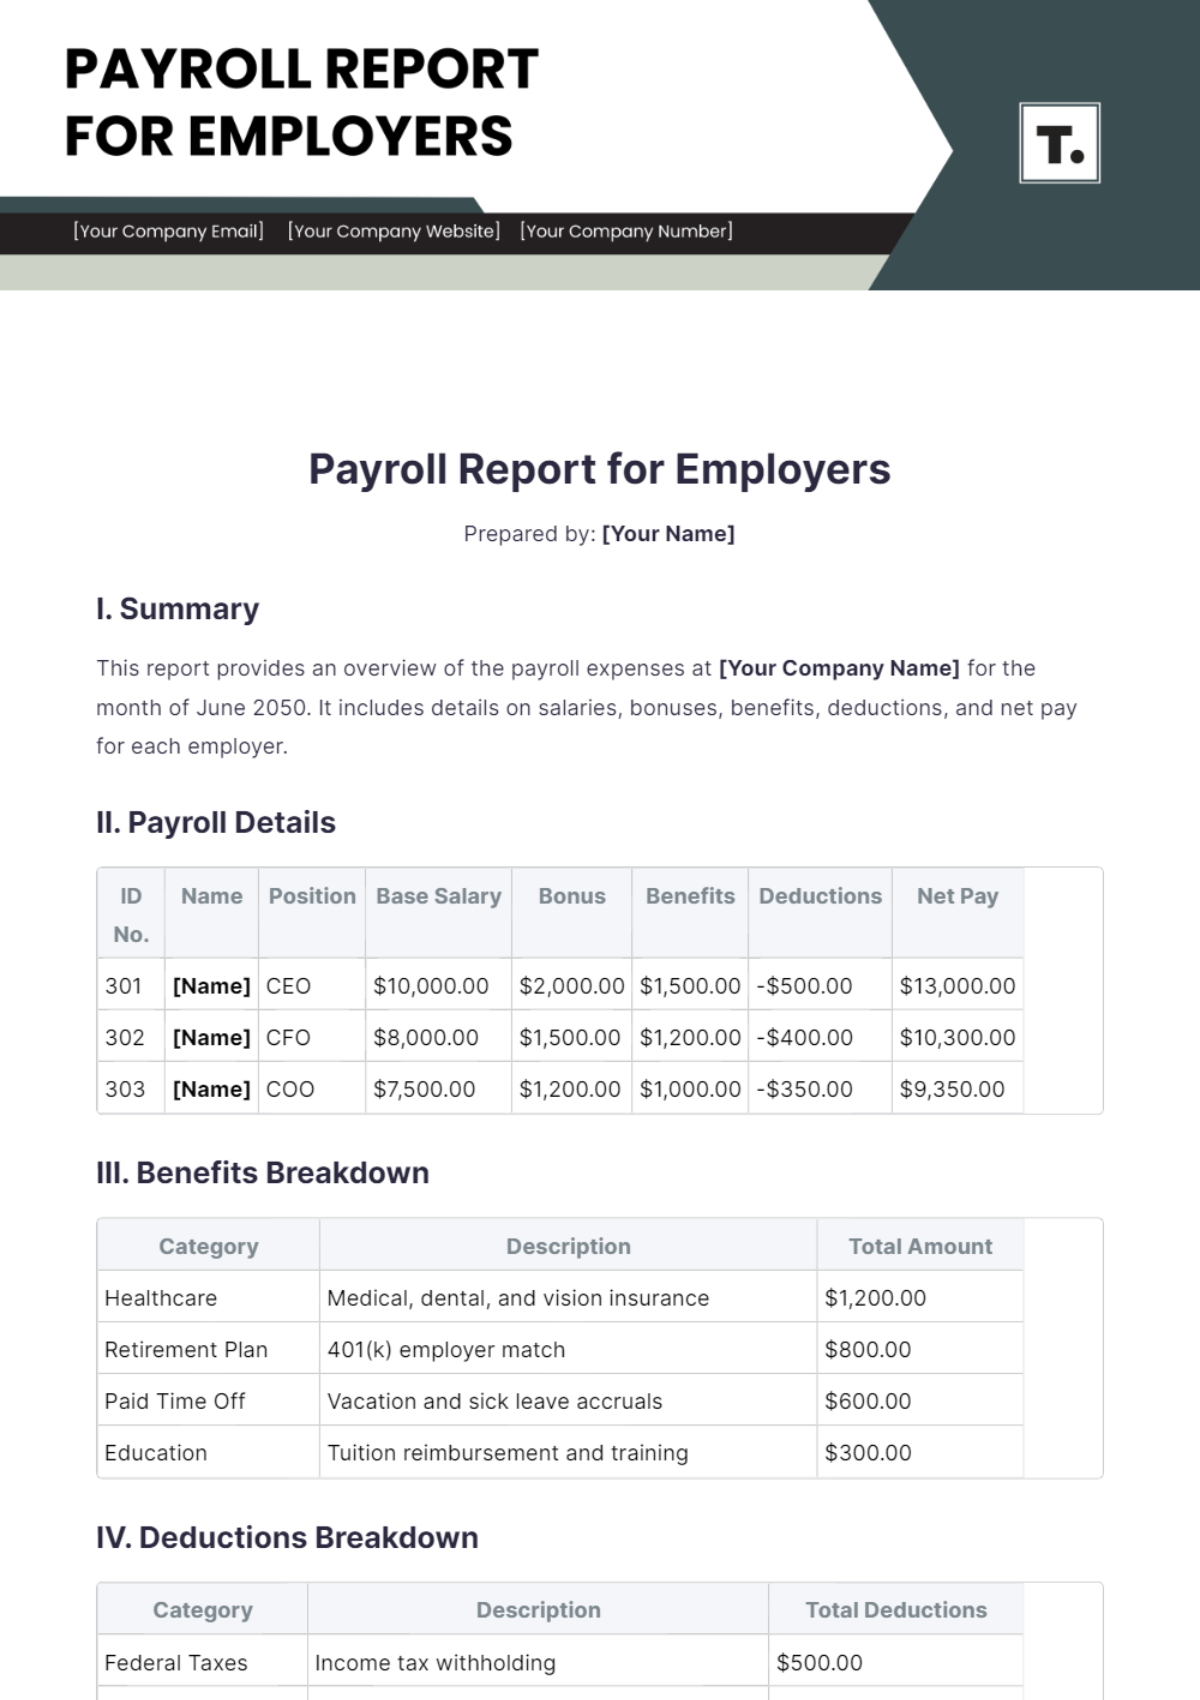
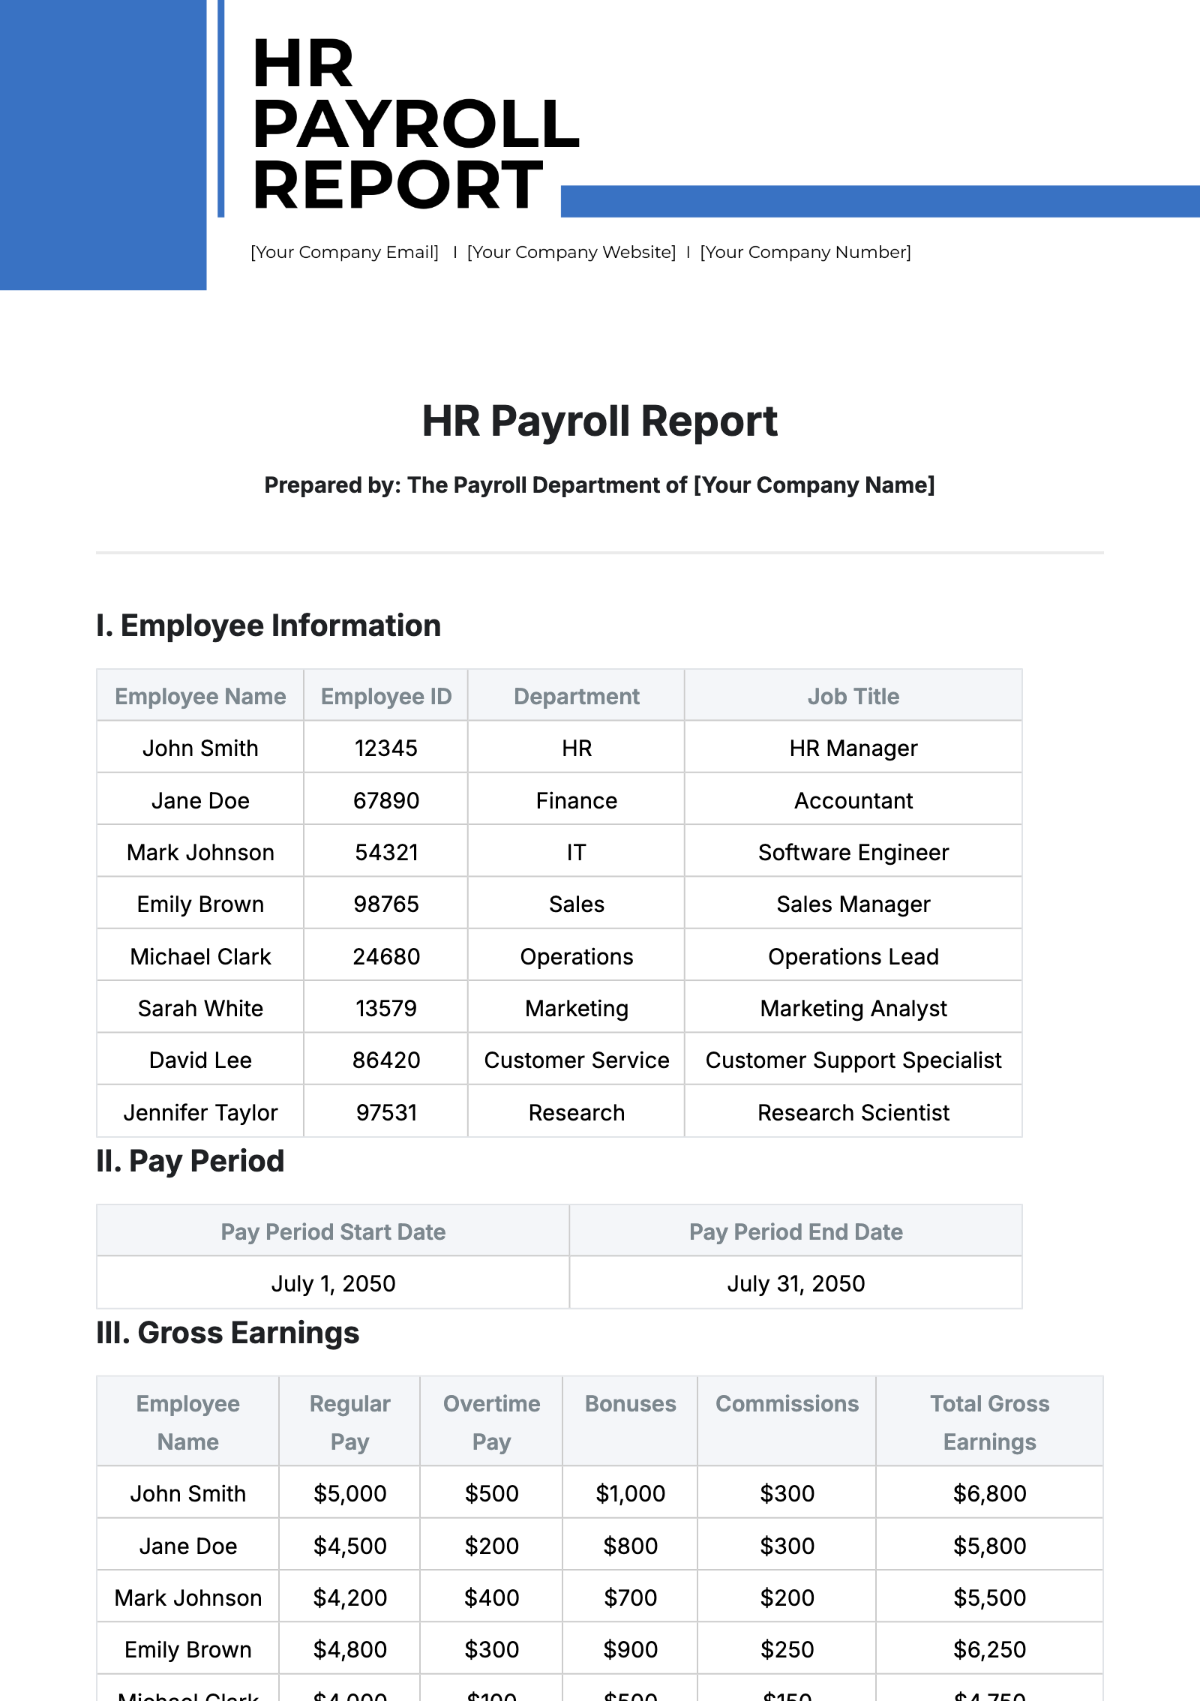
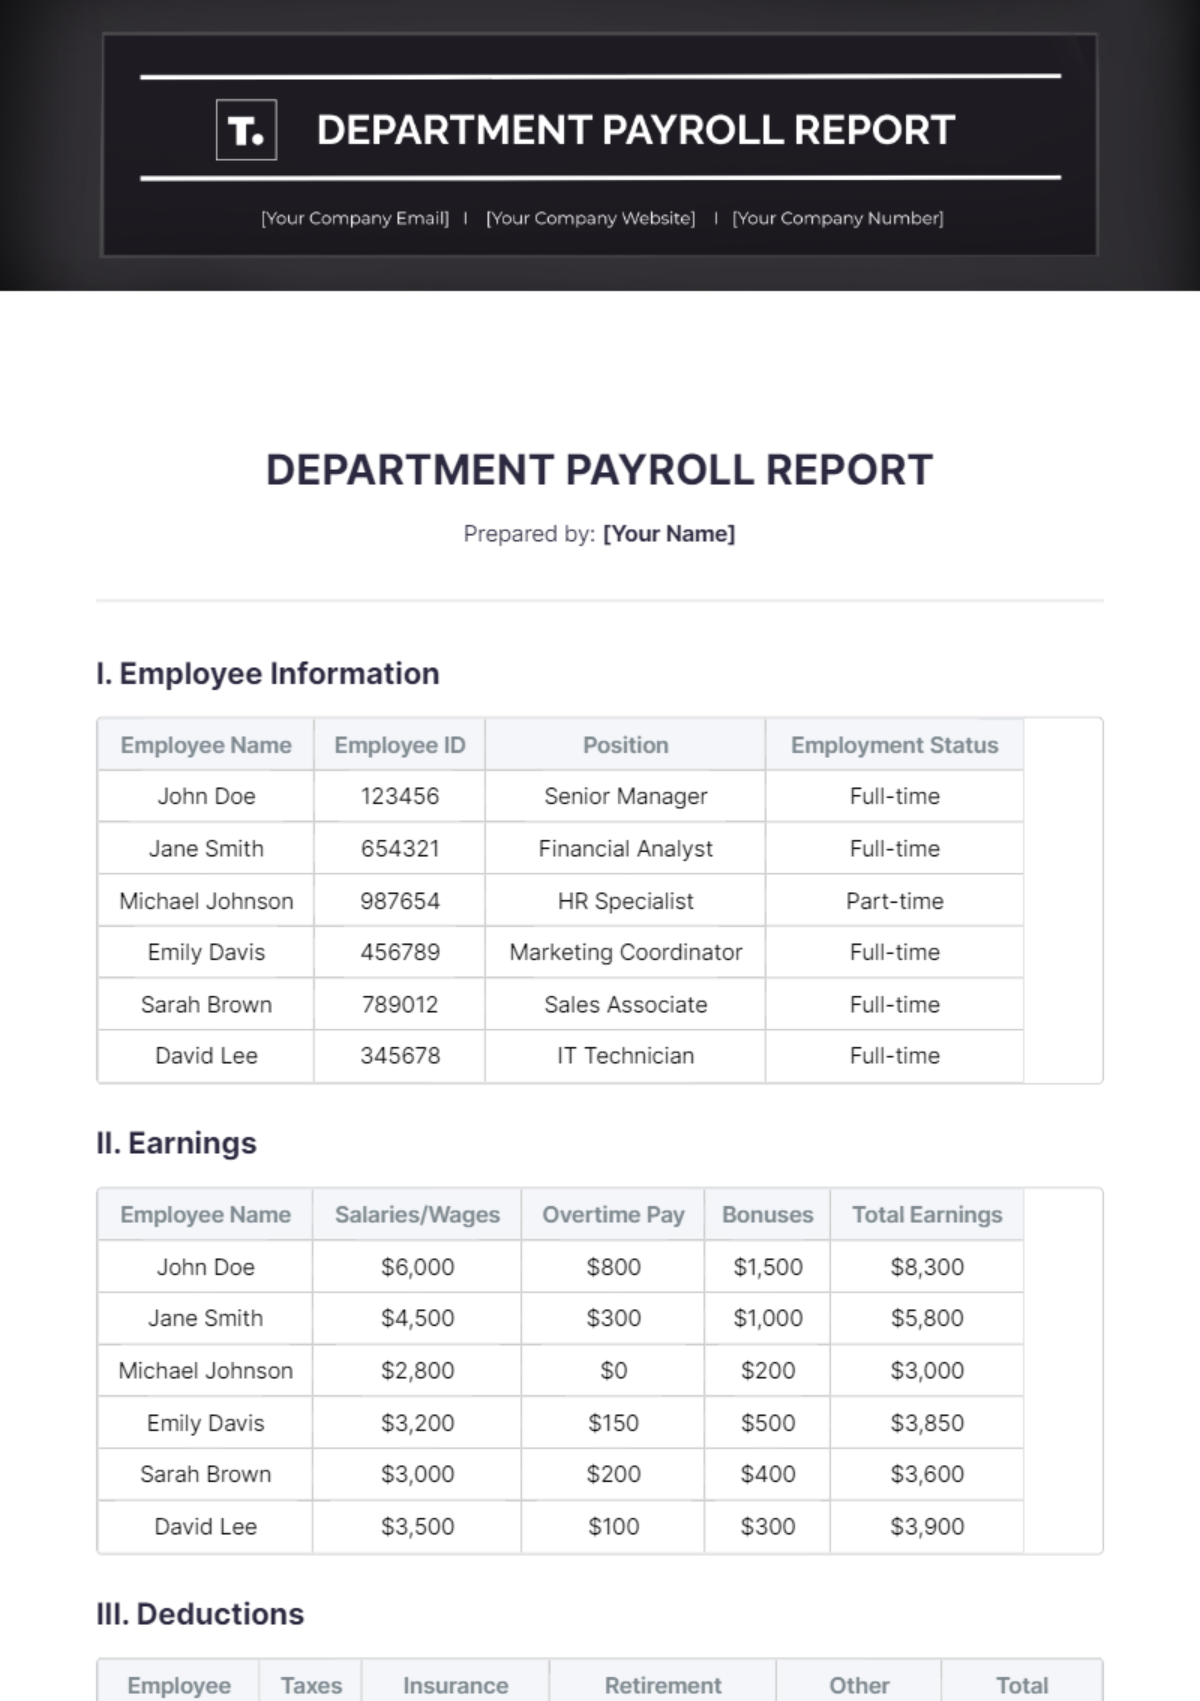
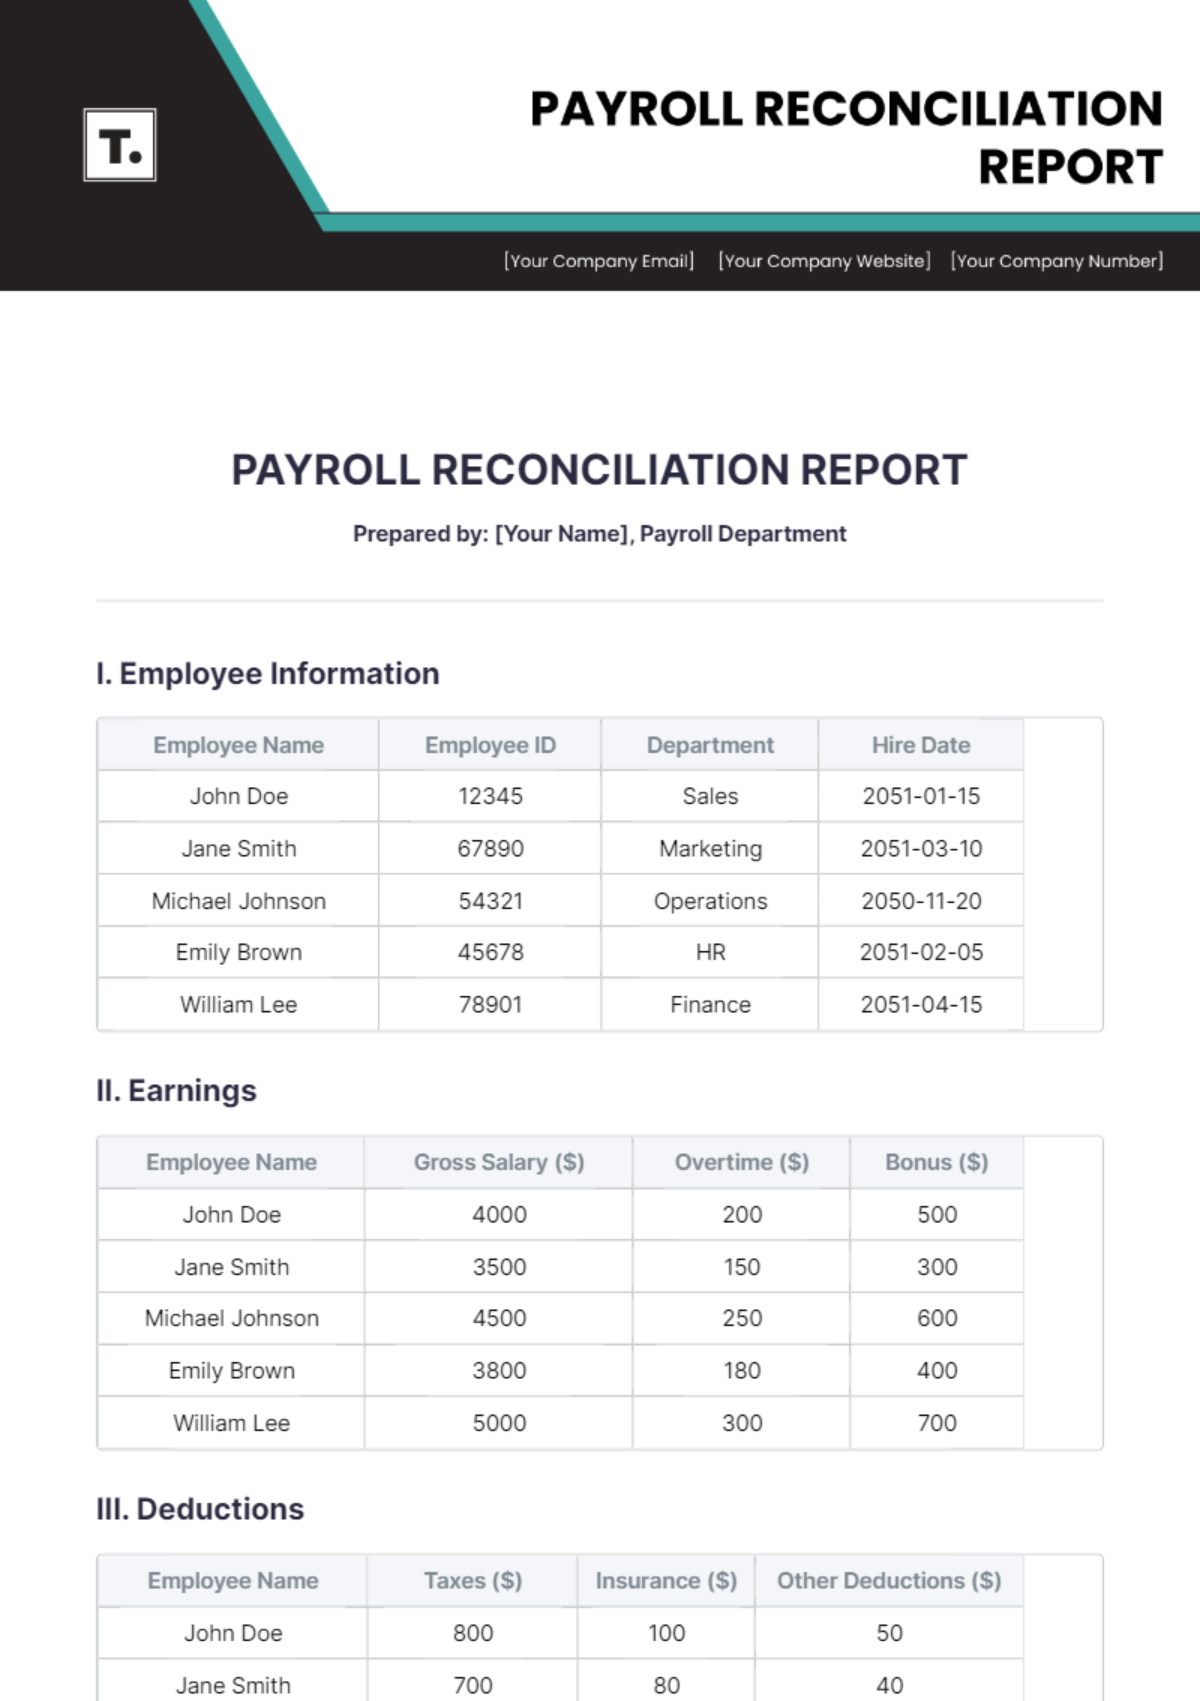
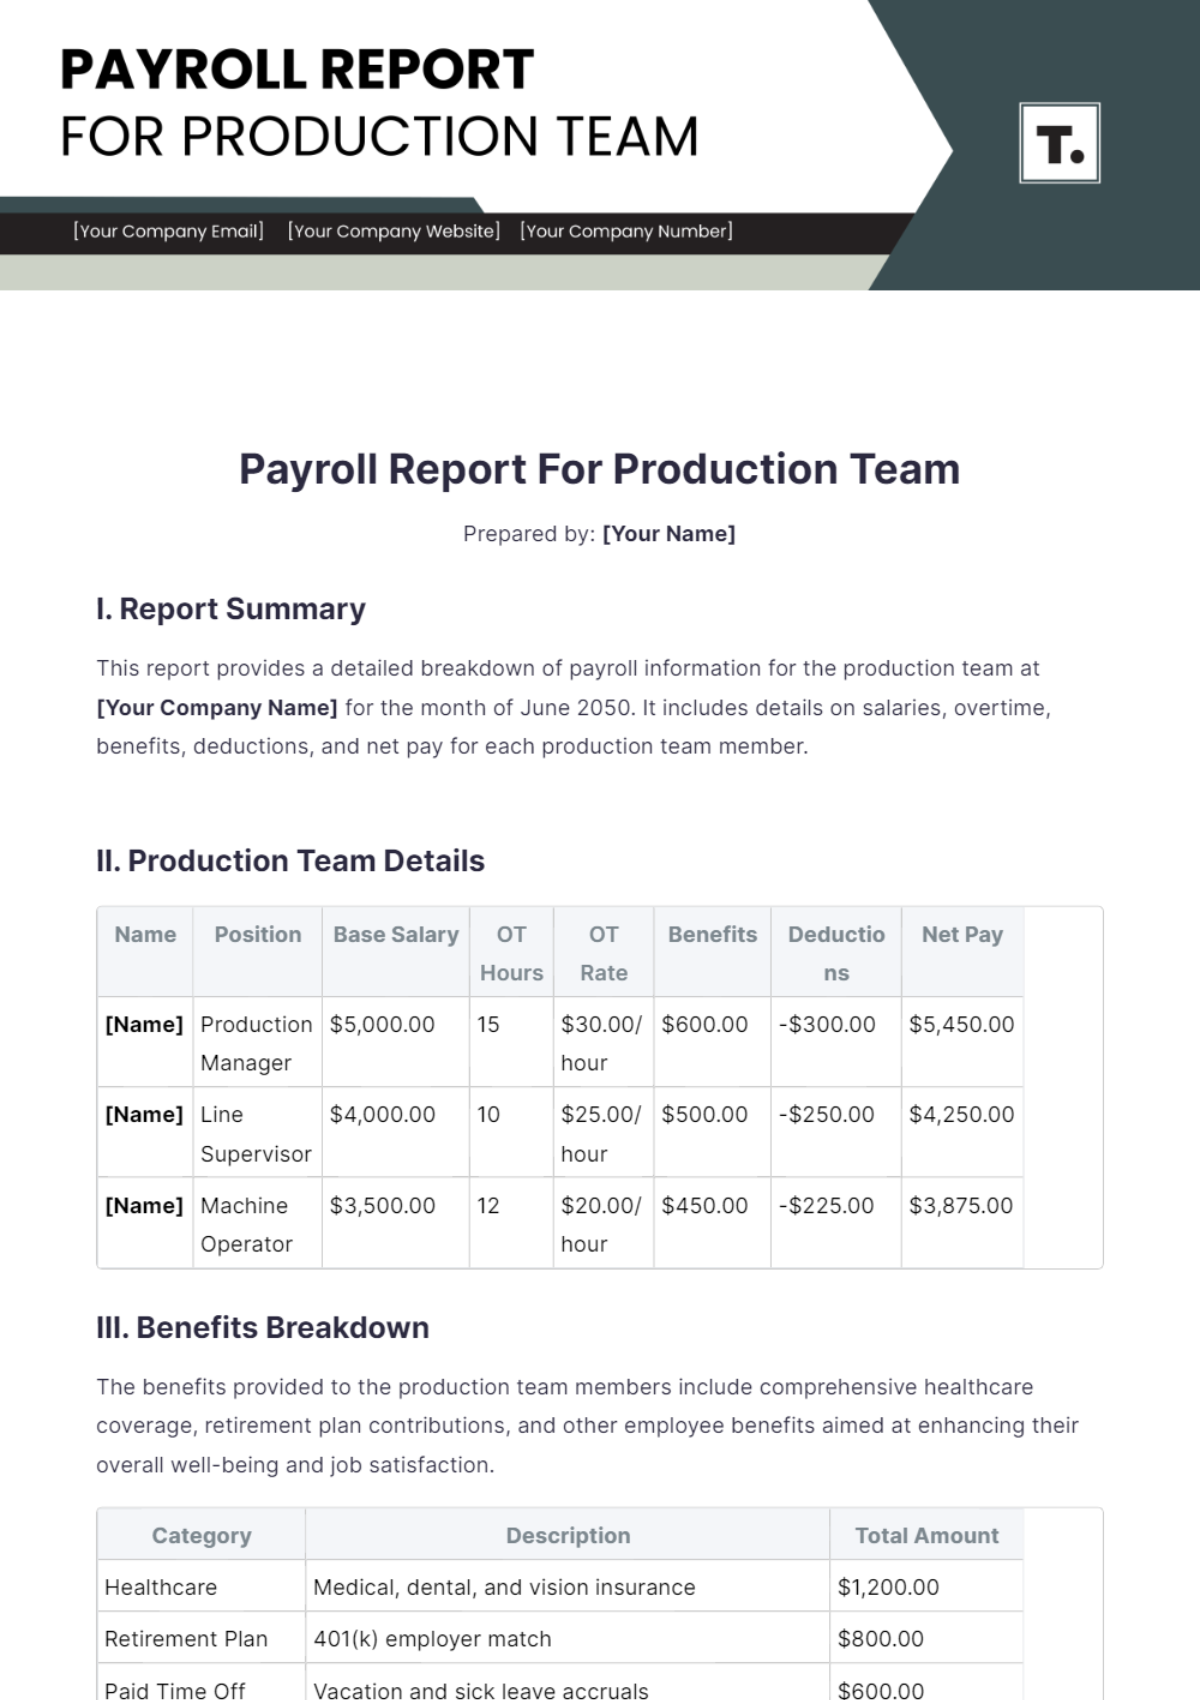
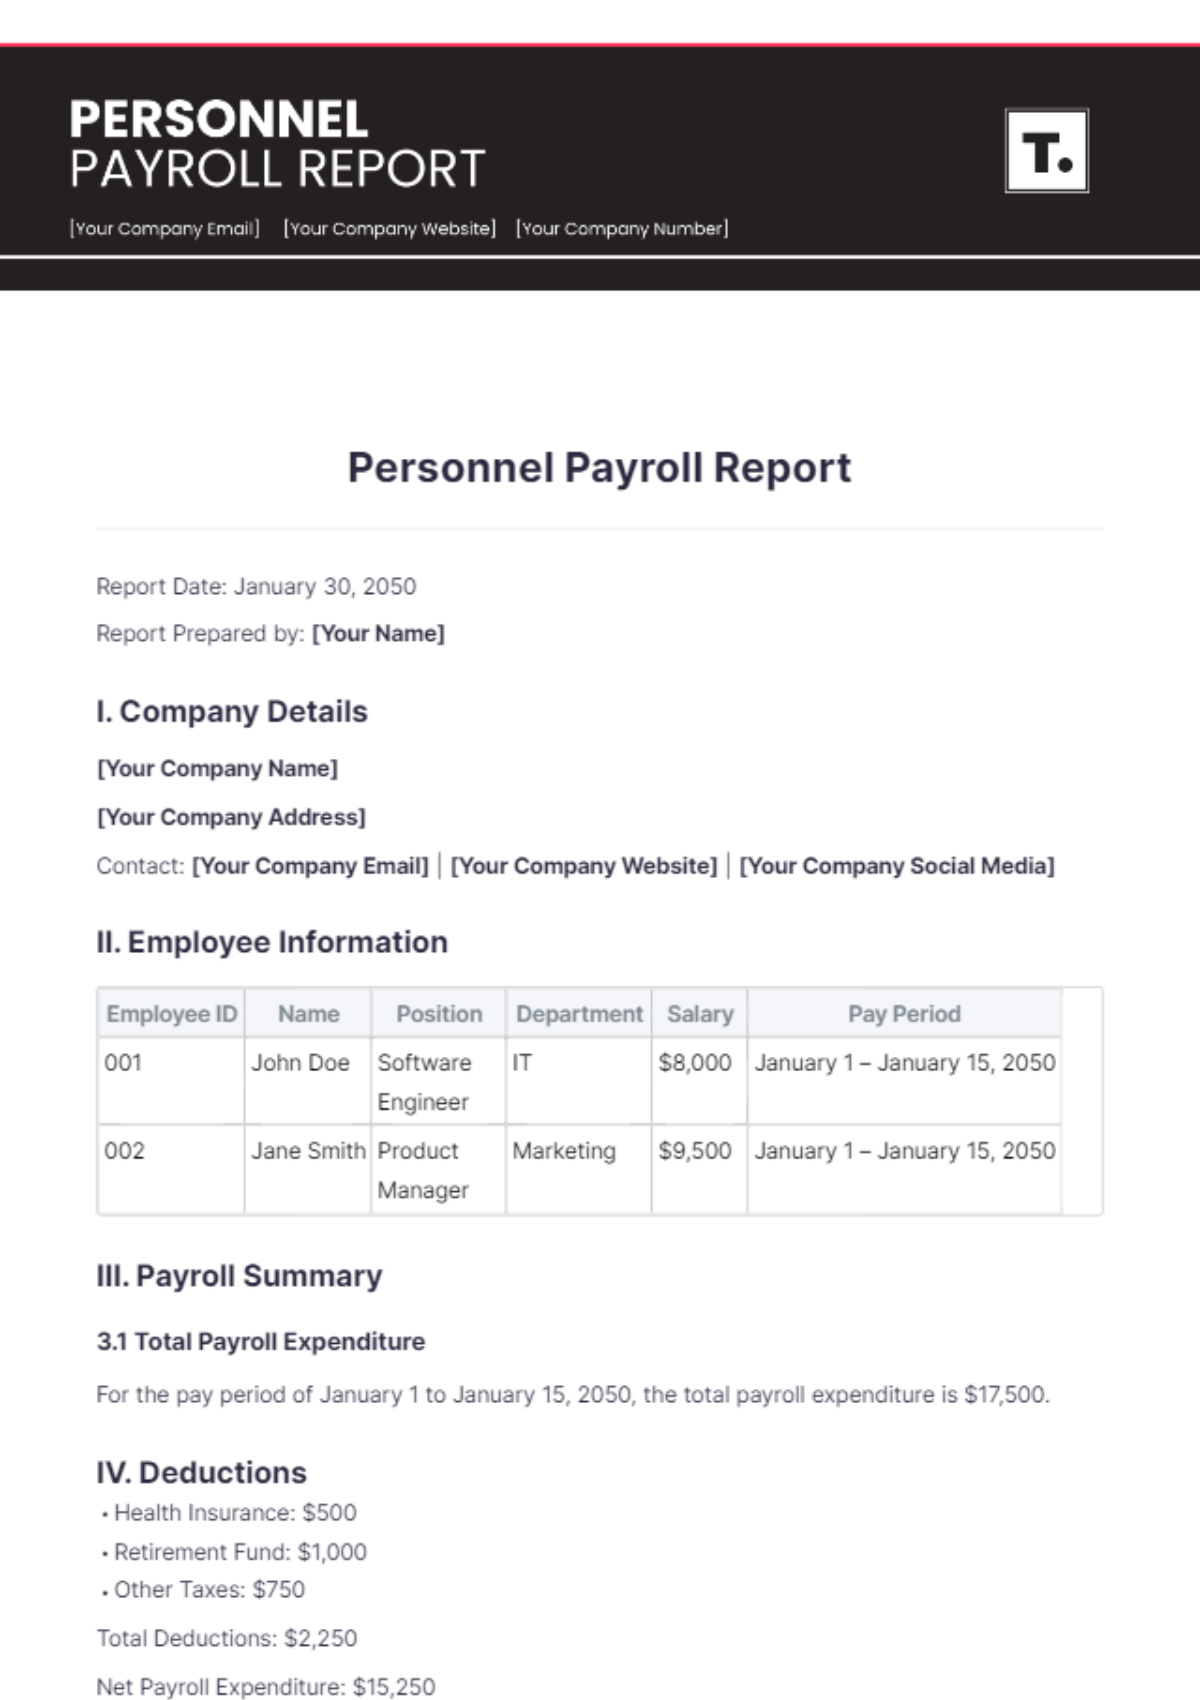
This report provides an overview of the payroll expenses at [Your Company Name] for the month of June 2050. It includes details on salaries, bonuses, benefits, deductions, and net pay for each employer.
II. Payroll Details
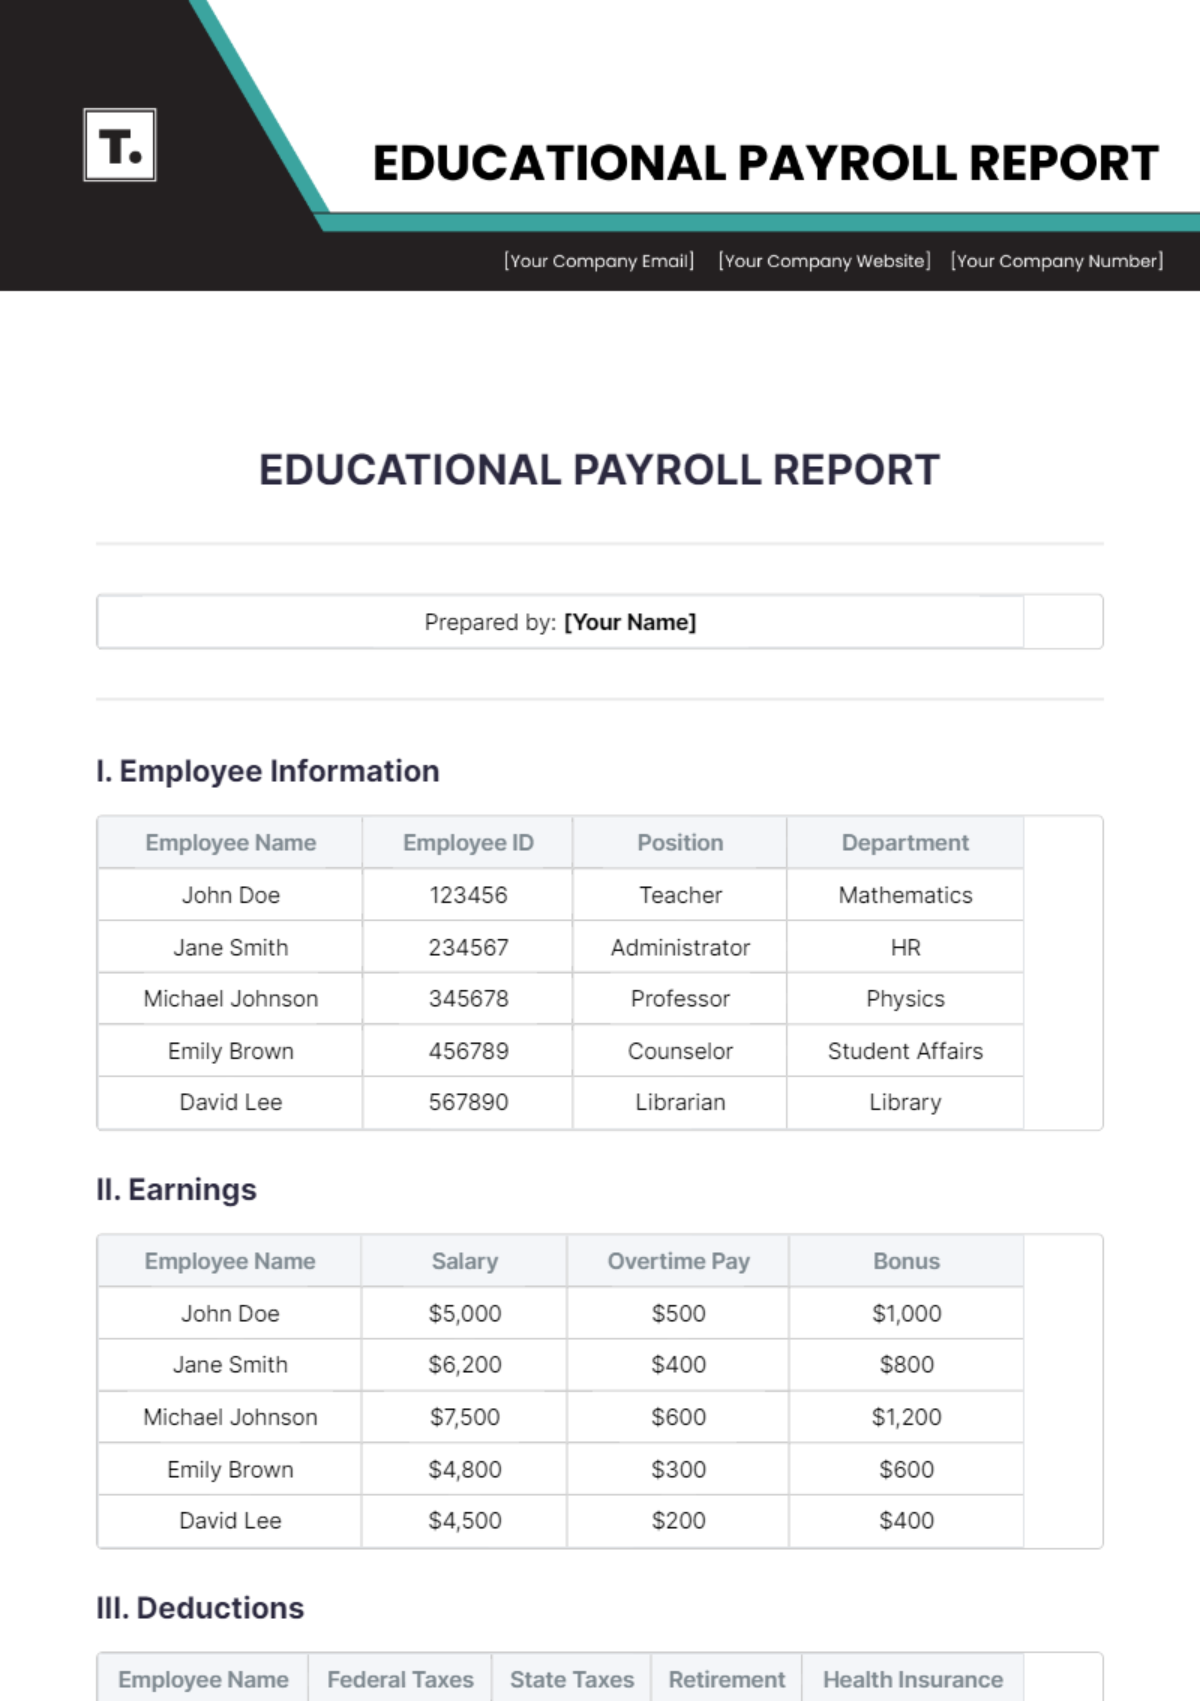
ID No. | Name | Position | Base Salary | Bonus | Benefits | Deductions | Net Pay |
|---|---|---|---|---|---|---|---|
301 | [Name] | CEO | $10,000.00 | $2,000.00 | $1,500.00 | -$500.00 | $13,000.00 |
302 | [Name] | CFO | $8,000.00 | $1,500.00 | $1,200.00 | -$400.00 | $10,300.00 |
303 | [Name] | COO | $7,500.00 | $1,200.00 | $1,000.00 | -$350.00 | $9,350.00 |
III. Benefits Breakdown
Category | Description | Total Amount |
|---|---|---|
Healthcare | Medical, dental, and vision insurance | $1,200.00 |
Retirement Plan | 401(k) employer match | $800.00 |
Paid Time Off | Vacation and sick leave accruals | $600.00 |
Education | Tuition reimbursement and training | $300.00 |
IV. Deductions Breakdown
Category | Description | Total Deductions |
|---|---|---|
Federal Taxes | Income tax withholding | $500.00 |
State Taxes | State income tax withholding | $150.00 |
Social Security | FICA Social Security contributions | $75.00 |
Medicare | FICA Medicare contributions | $50.00 |
V. Bonus Distribution
Bonus payments for June 2050 were distributed based on individual performance and contributions to the organization's success.
Name | Bonus Amount |
|---|---|
[Name] | $2,000.00 |
[Name] | $1,500.00 |
[Name] | $1,200.00 |
VI. Payroll Trends and Insights
The payroll data for June 2050 reveals consistent salary structures with performance-based bonuses. There has been a 5% increase in the base salary compared to the previous quarter, reflecting the company’s positive financial health and competitive compensation strategy.
The inclusion of comprehensive benefits and performance-based bonuses demonstrates [Your Company Name]'s commitment to employee welfare and retention. The company’s focus on competitive salaries and benefits ensures the attraction and retention of top-tier talent, driving overall growth and success.
VII. Conclusion
The Payroll Report for Employers at [Your Company Name] for June 2050 provides a comprehensive overview of payroll expenses, including salaries, bonuses, benefits, deductions, and net pay. With a total net pay distribution of $49,150.00, this report highlights the company's commitment to rewarding its leadership team fairly, reflecting their contributions to the company's success and growth. The additional analysis sections underscore the importance of strategic payroll management in fostering a productive and motivated workforce.
