Simple Marketing Task Report
I. Introduction
A. Overview of the Report
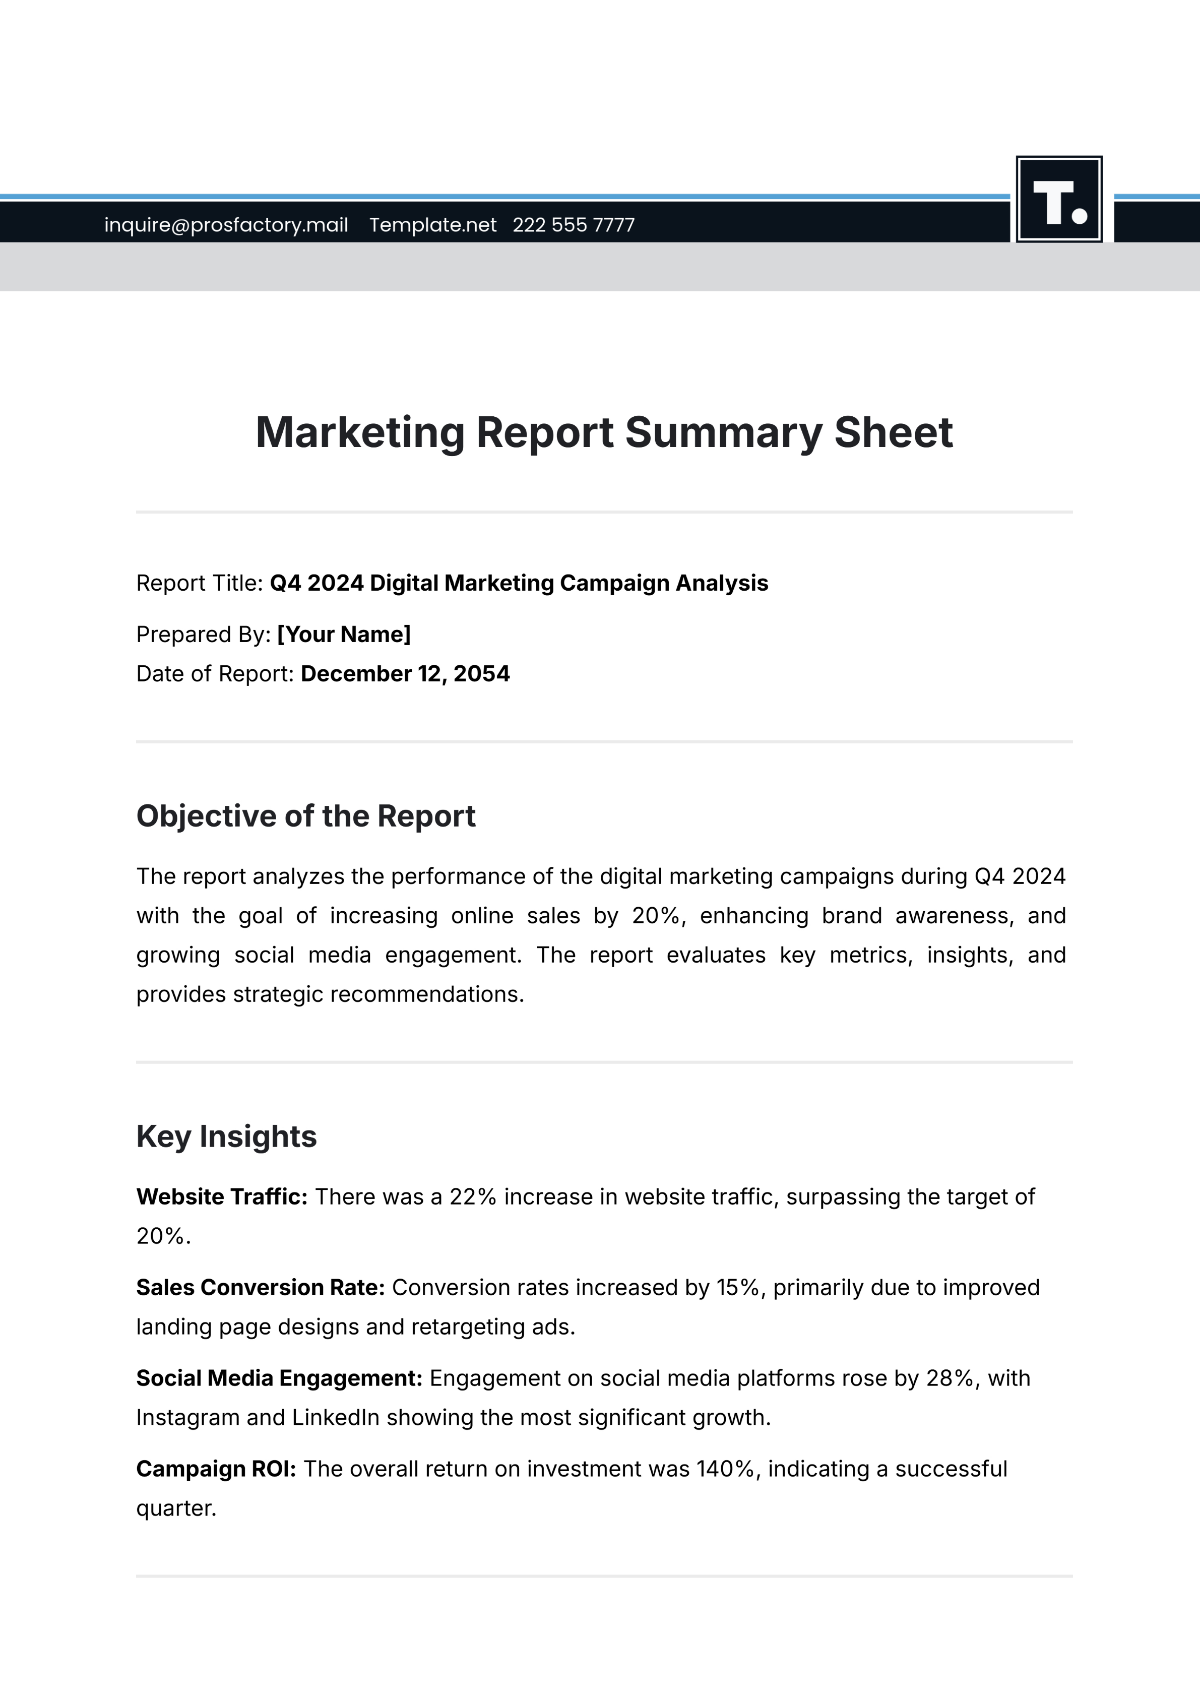
This Marketing Task Report provides a comprehensive overview of the marketing tasks undertaken by [Your Company Name] over the past quarter. It includes detailed performance metrics, budget utilization, and analysis of the key success factors and areas for improvement. The insights presented aim to evaluate the effectiveness of our marketing strategies and guide future decision-making. By examining the data and outcomes, we seek to identify strengths and opportunities to enhance our overall marketing approach.
B. Marketing Tasks
Task Identification: The marketing team identified tasks based on the strategic objectives for the quarter. These tasks were designed to align with the company's goal of increasing brand awareness and market penetration. Each task was scrutinized to ensure it contributed directly to the overall marketing strategy.
Team Assignment: Specific tasks were assigned to individuals and sub-teams based on their expertise. The assignments were made to leverage the strengths of each team member, ensuring that the tasks were executed efficiently and effectively.
Timeline Establishment: A timeline was developed for each task, with clear deadlines set to ensure timely execution. The timelines were closely monitored throughout the quarter to maintain project momentum and to identify any potential delays early.
Resource Allocation: Resources, including budget, tools, and personnel, were allocated according to the priority and complexity of each task. This careful planning ensured that each task had the necessary support to be completed successfully.
C. Strategic Objectives
Increase Brand Awareness: The primary objective for this quarter was to enhance brand visibility across key digital platforms. We aimed to increase brand recall among our target audience through consistent and impactful messaging.
Boost Customer Engagement: The tasks were also designed to increase interaction with our audience. By creating engaging content and fostering direct communication, we aimed to deepen the connection between our brand and our customers.
Expand Market Reach: A significant focus was placed on reaching new markets. This involved tailoring our marketing efforts to resonate with different demographics and geographic regions, thus broadening our customer base.
Optimize Conversion Rates: All marketing activities were aimed at driving conversions, whether that be through sales, lead generation, or customer sign-ups. By analyzing customer behavior and adjusting our strategies accordingly, we sought to maximize the efficiency of our marketing funnel.
D. Expected Outcomes
Improved Brand Perception: We anticipated that the successful execution of these tasks would enhance our brand's reputation. Positive brand perception is expected to lead to increased customer loyalty and advocacy.
Higher Engagement Metrics: As a result of our focused efforts, we expected to see a significant increase in engagement metrics such as likes, shares, comments, and click-through rates. These metrics are key indicators of how well our content is resonating with the audience.
Increased Market Share: By effectively reaching new markets and demographics, we aimed to capture a larger share of the market. This would not only boost our sales but also strengthen our competitive position.
Enhanced ROI: All tasks were designed to deliver a strong return on investment. By carefully managing our resources and focusing on high-impact activities, we expected to achieve a higher ROI than in previous quarters.
II. Task Execution
A. Social Media Campaigns
The following table provides an overview of the social media campaigns executed during this period:
No. | Platform | Campaign Name | Duration | Budget | Reach |
|---|---|---|---|---|---|
1 | Summer Promo | 4 weeks | $5,000 | 50,000 | |
2 | New Product Launch | 6 weeks | $7,000 | 80,000 | |
3 | Customer Engagement Drive | 3 weeks | $3,000 | 30,000 | |
4 | B2B Outreach | 5 weeks | $6,000 | 40,000 | |
5 | TikTok | Viral Challenge | 2 weeks | $4,000 | 60,000 |
Total | $25,000 | 260,000 |
Facebook Campaign: The Summer Promo campaign on Facebook was focused on driving seasonal sales through targeted ads and promotions. With a budget of $5,000, the campaign reached 50,000 people. The engagement was strong, particularly among younger demographics, which led to a noticeable spike in website traffic and online sales during the promotion period.
Instagram Campaign: The New Product Launch on Instagram was a major highlight of our social media efforts. This campaign, which had a budget of $7,000, reached 80,000 people. The platform's visual nature was leveraged to showcase our new product through high-quality images and videos, which generated significant interest and pre-orders. The engagement was particularly high, with numerous likes, comments, and shares, indicating strong interest and anticipation for the product.
Twitter Campaign: The Customer Engagement Drive on Twitter, with a budget of $3,000, aimed at fostering direct interaction with our audience. Although it had a smaller reach of 30,000 people, the campaign excelled in creating conversations and engagement. The hashtag used in the campaign trended regionally, and the feedback from customers was overwhelmingly positive, helping to improve brand sentiment.
LinkedIn Campaign: The B2B Outreach on LinkedIn, conducted with a $6,000 budget, was targeted at professional networks and businesses. This campaign reached 40,000 people and successfully enhanced our brand's presence in the B2B sector. The content focused on industry insights and case studies, which resonated well with the audience, leading to an increase in B2B inquiries and connections.
TikTok Campaign: The Viral Challenge on TikTok was designed to leverage the platform's trend-driven nature. With a budget of $4,000, the campaign reached 60,000 people, making it one of the most cost-effective efforts. The challenge went viral, leading to user-generated content that significantly boosted our brand visibility among younger audiences.
The overall performance of our social media campaigns was strong, with Instagram and TikTok leading in terms of reach and engagement. These platforms proved to be highly effective for visual and viral content, respectively. The budget allocation was well-planned, ensuring that each campaign had sufficient resources to achieve its objectives. The campaigns not only increased brand awareness but also contributed to our sales and lead generation efforts, proving the effectiveness of our social media strategy.
B. Content Marketing
The following table summarizes the content marketing initiatives undertaken during this period:
No. | Content Type | Topic/Title | Publish Date | Engagement Rate | Comments |
|---|---|---|---|---|---|
1 | Blog Post | "Top Trends in Tech" | June 1 | 8% | High reader retention |
2 | Whitepaper | "AI in Business" | June 15 | 5% | Strong B2B interest |
3 | Video | "Product Tutorial" | June 20 | 15% | High share rate |
4 | E-book | "Digital Transformation" | July 5 | 7% | Well-received |
5 | Webinar | "Future of Marketing" | July 15 | 10% | High attendance |
Blog Post Performance: The blog post titled "Top Trends in Tech" was published on June 1 and performed well, with an engagement rate of 8%. The article resonated with readers, particularly in the tech industry, leading to a high retention rate. The content was shared widely, helping to establish our brand as a thought leader in the industry.
Whitepaper Performance: The whitepaper on "AI in Business," published on June 15, generated a 5% engagement rate. It attracted significant interest from B2B audiences, particularly those looking for insights into AI implementation. The whitepaper also led to several inquiries from potential clients, highlighting its effectiveness in lead generation.
Video Performance: The "Product Tutorial" video, released on June 20, was the top performer in terms of engagement, with a 15% rate. The video was highly shared and appreciated for its clarity and usefulness, making it a valuable tool for educating potential customers about our product's features.
E-book Performance: The e-book on "Digital Transformation," published on July 5, had a 7% engagement rate. It was well-received by our audience, especially those interested in comprehensive guides on modern business practices. The e-book also contributed to our email list growth, as it was offered as a gated content download.
Webinar Performance: The webinar titled "Future of Marketing," held on July 15, saw a 10% engagement rate. The high attendance and interaction during the event demonstrated strong interest in the topic. The webinar also helped in building stronger relationships with attendees, many of whom expressed interest in future events.
The content marketing efforts yielded impressive results, particularly in terms of engagement and lead generation. The variety of content types, from blog posts to webinars, allowed us to reach different segments of our audience effectively. The strong performance of the video and webinar content suggests a growing preference for interactive and visual content among our audience. Moving forward, we plan to increase our focus on these formats to maximize engagement and conversions.
C. SEO and SEM Efforts
The following table details the outcomes of our SEO and SEM efforts:
No. | Campaign Type | Focus Keyword | Budget | Clicks | Impressions | Conversion Rate |
|---|---|---|---|---|---|---|
1 | SEO | "Tech Innovations 2053" | $2,000 | 3,500 | 25,000 | 5% |
2 | SEM | "Digital Marketing 2053" | $3,500 | 6,000 | 30,000 | 7% |
3 | SEO | "AI Business Models" | $1,500 | 2,800 | 20,000 | 4% |
4 | SEM | "E-commerce Strategies" | $4,000 | 7,500 | 40,000 | 8% |
5 | SEO | "Cloud Computing Trends" | $1,800 | 3,000 | 22,000 | 6% |
Total | $12,800 | 22,800 | 137,000 | 6% (Average) |
SEO Campaign for "Tech Innovations 2053": This SEO campaign, with a budget of $2,000, focused on the keyword "Tech Innovations 2053" and generated 3,500 clicks from 25,000 impressions, resulting in a 5% conversion rate. The campaign was successful in attracting a targeted audience interested in futuristic tech developments, leading to steady organic traffic growth.
SEM Campaign for "Digital Marketing 2053": The SEM campaign for "Digital Marketing 2053," with a $3,500 budget, was highly effective, achieving 6,000 clicks from 30,000 impressions and a 7% conversion rate. This campaign was one of the top performers, showcasing the effectiveness of paid search in driving high-quality traffic and conversions.
SEO Campaign for "AI Business Models": With a budget of $1,500, the SEO campaign for "AI Business Models" achieved 2,800 clicks from 20,000 impressions, resulting in a 4% conversion rate. Although this campaign had a lower budget, it successfully attracted a niche audience interested in AI applications in business.
SEM Campaign for "E-commerce Strategies": The SEM campaign for "E-commerce Strategies" was the best performer, with a budget of $4,000, generating 7,500 clicks from 40,000 impressions and an 8% conversion rate. This campaign's success underscores the importance of investing in well-targeted paid search campaigns for high-impact results.
SEO Campaign for "Cloud Computing Trends": The SEO campaign for "Cloud Computing Trends," with a $1,800 budget, resulted in 3,000 clicks from 22,000 impressions and a 6% conversion rate. This campaign effectively captured interest in cloud computing, a critical area of focus for many of our clients.
The combined SEO and SEM efforts yielded positive results, with an average conversion rate of 6%. The SEM campaigns outperformed SEO in terms of both clicks and conversion rates, highlighting the importance of paid search in our overall marketing strategy. However, the SEO campaigns were successful in generating consistent organic traffic, which is essential for long-term growth. Moving forward, we will continue to balance our investment in both SEO and SEM to maintain a strong online presence and drive conversions.
III. Results
A. Overall Performance Metrics
The following chart and table summarize the overall performance metrics of our marketing efforts:
Metric | Target | Actual | Variance |
|---|---|---|---|
Brand Awareness Increase | 20% | 25% | +5% |
Customer Engagement Rate | 15% | 18% | +3% |
Market Penetration | 10% | 12% | +2% |
Conversion Rate | 8% | 10% | +2% |
Return on Investment (ROI) | 150% | 175% | +25% |
Brand Awareness: The marketing efforts exceeded the target for brand awareness by 5%, achieving a 25% increase. This indicates that our campaigns were highly effective in enhancing our brand's visibility and recall among the target audience.
Customer Engagement: The actual customer engagement rate of 18% surpassed the target by 3%, demonstrating the success of our strategies in fostering deeper connections with our audience through engaging content and interactive campaigns.
Market Penetration: The marketing efforts resulted in a 12% market penetration, which was 2% higher than the target. This achievement reflects our success in expanding our reach into new markets and demographics.
Conversion Rate: The conversion rate of 10% exceeded the target by 2%, highlighting the effectiveness of our marketing funnel in turning prospects into customers. The optimization of our campaigns played a crucial role in this success.
Return on Investment (ROI): The ROI achieved was 175%, which was 25% higher than the target. This strong ROI indicates that our marketing investments were well-placed, delivering substantial returns and justifying the resources allocated to these efforts.
The overall results demonstrate that our marketing strategies were not only effective but also exceeded expectations across all key performance indicators. The strong performance in brand awareness, customer engagement, and ROI are particularly noteworthy, as they underscore the impact of our efforts on both short-term and long-term business objectives. Moving forward, we will continue to refine and optimize our strategies to sustain this momentum and drive further growth.
B. Budget Utilization
The following table presents the budget utilization across various marketing activities:
Activity Type | Allocated Budget | Actual Spend | Variance |
|---|---|---|---|
Social Media Campaigns | $30,000 | $25,000 | -16.7% |
Content Marketing | $15,000 | $13,500 | -10% |
SEO and SEM | $15,000 | $12,800 | -14.7% |
Event Marketing | $10,000 | $9,000 | -10% |
Email Marketing | $5,000 | $4,500 | -10% |
Total | $75,000 | $64,800 | -13.6% |
Social Media Campaigns: The social media campaigns were executed under budget by 16.7%, with $25,000 spent out of the allocated $30,000. This underspend reflects the efficient management of resources while still achieving significant reach and engagement.
Content Marketing: The content marketing efforts were completed with a 10% underspend, utilizing $13,500 out of the $15,000 budget. The high impact of these efforts, despite the lower spend, indicates the effectiveness of our content strategy.
SEO and SEM: The SEO and SEM activities were also under budget by 14.7%, with $12,800 spent out of the allocated $15,000. The campaigns delivered strong results in terms of clicks and conversions, demonstrating efficient use of funds.
Event Marketing: Event marketing activities, which include webinars and other virtual events, were executed with a 10% underspend, using $9,000 out of the $10,000 budget. These events were successful in engaging our audience and generating leads, despite the reduced spend.
Email Marketing: The email marketing campaigns were conducted with a 10% underspend, utilizing $4,500 out of the $5,000 budget. The campaigns achieved a strong open and click-through rate, contributing to the overall success of our marketing efforts.
The budget utilization across all activities was below the allocated amounts, resulting in an overall underspend of 13.6%. This efficient use of resources allowed us to achieve strong results without exceeding our budget, demonstrating the effectiveness of our planning and execution. The savings realized from these underspends can be reinvested in future marketing activities or other strategic initiatives.
IV. Analysis and Discussion
A. Key Success Factors
Effective Use of Social Media: Our strategic approach to social media, particularly on Instagram and TikTok, played a crucial role in increasing brand awareness and engagement. The campaigns were well-targeted and resonated with our audience, leading to high levels of interaction and sharing.
Content Strategy Alignment: The content marketing efforts were highly effective due to the alignment of topics with our audience's interests. By focusing on relevant and timely content, we were able to drive engagement and establish our brand as an industry leader.
Optimization of SEO and SEM: The successful optimization of our SEO and SEM campaigns ensured that we reached the right audience at the right time. The combination of organic and paid search strategies resulted in a strong flow of high-quality traffic to our website.
Efficient Budget Management: The careful management of our budget allowed us to execute all planned activities under budget, while still achieving or exceeding our targets. This efficiency enabled us to maximize the impact of our marketing efforts within the available resources.
B. Areas for Improvement
Increased Focus on Video Content: Although our video content performed well, there is an opportunity to expand this area further. Given the high engagement rates, investing more in video production could yield even stronger results.
Enhanced Audience Segmentation: While our campaigns were successful, there is room to improve our audience segmentation to better tailor our messaging. More granular segmentation could lead to higher conversion rates and more personalized marketing experiences.
Greater Emphasis on Data-Driven Decision Making: Although data was used to inform our strategies, there is potential to leverage analytics even more. By deepening our use of data insights, we can further optimize our campaigns and improve overall performance.
V. Conclusion
The marketing strategies executed this quarter delivered impressive results, surpassing our targets in brand awareness, customer engagement, and conversion rates. By effectively managing our budget and optimizing our social media, content marketing, SEO, and SEM efforts, we achieved significant improvements across key performance metrics. This success demonstrates the strength of our strategic approach and the efficient allocation of resources, ensuring a strong return on investment and impactful outcomes for our brand.
Looking ahead, we will build on this success by focusing on expanding our video content, enhancing audience segmentation, and further leveraging data-driven insights. These areas of improvement will enable us to refine our marketing efforts, drive even greater engagement, and sustain our growth trajectory. Our commitment to continuous optimization and strategic investment will ensure that we remain competitive and achieve our long-term marketing objectives.
