Behavior Datasheet
Name: | [Your Name] |
Company Name: | [Your Company Name] |
Department: | [Your Department] |
Date: | [Date] |
I. Introduction

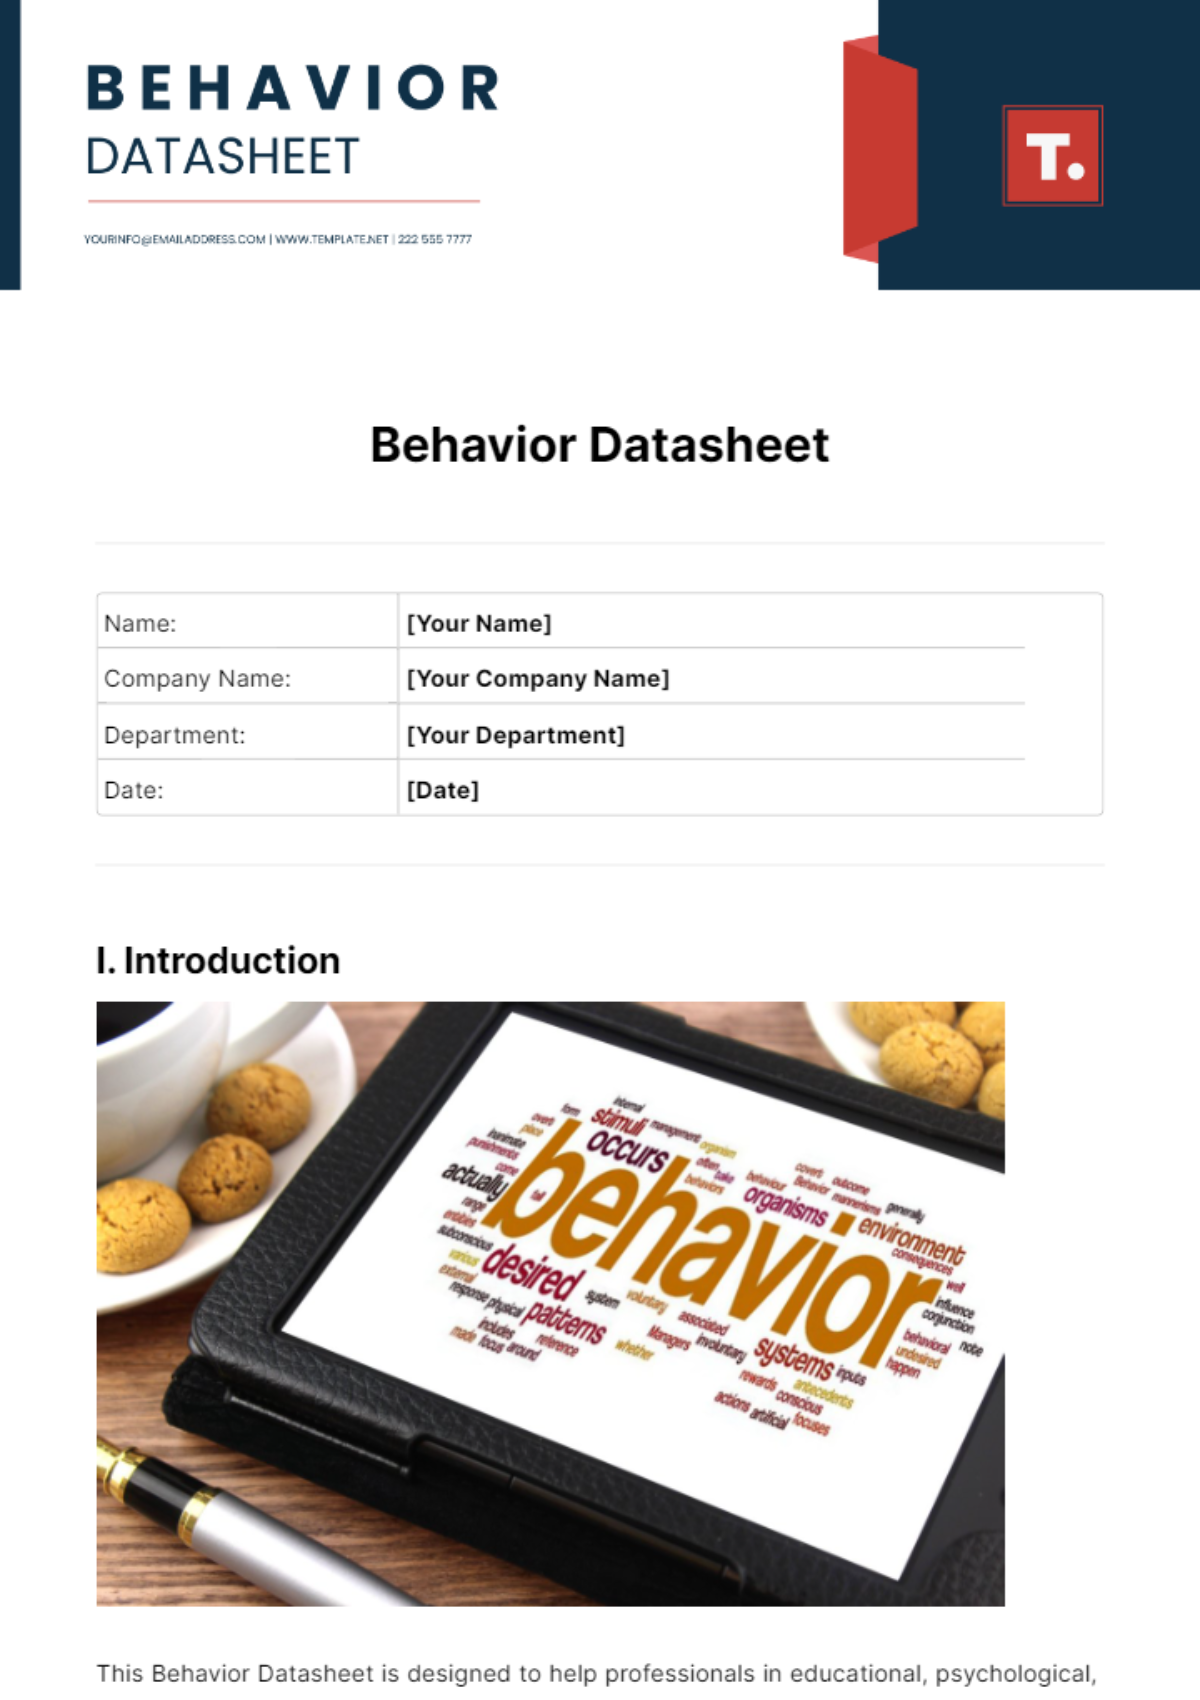
This Behavior Datasheet is designed to help professionals in educational, psychological, and clinical settings systematically record, analyze, and communicate information about specific behaviors. By providing a standardized format, this template aims to streamline the tracking of behavior patterns, interventions, and outcomes, thereby enhancing data accuracy and consistency.
II. Participant Information
Name: | [Participant Name] |
Participant ID: | [Participant ID] |
Age | [Age] |
Gender: | [Gender] |
Medical History: [Participant Name] has a history of anxiety and mild ADHD, diagnosed during childhood. He is currently taking medication for anxiety management.
Family Environment: He lives with his spouse and two children in a suburban setting. Family dynamics are generally supportive, but occasional stressors arise due to work and parenting responsibilities.
Occupation: [Participant Name] works as a software engineer in a fast-paced tech company, involving tight deadlines and high-pressure situations. He commutes daily and has a demanding work schedule.
III. Behavior Description
Target Behaviors
Behavior 1: Excessive Hand-Wringing
Description: Excessive hand-wringing characterized by rapid, repetitive rubbing of hands together, often accompanied by increased heart rate and shallow breathing.
Examples: Occurs during high-stress work situations or social interactions with unfamiliar individuals.
Behavior 2: Avoidance Behaviors
Description: Avoidance behaviors manifested as frequent requests for breaks or distractions (checking phone, browsing unrelated websites) to escape challenging tasks.
Examples: When faced with complex coding tasks or deadlines, tends to engage in avoidance behaviors to reduce perceived pressure.
Behavior 3: Verbal Self-Criticism
Description: Verbal self-criticism involving negative self-talk and expressions of doubt regarding work performance or decision-making abilities.
Examples: Commonly heard phrases include "I can't do this," "I'm not good enough," or "I always mess things up," especially after receiving feedback or encountering setbacks.
IV. Observation Method
Frequency: Observations are conducted daily during work hours and social interactions for two weeks.
Duration: Each observation session lasts approximately 30 minutes to capture a representative sample of behaviors in various contexts.
Intensity Scale: An intensity scale ranging from 1 to 5 is used to measure the severity of behaviors observed during each session.
The observation method systematically tracks behaviors in various situations and times to understand behavioral patterns holistically. This includes daily monitoring during work and social interactions in both professional and personal contexts, with sessions timed to gather ample data without burdening the observer or participant.
V. Data Collection
This table format allows for the structured recording and easy comparison of [Participant Name] behaviors across multiple sessions, with rows indicating observation sessions and columns detailing target behaviors and their intensity levels on a 1-5 scale.
VI. Data Analysis
A. Graphs/Charts
Behavioral Trends Over Time:
Create line graphs for each target behavior (Excessive Hand-Wringing, Avoidance Behaviors, Verbal Self-Criticism) plotted against dates or observation sessions.
Use different colors or markers to distinguish between behaviors for clarity.
Label axes clearly (date/time on the x-axis, intensity level on the y-axis) to facilitate interpretation.
B. Summary Statistics
Descriptive Statistics:
Calculate the mean intensity level for each behavior across all observation sessions.
Compute the median intensity level to identify central tendencies and variations in behavior.
Calculate standard deviation to understand the variability of intensity levels within each behavior.
By creating visual representations such as line graphs for behavioral trends over time, you can visually track changes in behavior intensity and identify any patterns or trends that emerge. These graphs provide a quick and intuitive way to understand how behaviors fluctuate across different dates or sessions.
VII. Interventions/Notes
A. Implemented Interventions
Intervention 1: Cognitive Behavioral Therapy (CBT)
Description: Weekly CBT sessions focusing on identifying and challenging negative thought patterns related to work performance and self-criticism.
Implementation Date: [DATE]
Intervention 2: Stress Management Techniques
Description: Training in mindfulness meditation and relaxation techniques to cope with stress triggers and reduce anxiety symptoms.
Implementation Date: [DATE]
B. Notes/Contextual Factors
Work Environment Stressors: High-pressure deadlines and demanding work tasks contribute to increased anxiety and avoidance behaviors during work hours.
Family Support: Positive interactions and support from family members help alleviate stress and positively influence mood and behavior outside of work settings.
Medication Adherence: Regular adherence to prescribed anxiety medications contributes to overall mood stability but may require periodic adjustments based on behavioral observations and therapy outcomes.
