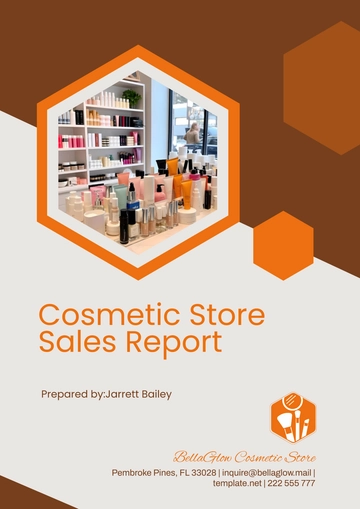
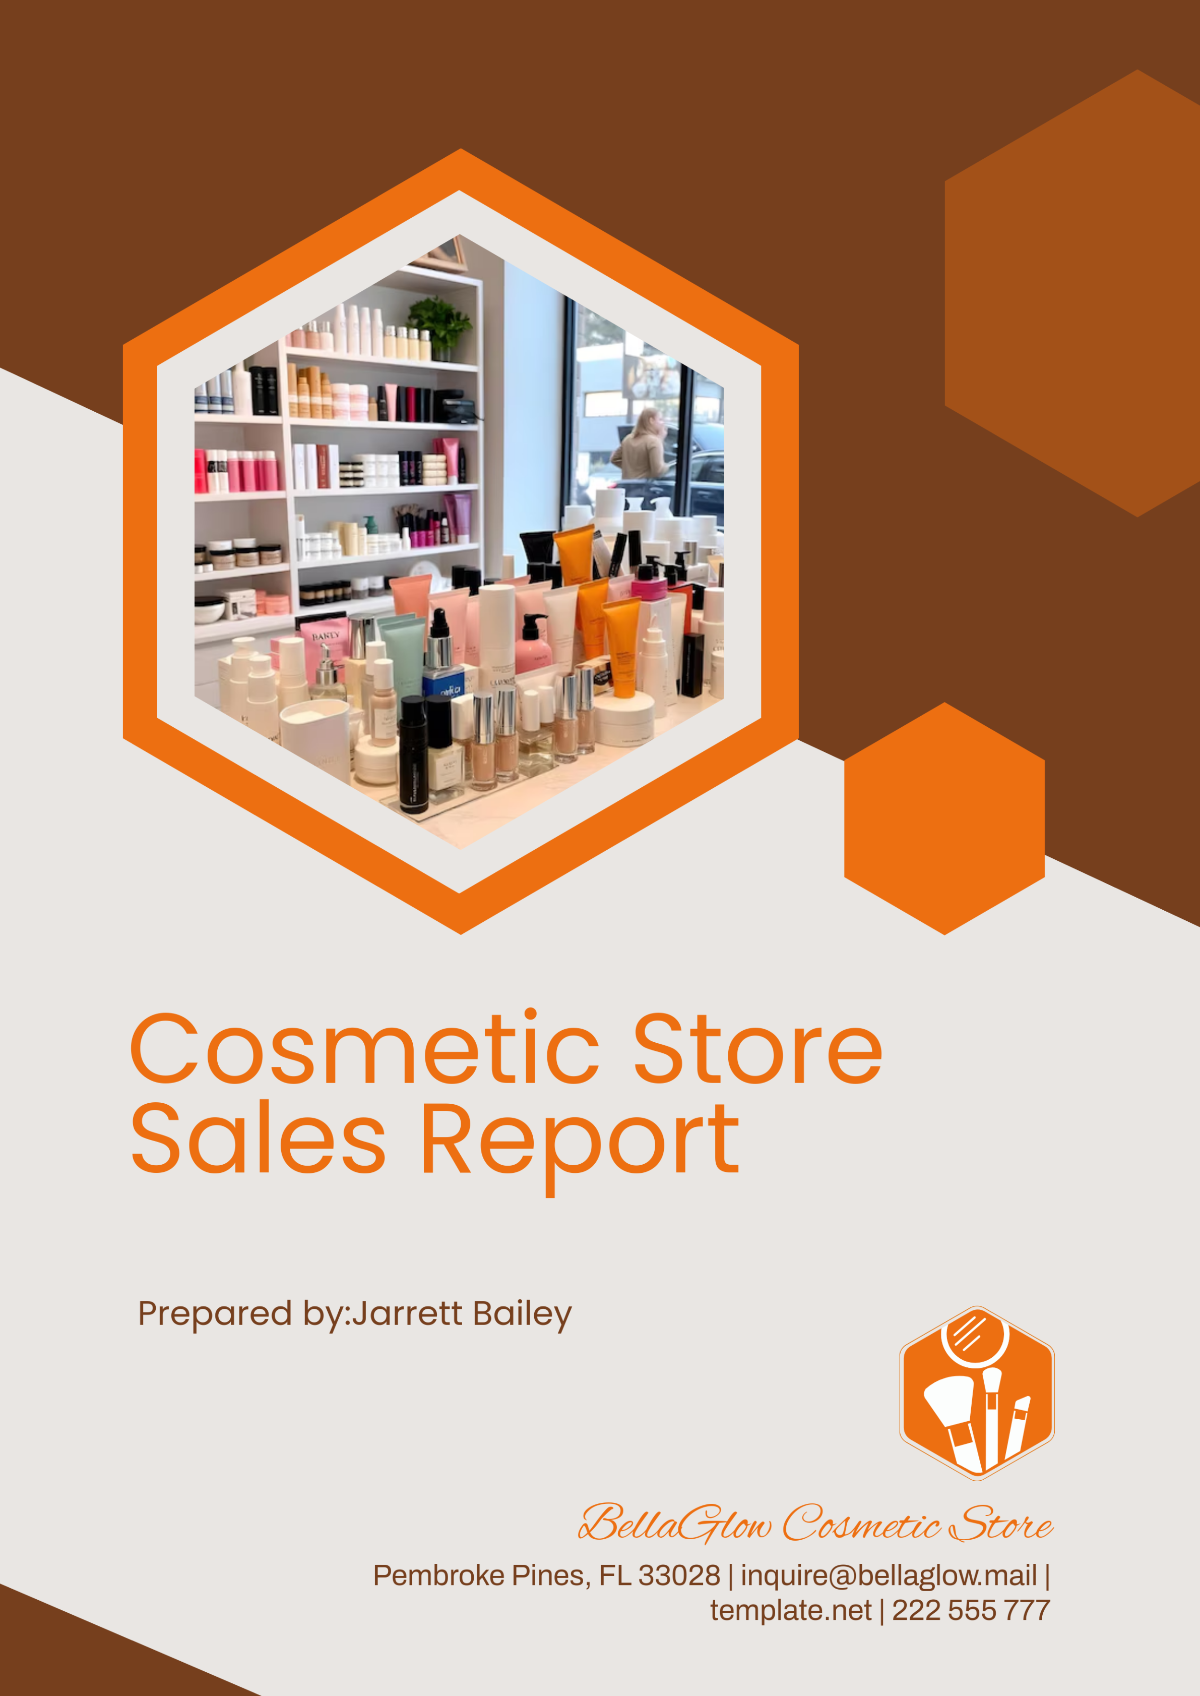
Free Cosmetic Store Sales Report
Year: 2050
Report Date: January 1, 2051
1. Executive Summary
In 2050, [Your Company Name] experienced significant growth across all facets of the business, both in terms of revenue and customer engagement. With a focus on product innovation, strategic marketing, and expanding online presence, the company was able to achieve impressive results. The overall revenue increased by [15%], amounting to [$3.5 million], reflecting the company’s growing presence in the competitive cosmetics market.
Throughout the year, there was a marked shift in consumer preferences, with a noticeable rise in demand for organic, sustainable, and cruelty-free beauty products. This shift allowed [Your Company Name] to tap into an emerging market trend, which contributed heavily to the company’s success. Additionally, our focus on enhancing the online shopping experience and streamlining operations for faster delivery boosted overall customer satisfaction and retention rates.
This report provides an in-depth analysis of the sales performance of [Your Company Name] in 2050, breaking down the figures by sales channels, product categories, customer demographics, and marketing efforts. By examining the trends and insights presented here, [Your Company Name] is positioned to adapt and thrive in the coming years.
1.1 Key Findings
Revenue Growth: In 2050, total revenue reached [$3.5 million], an increase of [15%] from 2049. The growth was primarily driven by strong performance in both online and in-store channels, with online sales contributing to [60%] of the total revenue.
Top Performing Categories: Skincare and haircare products performed exceptionally well, experiencing year-over-year growth rates of [20%] and [18%], respectively. This performance is attributed to new product launches that appealed to health-conscious customers.
Customer Acquisition: New customer acquisition grew by [25%] in 2050. The company’s targeted marketing campaigns, social media influencer collaborations, and enhanced referral programs helped attract new customers.
Customer Retention: Customer retention increased to [75%], a notable improvement from [70%] in 2049. The rise in retention can be attributed to our revamped loyalty program and personalized customer interactions, which created a more engaging shopping experience.
2. Sales Overview
In this section, we provide a thorough breakdown of sales across different channels, product categories, and regions. This section helps stakeholders understand how the company’s revenue was generated and what areas showed the most promise for growth.
2.1 Gross Sales Summary
The following table summarizes our gross and net sales for the year 2050. Gross sales include all sales before discounts, returns, and allowances, while net sales reflect the actual revenue after these deductions.
Metric | Value |
|---|---|
Gross Sales | $3,800,000 |
Discounts | $300,000 |
Returns | $150,000 |
Net Sales | $3,500,000 |
In total, the company achieved gross sales of [$3.8 million], which represents a [12%] increase from the previous year. However, due to discounts offered during promotional events and some returns, net sales amounted to [$3.5 million]. Despite these deductions, the company still experienced strong growth compared to 2049, where the net sales were [$3.05 million].
2.2 Monthly Sales Performance
Sales performance varied throughout the year, with noticeable spikes during key promotional periods such as seasonal sales and product launches. The table below shows our monthly gross and net sales, as well as the average order value (AOV) for each month.
Month | Gross Sales ($) | Net Sales ($) | Total Orders | Average Order Value ($) |
|---|---|---|---|---|
January | 300,000 | 280,000 | 2,500 | 112 |
February | 310,000 | 290,000 | 2,550 | 114 |
March | 280,000 | 265,000 | 2,300 | 115 |
April | 320,000 | 300,000 | 2,800 | 107 |
May | 340,000 | 325,000 | 3,000 | 108 |
June | 350,000 | 340,000 | 3,200 | 106 |
July | 300,000 | 285,000 | 2,700 | 105 |
August | 360,000 | 340,000 | 3,300 | 103 |
September | 330,000 | 310,000 | 2,900 | 107 |
October | 290,000 | 275,000 | 2,400 | 115 |
November | 310,000 | 290,000 | 2,600 | 111 |
December | 370,000 | 350,000 | 3,500 | 100 |
Total | 3,800,000 | 3,500,000 | 29,000 | 115 |
Notably, the months of June, August, and December saw the highest gross sales, likely due to summer promotions, mid-year discounts, and end-of-year holiday sales. The average order value (AOV) remained relatively stable across the year, though it experienced slight dips during busier months like December.
2.3 Sales by Category
The company’s product categories were analyzed to determine which areas of the business drove the most revenue growth. The following table provides insights into how each category performed in 2050.
Category | Gross Sales ($) | Net Sales ($) | YoY Growth (%) |
|---|---|---|---|
Skincare | 1,200,000 | 1,150,000 | 20 |
Haircare | 950,000 | 900,000 | 18 |
Makeup | 750,000 | 700,000 | 12 |
Body Care | 450,000 | 425,000 | 10 |
Fragrances | 250,000 | 225,000 | 8 |
Total | 3,800,000 | 3,500,000 | 15 |
As seen from the data, skincare products led the way with a substantial [20%] growth in net sales, driven by the popularity of our Radiant Glow Serum and other anti-aging skincare solutions. Haircare also saw strong growth, accounting for [18%] of total revenue, while makeup products contributed significantly as well. The makeup category, though growing slower, still represented a large portion of total sales. Fragrances, which traditionally represent a smaller segment, showed slower growth but remained a consistent performer.
3. Customer Insights
Understanding our customer base is critical for tailoring marketing strategies and improving the shopping experience. In this section, we analyze customer demographics, acquisition channels, and retention strategies.
3.1 Customer Demographics
The majority of our customers are within the [25-45] age range, a demographic that increasingly prioritizes sustainability and quality in their beauty purchases. This shift in consumer behavior presents both opportunities and challenges for our business.
Demographic | Percentage (%) |
|---|---|
18-24 | 15 |
25-34 | 40 |
35-45 | 30 |
46+ | 15 |
Gender | |
Female | 55 |
Male | 45 |
The customer base is relatively evenly split between men and women, though the majority of customers are women. The significant number of male customers highlights an emerging market for men's grooming and skincare products. Furthermore, a significant portion of our customer base falls into the [25-34] age range, which is important to note for future product developments and marketing strategies.
3.2 Customer Acquisition & Retention
3.2.1 Acquisition Channels
Our customer acquisition strategy involved various channels, each contributing differently to overall growth. Social media advertising and influencer partnerships proved to be the most effective in attracting new customers.
Social Media: Social media channels like Instagram, TikTok, and YouTube were the primary source of new customers, accounting for [40%] of new acquisitions. Influencers played a large role in product endorsements, helping to build brand credibility.
Referral Program: The referral program, launched in early 2050, was responsible for [15%] of customer growth. Customers were incentivized to refer friends and family in exchange for discounts or loyalty points, which helped to grow the customer base.
Email Campaigns: Email campaigns, while not the largest source of new customers, still accounted for [10%] of total new acquisitions. By sending personalized emails and exclusive offers, we were able to entice previous customers to make repeat purchases or try new products.
3.2.2 Retention Rates
Customer retention is an important metric that indicates the satisfaction and loyalty of our customer base. In 2050, our retention rate increased to [75%], up from [70%] last year.
The key to improving retention was the introduction of our updated loyalty program, which offered more personalized rewards, such as exclusive discounts, birthday offers, and early access to new product releases. Additionally, customer support improved with faster response times, more efficient complaint resolution, and an overall more engaging post-purchase experience.
4. Marketing Analysis
Marketing remains one of the most significant drivers of our success. By analyzing the performance of various marketing channels and strategies, we can identify the most effective approaches, optimize our future campaigns, and continue to maximize ROI.
4.1 Marketing Channels and Strategies
The following table summarizes the performance of key marketing channels in 2050, providing insights into which channels were most effective in driving revenue and engagement.
Marketing Channel | Revenue Contribution (%) | Growth YoY (%) |
|---|---|---|
Social Media Ads | 40 | 25 |
Email Marketing | 15 | 20 |
Influencer Marketing | 25 | 30 |
SEO & Content Marketing | 10 | 10 |
Traditional Ads | 5 | 5 |
Referral Program | 5 | 15 |
Social Media Ads: The most dominant contributor to revenue, social media ads accounted for [40%] of total sales in 2050, with a remarkable [25%] year-over-year growth. The increase in revenue can be attributed to highly targeted ad campaigns on platforms like Instagram, Facebook, and TikTok, where we tailored our content to appeal directly to our target demographics. Engaging visuals, well-crafted messages, and effective retargeting strategies played a crucial role in driving conversions.
Email Marketing: Email campaigns performed well in 2050, contributing [15%] of total revenue. Email marketing saw a year-over-year growth of [20%], driven by personalized content and segmentation strategies. Key tactics included personalized offers, re-engagement campaigns for abandoned carts, and exclusive promotions for loyal customers. Leveraging customer data to personalize content allowed us to nurture relationships and boost retention rates.
Influencer Marketing: Influencer marketing continued to be an effective tool, contributing [25%] to our overall revenue, with a [30%] growth from the previous year. Collaborations with beauty influencers, particularly those on TikTok and Instagram, proved successful in reaching a younger, trend-conscious audience. Partnerships included paid content, product reviews, tutorials, and influencer-hosted giveaways. The authenticity and relatability of influencers enhanced brand trust and helped drive high engagement.
SEO & Content Marketing: SEO and content marketing remained steady, contributing [10%] to total revenue. While growth was moderate ([10%] YoY), this channel continues to be a critical part of our long-term strategy. Organic traffic from search engines, alongside optimized blog content, helped us maintain visibility and attract customers searching for beauty solutions.
Traditional Ads: Despite a shift toward digital marketing, traditional ads (TV, print, and radio) still played a role, particularly in local and regional markets. However, the contribution to total revenue was limited to [5%], with a year-over-year growth of just 5%. These ads helped sustain brand awareness, especially for new product launches.
Referral Program: Our referral program made a notable impact, increasing by [15%] YoY. By offering incentives such as discounts and loyalty points for both the referrer and the referred, we encouraged our existing customers to help spread the word about our products. This program not only contributed to sales but also helped expand our customer base through word-of-mouth marketing.
4.2 Influencer Partnerships
Influencer marketing was a key focus in 2050, and our strategic partnerships proved highly successful in driving brand awareness and sales. Working with a mix of micro and macro influencers on Instagram and TikTok, we saw tremendous engagement from a younger, more digitally savvy demographic. The influencers featured our products in their beauty routines, unboxing videos, and "first impressions" posts, driving high traffic to our e-commerce site.
These partnerships were not limited to simple sponsored posts. We engaged in long-term collaborations, offering influencers early access to new products, behind-the-scenes looks, and even co-branded events. This approach helped us foster authentic connections with consumers, resulting in increased trust and conversions.
Additionally, influencer-hosted giveaways provided a unique opportunity for brand exposure and direct customer engagement. These giveaways generated excitement around our products, encouraged user-generated content, and provided a fun and interactive way for our audience to engage with the brand.
4.3 Customer-Generated Content
Alongside influencer marketing, customer-generated content (CGC) proved valuable. Customers shared their experiences with our products on social media, contributing to organic reach. We actively encouraged customers to post their reviews, before-and-after photos, and video testimonials using branded hashtags. These real-life experiences resonated with potential buyers and helped establish the credibility of our products.
We also ran social media campaigns inviting customers to share their beauty routines using our products, with the chance to win exclusive rewards. This not only boosted engagement but also helped create a sense of community around our brand.
5. Product Development & Innovations
The evolution of our product offerings has been central to maintaining growth and consumer interest. In 2050, we continued to innovate, develop new products, and improve existing ones based on customer feedback and market trends.
5.1 New Product Launches
In 2050, we launched several new products designed to meet the growing demand for clean, sustainable, and cruelty-free beauty options. These products catered to specific skin concerns, such as hyperpigmentation, aging, and hydration. We also introduced a line of eco-friendly packaging to meet the rising consumer demand for sustainable solutions.
Sustainable Skincare Line: Our new skincare line, featuring organic ingredients and recyclable packaging, was a hit among eco-conscious consumers. The line included moisturizers, serums, and face masks that catered to different skin types. These products were carefully formulated without parabens, sulfates, or artificial fragrances, making them ideal for those with sensitive skin.
Haircare Innovations: The launch of a sulfate-free, vegan shampoo and conditioner set targeted at curly and textured hair became one of our bestsellers. Customers praised its nourishing formula and the results it provided for frizz control and hydration. The success of this product signaled an opportunity for further expansion into the haircare market.
Limited Edition Collections: We introduced limited edition seasonal collections, such as holiday-themed skincare sets and collaborations with artists and influencers. These limited runs generated excitement, spurring customers to purchase before they were sold out, and helped us build anticipation for future releases.
5.2 Product Testing & Customer Feedback
In 2050, customer feedback was integral to our product development process. We used a combination of surveys, focus groups, and social media polls to gather insights and test product ideas before launching them on a large scale. These customer-driven insights helped us refine formulations, improve packaging, and ensure that new products met the needs of our target audience.
Customer testing also extended to post-launch, where we closely monitored feedback through online reviews, social media comments, and direct customer service interactions. By acting on this feedback quickly, we were able to make necessary adjustments, improving customer satisfaction and encouraging repeat purchases.
6. Conclusion
The year 2050 marked a pivotal moment in our company’s growth trajectory. We successfully expanded our customer base, optimized marketing efforts, and launched innovative products that resonated with our audience. Our ability to adapt to market trends and listen to customer feedback was key to our success.
Looking forward to 2051, our focus will be on further scaling our operations, strengthening our brand presence, and continuing to innovate. We plan to double down on our efforts in influencer marketing, email personalization, and sustainable product offerings to ensure we stay ahead of the competition.
As we move into the future, we will continue to prioritize our customers' needs, leverage data to optimize our strategies, and foster long-lasting relationships with our community. The foundation we’ve built in 2050 will serve as a springboard for even greater success in the coming years.
- 100% Customizable, free editor
- Access 1 Million+ Templates, photo’s & graphics
- Download or share as a template
- Click and replace photos, graphics, text, backgrounds
- Resize, crop, AI write & more
- Access advanced editor
Track your sales performance effectively with the Cosmetic Store Sales Report Template from Template.net. This editable and customizable template allows you to organize data on sales trends, revenue, and product performance. Customize it in our Ai Editor Tool for accurate, insightful reporting.
You may also like
- Sales Report
- Daily Report
- Project Report
- Business Report
- Weekly Report
- Incident Report
- Annual Report
- Report Layout
- Report Design
- Progress Report
- Marketing Report
- Company Report
- Monthly Report
- Audit Report
- Status Report
- School Report
- Reports Hr
- Management Report
- Project Status Report
- Handover Report
- Health And Safety Report
- Restaurant Report
- Construction Report
- Research Report
- Evaluation Report
- Investigation Report
- Employee Report
- Advertising Report
- Weekly Status Report
- Project Management Report
- Finance Report
- Service Report
- Technical Report
- Meeting Report
- Quarterly Report
- Inspection Report
- Medical Report
- Test Report
- Summary Report
- Inventory Report
- Valuation Report
- Operations Report
- Payroll Report
- Training Report
- Job Report
- Case Report
- Performance Report
- Board Report
- Internal Audit Report
- Student Report
- Monthly Management Report
- Small Business Report
- Accident Report
- Call Center Report
- Activity Report
- IT and Software Report
- Internship Report
- Visit Report
- Product Report
- Book Report
- Property Report
- Recruitment Report
- University Report
- Event Report
- SEO Report
- Conference Report
- Narrative Report
- Nursing Home Report
- Preschool Report
- Call Report
- Customer Report
- Employee Incident Report
- Accomplishment Report
- Social Media Report
- Work From Home Report
- Security Report
- Damage Report
- Quality Report
- Internal Report
- Nurse Report
- Real Estate Report
- Hotel Report
- Equipment Report
- Credit Report
- Field Report
- Non Profit Report
- Maintenance Report
- News Report
- Survey Report
- Executive Report
- Law Firm Report
- Advertising Agency Report
- Interior Design Report
- Travel Agency Report
- Stock Report
- Salon Report
- Bug Report
- Workplace Report
- Action Report
- Investor Report
- Cleaning Services Report
- Consulting Report
- Freelancer Report
- Site Visit Report
- Trip Report
- Classroom Observation Report
- Vehicle Report
- Final Report
- Software Report

