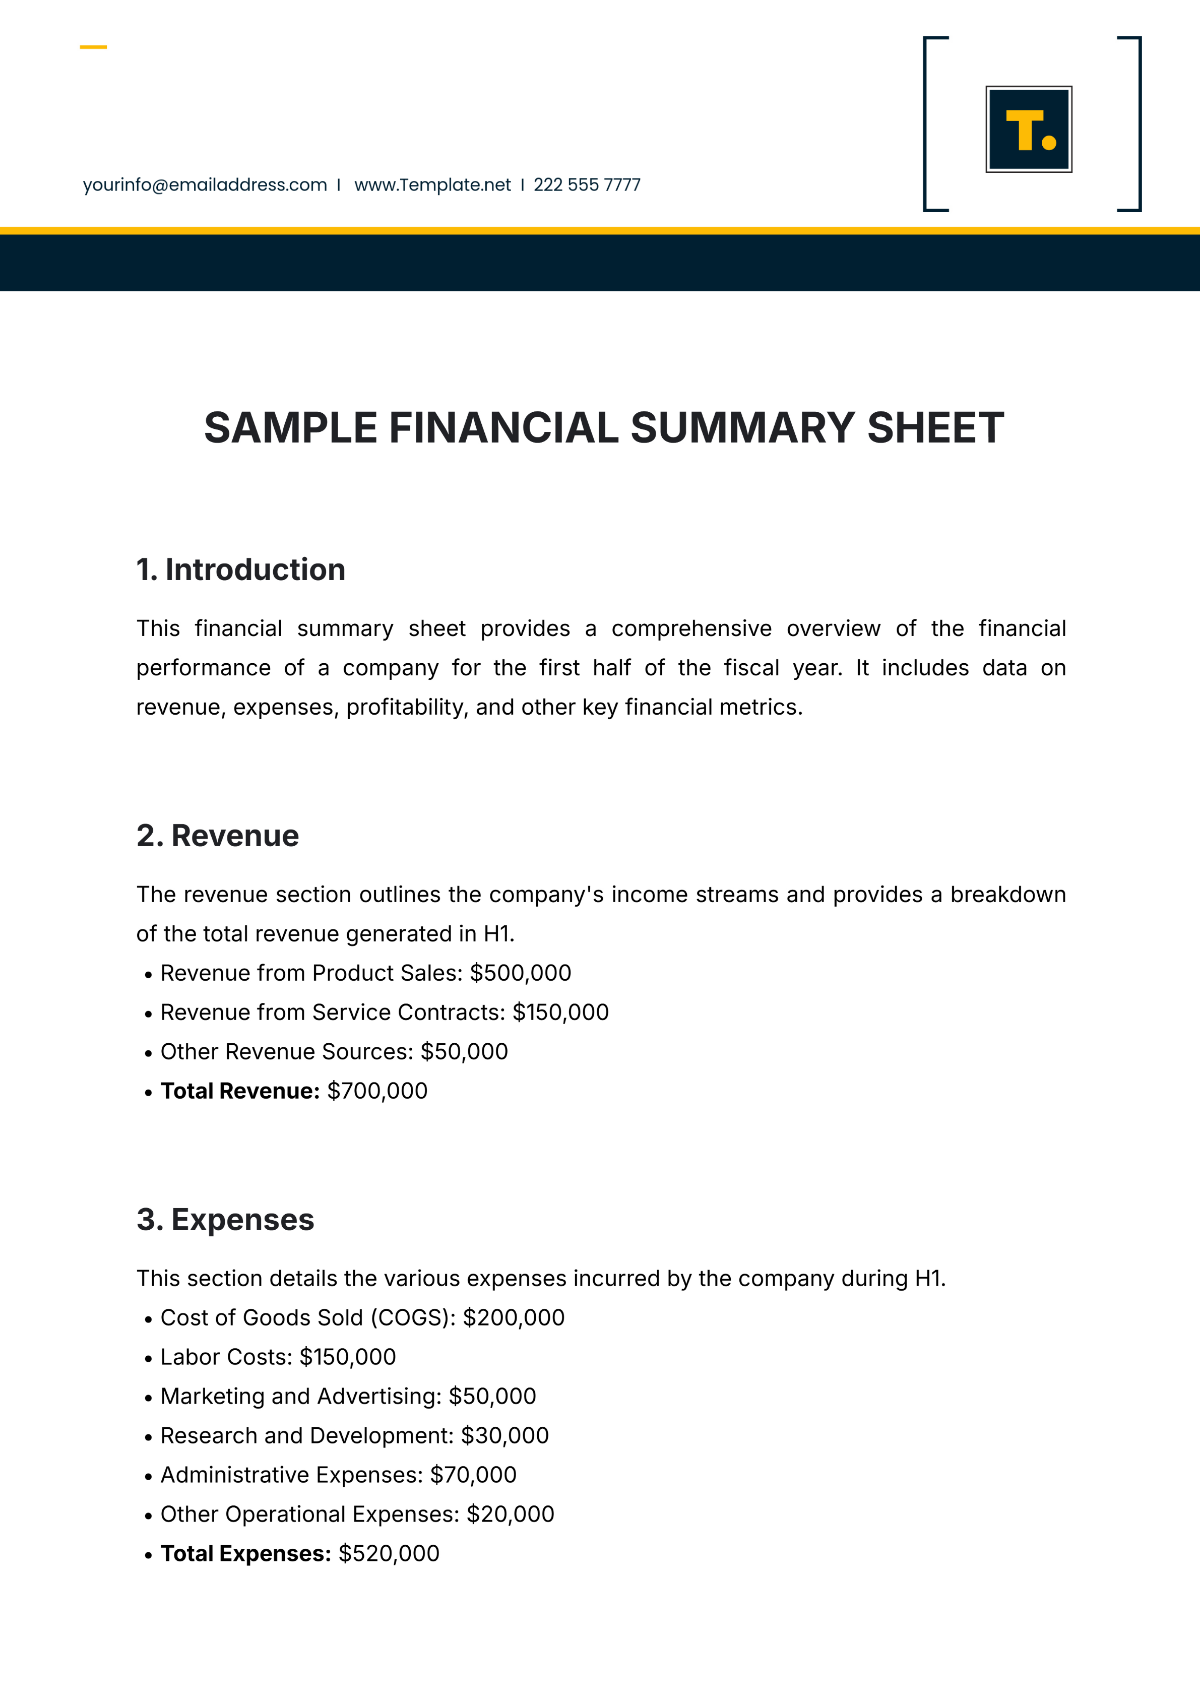
SAMPLE FINANCIAL SUMMARY SHEET
1. Introduction
This financial summary sheet provides a comprehensive overview of the financial performance of a company for the first half of the fiscal year. It includes data on revenue, expenses, profitability, and other key financial metrics.
2. Revenue
The revenue section outlines the company's income streams and provides a breakdown of the total revenue generated in H1.
Revenue from Product Sales: $500,000
Revenue from Service Contracts: $150,000
Other Revenue Sources: $50,000
Total Revenue: $700,000
3. Expenses
This section details the various expenses incurred by the company during H1.
Cost of Goods Sold (COGS): $200,000
Labor Costs: $150,000
Marketing and Advertising: $50,000
Research and Development: $30,000
Administrative Expenses: $70,000
Other Operational Expenses: $20,000
Total Expenses: $520,000
4. Profitability
This section highlights the company's profit margins and net income for the first half of the year.
Metric | Amount ($) |
|---|---|
Gross Profit | 180,000 |
Operating Profit | 130,000 |
Net Profit | 90,000 |
The company's gross profit margin stands at 25.7%, while the net profit margin is 12.86%.
5. Cash Flow
The cash flow section describes the company's cash inflows and outflows and assesses the liquidity position as of H1.
Cash Inflows: $750,000
Cash Outflows: $600,000
Net Cash Flow: $150,000
6. Conclusion
The financial summary sheet offers vital insights into the company's financial health. For the first half of the year, the company has maintained solid profitability with a net profit of $90,000 and a healthy net cash flow. This positive financial position is attributed to effective cost management and strong revenue growth.
